 Duplex
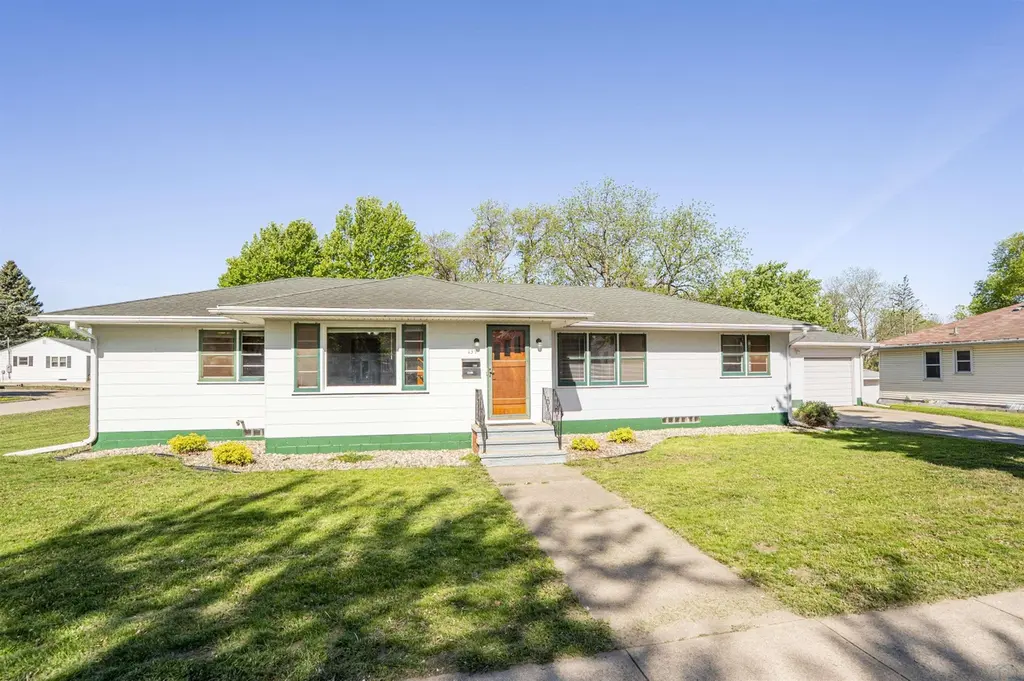
139 6th Ave Ave SW · Le Mars, IA
Flood risk 6/10 · Moderate
- FEMA flood zone
- X (unshaded)
- Chance of flooding over 30 yrs
- 0.74%
- Est. flood insurance / yr
- $473 – $860
Fire risk 2/10 · Minimal
- Est. fire insurance / yr
- $902 – $1,676
Heat risk 3/10 · Minor
- Hot days now (above 103°F)
- 7 days/yr
- Hot days in 30 yrs
- 15 days/yr
Wind risk 2/10 · Minimal
- Chance of severe wind over 30 yrs
- —
Air-quality risk 2/10 · Minimal
- Unhealthy air days now
- 1 days/yr
- Unhealthy air days in 30 yrs
- 1 days/yr
Risk factors via First Street. Map © Google.
Why this score? — see what drove the B grade
The composite is a weighted blend of 9 inputs, each scored 0–100. Each bar is that input's sub-score; the figure is the points it added to the 100-point composite (weight × sub-score).
- Cash flow +30.0/30.0
- DSCR +10.0/10.0
- 1% rule +9.7/10.0
- Schools +6.2/10.0
- ARV discount +5.3/15.0
- Livability +4.1/5.0
- Rent growth +2.5/5.0
- Condition / age +2.5/5.0
- Appreciation +0.0/10.0
$232,500
🖨 Deal sheet 📄 Offer letter ✓ Due diligence
Multi-family units
County records classify this as Multi-Family (2-4 Unit). Listing-text estimate: 2 units. confirmed
Listing remarks
Excellent investment opportunity or owner-occupied duplex! This well-maintained property features two separate main floor units, each offering a comfortable living room, 2 bedrooms, full bathroom, and kitchen (appliances included). The main floor units can be securely locked separately, providing privacy and flexibility for tenants or multi-generational living. The shared basement is accessed through a common stairway, with each unit having its own dedicated laundry area, furnace, central air conditioner, water softener, and electrical panel. Unit 139 1/2 includes the ability to lock off its portion of the basement, which features a non-conforming bathroom and an additional room with potent
Key facts
- Large backyard
- Vinyl plank flooring
- 0.38 acre lot
Tags
Property features AI
Finance
- Financial info: Two 2-bedroom units with listed rents of $770 and $850
Exterior
- Parking: Detached concrete garage with 2 garage spaces
- Utilities: Public water; Public sewer
- Home design: Multi-family / Multi-unit residential income property
- Exterior features: Level lot
Interior
- Bedrooms: Each unit has 2 bedrooms
- Bathrooms: Each unit has 2 full bathrooms
- Heating & cooling: Central air conditioning; Electric forced-air heating
- Interior features: Two 2-bedroom units (multi-family residential income property)
Neighborhood map
What this means for you Summary
Snapshot
- This is a 2 × 2-bed/1.0-bath units multifamily listed at $232k.
Deal economics
- At list price, monthly cash flow is $1k ($15k/yr) — positive. Per door: $605/mo.
- The deal already cash-flows at list — no discount required.
- Meets the 1% rule at list price ($3k rent vs $232k).
- Cap rate 12.5% vs local median 2.7% in Le Mars — top-decile yield for the area; either an underpriced asset or a hidden risk that comps aren't pricing in. Stress-test before assuming the spread holds.
Location & tenants
- Location reads 82/100 on livability (#48 in IA, #1,235 nationally) — a professional / high-income tenant draw. Strengths: schools A+, crime A+, cost of living A+; Watch: amenities F, commute F.
- Le Mars Community School District (town): math 73% / reading 72% proficiency, ranked #96 of 289 in IA (top 33%) — strong family-tenant draw, lease renewals of 3-5y typical.
- Market conditions: 58 active listings in the ZIP; 147 units permitted in Plymouth County in 2024 (112 in 5+ unit buildings).
Forward outlook
- Local home prices are declining (-3.0%/yr); year-one equity from $2k of loan paydown is wiped out by about $7k of value loss. Plan a longer hold.
- At projected returns (-3.0% appreciation + 3.0% rent growth), your $65k cash investment doubles in ~6 years — after that, you're playing with house money.
Negotiation context
- Only 3 days on market — expect competitive offers; lowballing is unlikely to land.
- Current owner paid $92k; list at $232k implies a 153% gain — meaningful room to come down on a strong offer.
Risks & watch-outs
- Watch-outs: built in 1954 — expect roof / HVAC / electrical / plumbing capex.
- Climate carrying-cost: major flood risk — expect insurance premiums to compound above CPI over the hold.
Questions for the listing agent
- Can we see the unit-by-unit rent roll, current vacancy, and any below-market leases? What's the average tenancy length?
- What capital expenditures (roof, boiler, parking lot, exteriors) have been made in the last 5 years, and what's planned in the next 2?
- Built in 1954 — when were the roof, HVAC, electrical panel, plumbing, and water heater last replaced?
- Is there a deadline driving the sale (1031 exchange, divorce, estate, relocation)? That informs how much negotiation room exists.
- Schools are A-rated — typically a magnet for longer-tenancy family renters. What's the average tenant stay here, and is there a school-zone premium baked into asking?
- What's the average days-on-market for RENTAL listings here right now (not sales)? A rising rental-DOM trend means longer vacancies and softer asking-rent achievability than the comps imply.
- What's the recent tenant-quality profile in this submarket — average credit score on applications, eviction rate, late-payment / NSF rate, and stable-employment percentage? A property-management company in the area should have these aggregated.
- How much new apartment / multifamily construction is in the pipeline within 1–3 miles? Heavy new supply (>2% of stock underway) typically softens rents 12–24 months out; light construction supports rent growth.
Investment metrics
- 1% rule
- 1.47% ✓
- Cap rate
- 12.54%
- Cash-on-cash
- 22.29%
- DSCR
- 1.99
- GRM
- 5.7
CMA / ARV
- ARV (on-the-fly)
- $221,652
- Comps found
- 1
Show comp detail 1 sale within ~0.75 mi
| Address | Dist | Beds/Ba | Sqft | Sold | Price | $/sf | Match |
|---|---|---|---|---|---|---|---|
| 139 6th Ave Ave SW | 0.00mi | 4/2.0 | 1,572 (0%) | 0mo | $222,000 | $141 | 98 |
Match score weights: distance 35% · size 25% · config 20% · recency 20%. Top-matched comps best support the ARV.
Projected returns pro-forma
-3.0% appreciation · 3.0% rent growth · sell at horizon
- IRR
- 15.1%
- Equity multiple
- 1.60×
- Total profit
- $39,343
- Equity at exit
- $34,667
- IRR
- 23.8%
- Equity multiple
- 3.05×
- Total profit
- $133,392
- Equity at exit
- $20,102
Cash invested: $65,100 (down + closing). Projections, not guarantees.
Landlord ↔ Tenant lean methodology
- Overall (STATE)
- 83 Strongly Landlord-Friendly
- State Iowa
- 83 Strongly Landlord-Friendly · R+6
- County
- — inherits STATE
- City
- — inherits STATE
ZIP-level market 51031
- Home prices YoY
- -22.2%
- Active inventory
- 58
- Price-to-rent
- 11.3×
Monthly cashflow live
- Estimated rent
- $3,428 medium interval (Pro) →
- Mortgage (P&I)
- −$1,219
- Tax from tax record
- −$182 /mo · $2,190/yr
- Insurance
- −$97
- HOA
- −$0
- Vacancy / Maint / Mgmt
- −$720
- Net cashflow
- $1,209
Break-even live
2-unit breakdown (identical units grouped — click to expand)
| Units | Beds | Baths | Est. rent |
|---|---|---|---|
| 2× units | 2 | 1 | $3,428 |
| #1 | 2 | 1 | $1,714 |
| #2 | 2 | 1 | $1,714 |
| Total (2 units) | $3,428 | ||
UW: 25.0% down · 7.5% · 30yr · 1.5% tax · 5.0% vac · 8.0% maint · 8.0% mgmt
Financing live
Cash to close
- Down payment
- $58,125
- Closing costs
- $6,975
- Reserves months
- —
- Total cash needed
- —
Loan-product check · same deal, 3 products live
Conventional
25% down · 7.5% · 30yr
- Down + closing
- —
- Monthly P&I
- —
- Monthly cashflow
- —
- DSCR
- —
- Eligible?
- —
Personal DTI + credit; lowest rate.
DSCR
20% down · 8.5% · 30yr
- Down + closing
- —
- Monthly P&I
- —
- Monthly cashflow
- —
- DSCR
- —
- Eligible?
- —
No personal income docs; deal must DSCR.
Hard money
10% down · 12.0% · 12mo
- Down + closing
- —
- Monthly P&I
- —
- Monthly cashflow
- —
- DSCR
- —
- Eligible?
- —
Short-term bridge; refi at stabilization.
Listing history 3 events
-
2026-05-15status Pending
-
2026-05-12$232,500 Active
-
2013-01-31soldstatus $92,000
ⓘ Source: listings_history table (triggers on properties + properties_extension) + one-shot
backfill from property_details.listing_events for pre-trigger history.
Tax reassessment forecast IA · Partial reset (capped growth)
- Current annual tax
- $2,190 · $182/mo
- Projected year-2 tax
- $2,920 · $243/mo
- Expected delta
- +$730/yr (+$61/mo · 33.3%)
ⓘ Screening estimate from a state-policy table — verify with the county assessor before closing.
Climate risk First Street
- Flood 6/10 Major FEMA zone X (unshaded) · 74% chance over 30 yrs
- Wildfire 2/10 Low
- Heat 3/10 Moderate 7 d/yr ≥103°F today · 15 d/yr by 30 yrs out
- Wind 2/10 Low
- Air quality 2/10 Low 1 unhealthy d/yr today · 1 by 30 yrs out
Nearby sold comps map
Loading sold comps map…
Walkable amenities ~0.75 mi
Loading nearby amenities…
Taxation est. · year 1
- Rental income
- $41,136
- − Mortgage interest
- −$13,024
- − Property taxes
- −$2,190
- − Insurance
- −$1,162
- − Repairs & maintenance
- −$3,291
- − Management
- −$3,291
- − Depreciation
- −$6,764
- Taxable income
- $11,414
- Est. tax owed @ 24.0%
- −$2,739
- After-tax cash flow
- $11,774/yr
For passive investors: Depreciation is non-cash, so a rental often shows a tax loss while cash-flowing — sheltering income. Rental losses are passive: they offset passive income freely, and up to $25,000/yr can offset ordinary (W-2) income if you actively participate and your MAGI is under $100k (phasing out to $0 by $150k); unused losses carry forward. On sale, claimed depreciation is recaptured at up to 25%, and gains may owe capital-gains tax (a 1031 exchange can defer both). Figures are a year-1 estimate at your 24.0% rate — not tax advice; consult a CPA.
Schools (NCES district)
- District
- Le Mars Community School District
- NCES district ID
- 1916530
- Math proficiency
- 73% ▼ -5.00%
- Reading proficiency
- 72% ▼ -1.00%
- Median HH income
- $55,414
- Composite
- 61.97/100
- National rank
- #723
- State rank
- #96 of 289 in IA
Livability — Le Mars
- Score
- 82/100
- State rank
- #48
- US rank
- #1235
Category grades
Schools grade is shown separately in the Schools card above.
Census & demographics
- Census place
- Le Mars, IA
- Population (ZIP)
- 12,785
Population outlook (Plymouth County) Hauer SSP2
- Today (2025)
- 25,214 people
- By 2030
- 25,257 · +0.2%
- By 2040
- 25,304 · +0.4%
- By 2050
- 25,421 · +0.8%
- By 2075
- 26,820 · +6.4%
- By 2100
- 27,604 · +9.5%
Race, ethnicity, and origin ACS 2023
- Neighborhood character
- Predominantly White (85%)
- Race & ethnicity
- White 85% Hispanic / Latino 9% Black 4% Two or more races 4%
- Hispanic origin (detail)
- Mexican 6%
- Common ancestry
- Iranian 6% Portuguese 3% Ukrainian 2%
- Foreign-born
- 6% · Canada
- Languages at home
- 88% English-only · Spanish 7% German/W. Germanic 1%
Political lean MEDSL · Plymouth
- 2024 margin
- Solid R (+54.2) · D 22.3% · R 76.5% · Other 1.2%
- 2008→2024 swing
- -29.2pp toward R · 2008: -25.1pp · 2024: -54.2pp
- All cycles
- 2024: R+54.2 2020: R+49.3 2016: R+51.9 2012: R+34.3 2008: R+25.1
Not yet ingested
- Civics
- —
Market trends
- HPI YoY
- ▼ -81.02%
- Current HPI
- 283.6093
- Rent YoY
- —
- Metro
- —
- State GDP YoY
- ▲ 2.48%
- F500 in state
- 4
Industry mix (Fortune 500 HQ in IA)
| Industry | F500 HQs | Revenue |
|---|---|---|
| Financial Services | 1 | $16B |
|
||
| Retail / Convenience | 1 | $15B |
|
||
Price history
+152.7% since first listed3 events — show timeline
- 2026-05-15 Pending — NWIA
- 2026-05-12 Listed $232,500 NWIA
- 2013-01-31 Sold (Public Records) $92,000 Public Records
Property tax history
+2.8%/yrLatest (2025): $2,190 · +2.0% YoY. Source: county tax records.
Cash-flow waterfall
monthlySold comps — $/sqft
last 12 mo · ≤1 miLoading sold comps…