 11-Plex
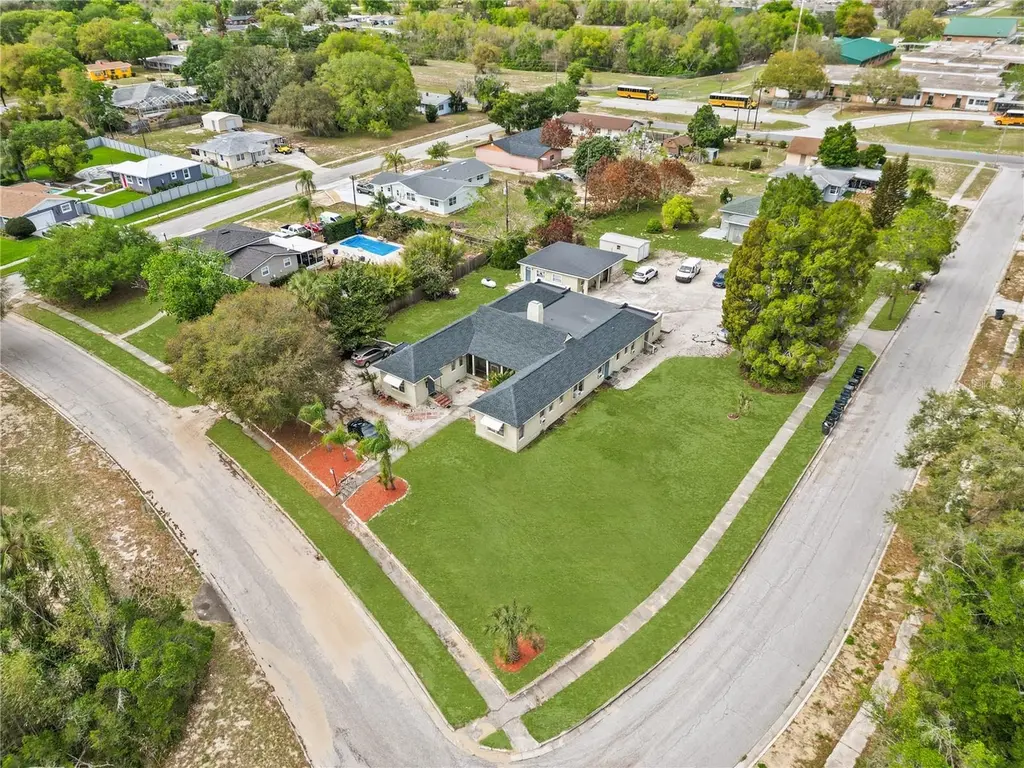
315 Ridge Manor Dr · Lake Wales, FL
Flood risk 1/10 · Minimal
- FEMA flood zone
- X (unshaded)
- Chance of flooding over 30 yrs
- 0.0%
- Est. flood insurance / yr
- $507 – $1,088
Fire risk 5/10 · Moderate
- Est. fire insurance / yr
- $947 – $1,759
Heat risk 8/10 · Major
- Hot days now (above 108°F)
- 7 days/yr
- Hot days in 30 yrs
- 23 days/yr
Wind risk 9/10 · Severe
- Chance of severe wind over 30 yrs
- 99.0%
Air-quality risk 2/10 · Minimal
- Unhealthy air days now
- 0 days/yr
- Unhealthy air days in 30 yrs
- 2 days/yr
Risk factors via First Street. Map © Google.
Why this score? — see what drove the B- grade
The composite is a weighted blend of 9 inputs, each scored 0–100. Each bar is that input's sub-score; the figure is the points it added to the 100-point composite (weight × sub-score).
- Cash flow +30.0/30.0
- 1% rule +10.0/10.0
- DSCR +10.0/10.0
- ARV discount +7.5/15.0
- Schools +3.5/10.0
- Livability +3.4/5.0
- Rent growth +2.5/5.0
- Condition / age +2.5/5.0
- Appreciation +0.0/10.0
$799,000
🖨 Deal sheet 📄 Offer letter ✓ Due diligence
Multi-family units
County records classify this as Multi-Family (5+ Unit). Listing-text estimate: 11 units. confirmed
5+ unit building — per-unit beds/baths from public records are typically unavailable; the breakdown below (if shown) is an estimate from the listing text.
Listing remarks
Exceptional 11-Unit Income Opportunity with Strong Rental Appeal! Don’t miss this unique mixed-unit multifamily property offering a versatile unit mix designed to attract a wide range of tenants and help minimize vacancies. With all 11 units currently occupied and long-term leases in place, this property provides immediate and stable income for the savvy investor. Ideally located with convenient access to schools, shopping, medical facilities, and major travel routes including Hwy 27 and SR 60, tenants enjoy easy north/south/east/west commuting—making this a highly desirable rental location. Recent improvements include a new roof and new septic drainfield, offering added peac
Key facts
- Versatile unit mix
- New roof
- Strong rental appeal
Tags
Neighborhood map
What this means for you Summary
Snapshot
- This is a 11 × 6-bed/12.0-bath units multifamily listed at $799k.
Deal economics
- At list price, monthly cash flow is $7k ($78k/yr) — positive. Per door: $592/mo.
- The deal already cash-flows at list — no discount required.
- Meets the 1% rule at list price ($15k rent vs $799k).
- Recommended offer: $775k (3.0% below list) — sets the bar for market timing.
Location & tenants
- Location reads 68/100 on livability (#535 in FL) — a middle-class / working-renter tenant base. Strengths: cost of living A+, housing A+; Watch: employment D+, schools D, amenities F.
- Polk (suburban): math 39% / reading 43% proficiency, ranked #62 of 73 in FL (top 85%) — families likely to look elsewhere, expect single-tenant / working-renter base with shorter leases.
- Market conditions: 182 active listings in the ZIP; 10,384 units permitted in Polk County in 2024 (1,716 in 5+ unit buildings).
Forward outlook
- Local home prices are declining (-3.0%/yr); year-one equity from $6k of loan paydown is wiped out by about $24k of value loss. Plan a longer hold.
- Polk County population projected at +33% by 2050 — long-run rental-demand tailwind backs the buy-and-hold thesis.
- At projected returns (-3.0% appreciation + 3.0% rent growth), your $224k cash investment doubles in ~4 years — after that, you're playing with house money.
Negotiation context
- It's been on market 34 days — a 3% lower offer ($775k) is reasonable based on typical stale-listing flexibility.
- 20 sale attempts since 18y ago; this cycle's ask is 110107% above the opening price — seller raised mid-cycle; expect resistance to lowballs.
- Current owner paid $515k; list at $799k implies a 55% gain — meaningful room to come down on a strong offer.
Risks & watch-outs
- Watch-outs: built in 1926 — expect roof / HVAC / electrical / plumbing capex.
- Climate carrying-cost: severe wind risk, 99% chance of damaging wind over 30y; moderate wildfire risk; extreme-heat days projected 7→23/yr by 2055 (HVAC capex compounding) — expect insurance premiums to compound above CPI over the hold.
Questions for the listing agent
- It's been on market 34 days. Have you received any prior offers? Is the seller open to a 3% concession, seller financing, or rate buy-down credit?
- Can we see the unit-by-unit rent roll, current vacancy, and any below-market leases? What's the average tenancy length?
- What capital expenditures (roof, boiler, parking lot, exteriors) have been made in the last 5 years, and what's planned in the next 2?
- Built in 1926 — when were the roof, HVAC, electrical panel, plumbing, and water heater last replaced?
- Is there a deadline driving the sale (1031 exchange, divorce, estate, relocation)? That informs how much negotiation room exists.
- Schools are D-rated, which usually means shorter tenancies and higher turnover. Who's the typical renter profile here, and what's been the actual vacancy rate?
- What's the average days-on-market for RENTAL listings here right now (not sales)? A rising rental-DOM trend means longer vacancies and softer asking-rent achievability than the comps imply.
- What's the recent tenant-quality profile in this submarket — average credit score on applications, eviction rate, late-payment / NSF rate, and stable-employment percentage? A property-management company in the area should have these aggregated.
- How much new apartment / multifamily construction is in the pipeline within 1–3 miles? Heavy new supply (>2% of stock underway) typically softens rents 12–24 months out; light construction supports rent growth.
Investment metrics
- 1% rule
- 1.88% ✓
- Cap rate
- 16.08%
- Cash-on-cash
- 34.95%
- DSCR
- 2.56
- GRM
- 4.4
CMA / ARV
No comps found within radius.
Projected returns pro-forma
-3.0% appreciation · 3.0% rent growth · sell at horizon
- IRR
- 30.5%
- Equity multiple
- 2.28×
- Total profit
- $285,678
- Equity at exit
- $119,133
- IRR
- 37.7%
- Equity multiple
- 4.50×
- Total profit
- $783,672
- Equity at exit
- $69,083
Cash invested: $223,720 (down + closing). Projections, not guarantees.
Landlord ↔ Tenant lean methodology
- Overall (STATE)
- 87 Strongly Landlord-Friendly
- State Florida
- 87 Strongly Landlord-Friendly · R+3
- County
- — inherits STATE
- City
- — inherits STATE
ZIP-level market 33853
- Home prices YoY
- -9.2%
- Active inventory
- 182
- Price-to-rent
- 48.8×
Monthly cashflow live
- Estimated rent
- $15,021 medium interval (Pro) →
- Mortgage (P&I)
- −$4,190
- Tax from tax record
- −$827 /mo · $9,928/yr
- Insurance
- −$333
- HOA
- −$0
- Vacancy / Maint / Mgmt
- −$3,154
- Net cashflow
- $6,516
Break-even live
11-unit breakdown (identical units grouped — click to expand)
| Units | Beds | Baths | Est. rent |
|---|---|---|---|
| 11× units | 6 | 12 | $15,026 |
| #1 | 6 | 12 | $1,366 |
| #2 | 6 | 12 | $1,366 |
| #3 | 6 | 12 | $1,366 |
| #4 | 6 | 12 | $1,366 |
| #5 | 6 | 12 | $1,366 |
| #6 | 6 | 12 | $1,366 |
| #7 | 6 | 12 | $1,366 |
| #8 | 6 | 12 | $1,366 |
| #9 | 6 | 12 | $1,366 |
| #10 | 6 | 12 | $1,366 |
| #11 | 6 | 12 | $1,366 |
| Total (11 units) | $15,021 | ||
UW: 25.0% down · 7.5% · 30yr · 1.5% tax · 5.0% vac · 8.0% maint · 8.0% mgmt
Financing live
Cash to close
- Down payment
- $199,750
- Closing costs
- $23,970
- Reserves months
- —
- Total cash needed
- —
Loan-product check · same deal, 3 products live
Conventional
25% down · 7.5% · 30yr
- Down + closing
- —
- Monthly P&I
- —
- Monthly cashflow
- —
- DSCR
- —
- Eligible?
- —
Personal DTI + credit; lowest rate.
DSCR
20% down · 8.5% · 30yr
- Down + closing
- —
- Monthly P&I
- —
- Monthly cashflow
- —
- DSCR
- —
- Eligible?
- —
No personal income docs; deal must DSCR.
Hard money
10% down · 12.0% · 12mo
- Down + closing
- —
- Monthly P&I
- —
- Monthly cashflow
- —
- DSCR
- —
- Eligible?
- —
Short-term bridge; refi at stabilization.
Listing history 50 events
-
2026-06-18days on market $799,000 Active 34 DOM
-
2026-06-17days on market $799,000 Active 33 DOM
-
2026-06-16days on market $799,000 Active 32 DOM
-
2026-06-15days on market $799,000 Active 31 DOM
-
2026-06-13statusdays on market $799,000 Active 29 DOM
-
2026-04-17status Pending
-
2026-04-15$725
-
2026-03-20$799,000 Active
-
2026-03-17historical $900
-
2026-03-09historical $900
-
2026-02-06$900
-
2026-02-06historical $700
-
2026-01-20price $700
-
2026-01-20price $875
-
2025-12-02$925
-
2025-11-27price $750
-
2025-07-31$775
-
2025-07-25historical $775
-
2025-07-14$775
-
2025-07-14historical $775
-
2025-06-27$775
-
2025-06-26historical $775
-
2025-06-26$775
-
2025-03-21historical $850
-
2025-02-06$850
-
2025-01-15historical $850
-
2025-01-09$850
-
2025-01-06historical $850
-
2025-01-06$850
-
2024-12-18historical $850
-
2024-11-07$850
-
2024-10-23historical $850
-
2024-09-30$850
-
2024-09-23historical $1,000
-
2024-09-23$1,000
-
2024-08-31historical $850
-
2024-06-14$850
-
2024-04-02historical $875
-
2024-03-10price $875
-
2024-02-27price $900
-
2024-01-17$950
-
2019-05-01soldstatus $515,000
-
2018-04-06historical
-
2018-04-02status Active
-
2018-03-24status Pending
-
2018-03-22status Pending
-
2018-03-21status Pending
-
2018-02-20$649,000 Active
-
2008-10-30$379,000
-
2008-06-30$399,000
ⓘ Source: listings_history table (triggers on properties + properties_extension) + one-shot
backfill from property_details.listing_events for pre-trigger history.
Tax reassessment forecast FL · Resets to sale price
- Current annual tax
- $9,928 · $827/mo
- Projected year-2 tax
- $9,928 · $827/mo
- Expected delta
- $0/yr ($0/mo · 0.0%)
ⓘ Screening estimate from a state-policy table — verify with the county assessor before closing.
Climate risk First Street
- Flood 1/10 Low FEMA zone X (unshaded) · 0% chance over 30 yrs
- Wildfire 5/10 Major
- Heat 8/10 Severe 7 d/yr ≥108°F today · 23 d/yr by 30 yrs out
- Wind 9/10 Extreme 99% chance of damaging wind over 30 yrs
- Air quality 2/10 Low 0 unhealthy d/yr today · 2 by 30 yrs out
Nearby sold comps map
Loading sold comps map…
Walkable amenities ~0.75 mi
Loading nearby amenities…
Taxation est. · year 1
- Rental income
- $180,252
- − Mortgage interest
- −$44,756
- − Property taxes
- −$9,928
- − Insurance
- −$3,995
- − Repairs & maintenance
- −$14,420
- − Management
- −$14,420
- − Depreciation
- −$23,244
- Taxable income
- $69,489
- Est. tax owed @ 24.0%
- −$16,677
- After-tax cash flow
- $61,519/yr
For passive investors: Depreciation is non-cash, so a rental often shows a tax loss while cash-flowing — sheltering income. Rental losses are passive: they offset passive income freely, and up to $25,000/yr can offset ordinary (W-2) income if you actively participate and your MAGI is under $100k (phasing out to $0 by $150k); unused losses carry forward. On sale, claimed depreciation is recaptured at up to 25%, and gains may owe capital-gains tax (a 1031 exchange can defer both). Figures are a year-1 estimate at your 24.0% rate — not tax advice; consult a CPA.
Schools (NCES district)
- District
- Polk
- NCES district ID
- 1201590
- Math proficiency
- 39% ▼ -11.00%
- Reading proficiency
- 43% ▼ -4.00%
- Median HH income
- $43,979
- Composite
- 34.74/100
- National rank
- #5132
- State rank
- #62 of 73 in FL
Livability — Lake Wales
- Score
- 68/100
- State rank
- #535
- US rank
- #10036
Category grades
Schools grade is shown separately in the Schools card above.
Census & demographics
- City population
- 30,351
- Population (ZIP)
- 12,385
Population outlook (Polk County) Hauer SSP2
- Today (2025)
- 752,975 people
- By 2030
- 804,621 · +6.9%
- By 2040
- 906,117 · +20.3%
- By 2050
- 1,000,476 · +32.9%
- By 2075
- 1,197,520 · +59.0%
- By 2100
- 1,271,518 · +68.9%
Race, ethnicity, and origin ACS 2023
- Neighborhood character
- Diverse neighborhood (Simpson 0.65)
- Race & ethnicity
- White 42% Hispanic / Latino 36% Black 19% Two or more races 16%
- Hispanic origin (detail)
- Mexican 10% Puerto Rican 18% Cuban 2% Dominican 1%
- Common ancestry
- Romanian 2% Slovak 1% Lithuanian 1%
- Foreign-born
- 10% · Canada
- Languages at home
- 72% English-only · Spanish 27%
Political lean MEDSL · Polk
- 2024 margin
- Strong R (+20.7) · D 39.2% · R 59.9%
- 2008→2024 swing
- -14.6pp toward R · 2008: -6.1pp · 2024: -20.7pp
- All cycles
- 2024: R+20.7 2020: R+14.4 2016: R+14.1 2012: R+6.8 2008: R+6.1
Not yet ingested
- Civics
- —
Market trends
- HPI YoY
- ▼ -33.98%
- Current HPI
- 333.8292
- Rent YoY
- —
- Metro
- —
- State GDP YoY
- ▲ 3.28%
- F500 in state
- 36
Industry mix (Fortune 500 HQ in FL)
| Industry | F500 HQs | Revenue |
|---|---|---|
| Industrial Technology | 2 | $29B |
|
||
| Insurance | 2 | $17B |
|
||
| Retail | 1 | $60B |
|
||
| Technology Distribution | 1 | $58B |
|
||
| Homebuilding | 1 | $35B |
|
||
| Technology Manufacturing | 1 | $35B |
|
||
Price history
+768.5% since first listed48 events — show timeline
- 2026-04-17 Pending — Stellar MLS as Distributed by MLS Grid
- 2026-04-15 Listed for Rent $725 RENTALBEAST
- 2026-03-20 Listed $799,000 Stellar MLS as Distributed by MLS Grid
- 2026-03-17 Rental Removed $900 RENTALBEAST
- 2026-03-09 Rental Removed $900 RENTALBEAST
- 2026-02-06 Listed for Rent $900 RENTALBEAST
- 2026-02-06 Rental Removed $700 RENTALBEAST
- 2026-01-20 Price Changed $700 RENTALBEAST
- 2026-01-20 Price Changed $875 RENTALBEAST
- 2025-12-02 Listed for Rent $925 RENTALBEAST
- 2025-11-27 Price Changed $750 RENTALBEAST
- 2025-07-31 Listed for Rent $775 RENTALBEAST
- 2025-07-25 Rental Removed $775 RENTALBEAST
- 2025-07-14 Listed for Rent $775 RENTALBEAST
- 2025-07-14 Rental Removed $775 LEASESTAR
- 2025-06-27 Listed for Rent $775 LEASESTAR
- 2025-06-26 Rental Removed $775 LEASESTAR
- 2025-06-26 Listed for Rent $775 LEASESTAR
- 2025-03-21 Rental Removed $850 LEASESTAR
- 2025-02-06 Listed for Rent $850 LEASESTAR
- 2025-01-15 Rental Removed $850 RENTALBEAST
- 2025-01-09 Listed for Rent $850 RENTALBEAST
- 2025-01-06 Rental Removed $850 LEASESTAR
- 2025-01-06 Listed for Rent $850 LEASESTAR
- 2024-12-18 Rental Removed $850 LEASESTAR
- 2024-11-07 Listed for Rent $850 LEASESTAR
- 2024-10-23 Rental Removed $850 LEASESTAR
- 2024-09-30 Listed for Rent $850 LEASESTAR
- 2024-09-23 Rental Removed $1,000 RENTALBEAST
- 2024-09-23 Listed for Rent $1,000 RENTALBEAST
- 2024-08-31 Rental Removed $850 LEASESTAR
- 2024-06-14 Listed for Rent $850 LEASESTAR
- 2024-04-02 Rental Removed $875 LEASESTAR
- 2024-03-10 Price Changed $875 LEASESTAR
- 2024-02-27 Price Changed $900 LEASESTAR
- 2024-01-17 Listed for Rent $950 LEASESTAR
- 2019-05-01 Sold (Public Records) $515,000 Public Records
- 2018-04-06 Listing Removed — Stellar MLS as Distributed by MLS Grid
- 2018-04-02 Relisted — Stellar MLS as Distributed by MLS Grid
- 2018-03-24 Pending — Stellar MLS as Distributed by MLS Grid
- 2018-03-22 Pending — Stellar MLS as Distributed by MLS Grid
- 2018-03-21 Pending — Stellar MLS as Distributed by MLS Grid
- 2018-02-20 Listed $649,000 Stellar MLS as Distributed by MLS Grid
- 2008-10-30 Listed $379,000 Stellar MLS as Distributed by MLS Grid
- 2008-06-30 Listed $399,000 Stellar MLS as Distributed by MLS Grid
- 2001-01-02 Sold (Public Records) $150,000 Public Records
- 2001-01-02 Sold (Public Records) $150,000 Public Records
- 1997-03-05 Sold (Public Records) $92,000 Public Records
Property tax history
+15.2%/yrLatest (2025): $9,928 · -0.4% YoY. Source: county tax records.
Cash-flow waterfall
monthlySold comps — $/sqft
last 12 mo · ≤1 miLoading sold comps…