 Duplex
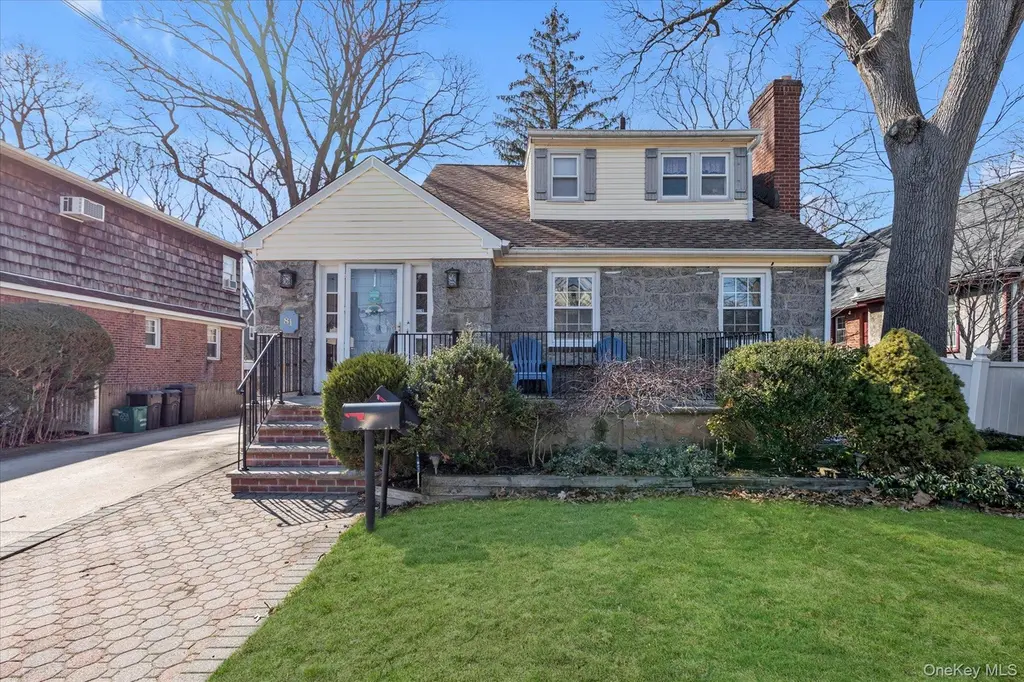
81 Stuart St · Lynbrook, NY
Flood risk 1/10 · Minimal
- FEMA flood zone
- X (unshaded)
- Chance of flooding over 30 yrs
- 0.0%
- Est. flood insurance / yr
- $473 – $860
Fire risk 1/10 · Minimal
- Est. fire insurance / yr
- $691 – $1,283
Heat risk 6/10 · Moderate
- Hot days now (above 97°F)
- 7 days/yr
- Hot days in 30 yrs
- 16 days/yr
Wind risk 6/10 · Moderate
- Chance of severe wind over 30 yrs
- 70.0%
Air-quality risk 3/10 · Minor
- Unhealthy air days now
- 4 days/yr
- Unhealthy air days in 30 yrs
- 4 days/yr
Risk factors via First Street. Map © Google.
Why this score? — see what drove the C- grade
The composite is a weighted blend of 9 inputs, each scored 0–100. Each bar is that input's sub-score; the figure is the points it added to the 100-point composite (weight × sub-score).
- Cash flow +17.6/30.0
- ARV discount +7.5/15.0
- Schools +6.7/10.0
- DSCR +5.5/10.0
- 1% rule +4.6/10.0
- Livability +4.4/5.0
- Rent growth +2.5/5.0
- Condition / age +2.5/5.0
- Appreciation +0.0/10.0
$775,000
🖨 Deal sheet 📄 Offer letter ✓ Due diligence
Multi-family units
County records classify this as Multi-Family (2-4 Unit). Listing-text estimate: 2 units. confirmed
Listing remarks MLS
Well Maintained Home, 2 Family, Lovely Yard.
Key facts
- Large deck
- Private driveway
- Legal 2-family cape
Tags
Neighborhood map
What this means for you Summary
Snapshot
- This is a 2 × 3-bed/1.5-bath units multifamily listed at $775k.
Deal economics
- At list price, monthly cash flow is $614 ($7k/yr) — positive. Per door: $307/mo.
- The deal already cash-flows at list — no discount required.
- To meet the 1% rule (rent ≥ 1% of price), the offer needs to be $743k (4.1% below list).
- Recommended offer: $743k (4.1% below list) — sets the bar for 1% rule.
- Cap rate 7.2% vs local median 3.2% in Lynbrook — top-decile yield for the area; either an underpriced asset or a hidden risk that comps aren't pricing in. Stress-test before assuming the spread holds.
Location & tenants
- Location reads 88/100 on livability (#10 in NY, #221 nationally) — a professional / high-income tenant draw. Strengths: crime A+, amenities A+, commute A+; Watch: cost of living F.
- Lynbrook Union Free School District (suburban): math 75% / reading 73% proficiency, ranked #72 of 590 in NY (top 12%) — strong family-tenant draw, lease renewals of 3-5y typical; only 8% free/reduced lunch — higher-income household profile.
- Zoned schools: West End School (math 82% / reading 82%, grade A+, #138 of 2,108 statewide, top 8%, 401 students, 0% FRL); Lynbrook North Middle School (math 42% / reading 67%, grade B-, #214 of 729 statewide, top 31%, 266 students, 15% FRL); Lynbrook Senior High School (math 97% / reading 82%, grade A+, #265 of 1,100 statewide, top 26%, 850 students, 19% FRL) — zoned schools at 11% FRL track the district average.
- Market conditions: 133 active listings in the ZIP; high-income renter base; 824 units permitted in Nassau County in 2024 (153 in 5+ unit buildings).
- At $7,431/mo this rent would consume 65% of the median local household income ($137k/yr) (locally 618% of renters already pay >50% of income on rent) — very limited rent-growth headroom before tenants either downsize or default.
Forward outlook
- Local home prices are declining (-3.0%/yr); year-one equity from $5k of loan paydown is wiped out by about $23k of value loss. Plan a longer hold.
- Nassau County population projected at +7% by 2050 — modest demand growth; plan on rents tracking national, not racing it.
Negotiation context
- Only 7 days on market — expect competitive offers; lowballing is unlikely to land.
- 4 sale attempts since 11y ago with the ask held roughly flat each time — persistent listings suggest the price (not the market) is what's stuck; bring a comps-based counter.
- Current owner paid $462k; list at $775k implies a 68% gain — meaningful room to come down on a strong offer.
Risks & watch-outs
- Watch-outs: built in 1937 — expect roof / HVAC / electrical / plumbing capex.
- Climate carrying-cost: major wind risk, 70% chance of damaging wind over 30y; extreme-heat days projected 7→16/yr by 2055 (HVAC capex compounding) — expect insurance premiums to compound above CPI over the hold.
Questions for the listing agent
- Can we see the unit-by-unit rent roll, current vacancy, and any below-market leases? What's the average tenancy length?
- What capital expenditures (roof, boiler, parking lot, exteriors) have been made in the last 5 years, and what's planned in the next 2?
- Built in 1937 — when were the roof, HVAC, electrical panel, plumbing, and water heater last replaced?
- Is there a deadline driving the sale (1031 exchange, divorce, estate, relocation)? That informs how much negotiation room exists.
- Schools are A-rated — typically a magnet for longer-tenancy family renters. What's the average tenant stay here, and is there a school-zone premium baked into asking?
- What's the average days-on-market for RENTAL listings here right now (not sales)? A rising rental-DOM trend means longer vacancies and softer asking-rent achievability than the comps imply.
- What's the recent tenant-quality profile in this submarket — average credit score on applications, eviction rate, late-payment / NSF rate, and stable-employment percentage? A property-management company in the area should have these aggregated.
- How much new apartment / multifamily construction is in the pipeline within 1–3 miles? Heavy new supply (>2% of stock underway) typically softens rents 12–24 months out; light construction supports rent growth.
Investment metrics
- 1% rule
- 0.96% ✗
- Cap rate
- 7.24%
- Cash-on-cash
- 3.40%
- DSCR
- 1.15
- GRM
- 8.7
CMA / ARV
No comps found within radius.
Projected returns pro-forma
-3.0% appreciation · 3.0% rent growth · sell at horizon
- IRR
- -11.0%
- Equity multiple
- 0.60×
- Total profit
- $-86,405
- Equity at exit
- $115,555
- IRR
- -1.7%
- Equity multiple
- 0.89×
- Total profit
- $-24,651
- Equity at exit
- $67,008
Cash invested: $217,000 (down + closing). Projections, not guarantees.
Landlord ↔ Tenant lean methodology
- Overall (STATE)
- 15 Strongly Tenant-Friendly
- State New York
- 15 Strongly Tenant-Friendly · D+10
- County
- — inherits STATE
- City
- — inherits STATE
ZIP-level market 11563
- Active inventory
- 133
- Price-to-rent
- 17.4×
Monthly cashflow live
- Estimated rent
- $7,431 medium interval (Pro) →
- Mortgage (P&I)
- −$4,064
- Tax from tax record
- −$869 /mo · $10,429/yr
- Insurance
- −$323
- HOA
- −$0
- Vacancy / Maint / Mgmt
- −$1,561
- Net cashflow
- $614
Break-even live
2-unit breakdown (identical units grouped — click to expand)
| Units | Beds | Baths | Est. rent |
|---|---|---|---|
| 2× units | 3 | 1.5 | $7,430 |
| #1 | 3 | 1.5 | $3,715 |
| #2 | 3 | 1.5 | $3,715 |
| Total (2 units) | $7,431 | ||
UW: 25.0% down · 7.5% · 30yr · 1.5% tax · 5.0% vac · 8.0% maint · 8.0% mgmt
Financing live
Cash to close
- Down payment
- $193,750
- Closing costs
- $23,250
- Reserves months
- —
- Total cash needed
- —
Loan-product check · same deal, 3 products live
Conventional
25% down · 7.5% · 30yr
- Down + closing
- —
- Monthly P&I
- —
- Monthly cashflow
- —
- DSCR
- —
- Eligible?
- —
Personal DTI + credit; lowest rate.
DSCR
20% down · 8.5% · 30yr
- Down + closing
- —
- Monthly P&I
- —
- Monthly cashflow
- —
- DSCR
- —
- Eligible?
- —
No personal income docs; deal must DSCR.
Hard money
10% down · 12.0% · 12mo
- Down + closing
- —
- Monthly P&I
- —
- Monthly cashflow
- —
- DSCR
- —
- Eligible?
- —
Short-term bridge; refi at stabilization.
Listing history 11 events
-
2026-04-21status Pending
-
2026-03-18$775,000 Active
-
2023-12-22historical $1,700
-
2023-12-01$1,700
-
2015-07-17soldstatus $462,500
-
2015-07-06soldstatus $462,500 Closed 44-char remark
Show marketing remark (96 chars)
Well Maintained Home, 2 Family, Lovely Yard., Additional information: Separate Hotwater Heater:Y
-
2015-07-06soldstatus $462,500 96-char remark
Show marketing remark (96 chars)
Well Maintained Home, 2 Family, Lovely Yard., Additional information: Separate Hotwater Heater:Y
-
2015-05-19status Under Contract 44-char remark
Show marketing remark (44 chars)
Well Maintained Home, 2 Family, Lovely Yard.
-
2015-04-14$469,000 New 44-char remark
Show marketing remark (44 chars)
Well Maintained Home, 2 Family, Lovely Yard.
-
2015-03-31$469,000 96-char remark
Show marketing remark (96 chars)
Well Maintained Home, 2 Family, Lovely Yard., Additional information: Separate Hotwater Heater:Y
-
1986-03-25soldstatus $179,000
ⓘ Source: listings_history table (triggers on properties + properties_extension) + one-shot
backfill from property_details.listing_events for pre-trigger history.
Tax reassessment forecast NY · Partial reset (capped growth)
- Current annual tax
- $10,429 · $869/mo
- Projected year-2 tax
- $11,763 · $980/mo
- Expected delta
- +$1,334/yr (+$111/mo · 12.8%)
ⓘ Screening estimate from a state-policy table — verify with the county assessor before closing.
Climate risk First Street
- Flood 1/10 Low FEMA zone X (unshaded) · 0% chance over 30 yrs
- Wildfire 1/10 Low
- Heat 6/10 Major 7 d/yr ≥97°F today · 16 d/yr by 30 yrs out
- Wind 6/10 Major 70% chance of damaging wind over 30 yrs
- Air quality 3/10 Moderate 4 unhealthy d/yr today · 4 by 30 yrs out
Nearby sold comps map
Loading sold comps map…
Walkable amenities ~0.75 mi
Loading nearby amenities…
Taxation est. · year 1
- Rental income
- $89,172
- − Mortgage interest
- −$43,412
- − Property taxes
- −$10,429
- − Insurance
- −$3,875
- − Repairs & maintenance
- −$7,134
- − Management
- −$7,134
- − Depreciation
- −$22,545
- Taxable loss
- −$5,357
- Est. tax savings @ 24.0%
- +$1,286
- After-tax cash flow
- $8,658/yr
For passive investors: Depreciation is non-cash, so a rental often shows a tax loss while cash-flowing — sheltering income. Rental losses are passive: they offset passive income freely, and up to $25,000/yr can offset ordinary (W-2) income if you actively participate and your MAGI is under $100k (phasing out to $0 by $150k); unused losses carry forward. On sale, claimed depreciation is recaptured at up to 25%, and gains may owe capital-gains tax (a 1031 exchange can defer both). Figures are a year-1 estimate at your 24.0% rate — not tax advice; consult a CPA.
Schools (NCES district)
- District
- Lynbrook Union Free School District
- NCES district ID
- 3617910
- Math proficiency
- 75% ▬ 0.00%
- Reading proficiency
- 73% ▲ 2.00%
- Median HH income
- $93,436
- Composite
- 66.85/100
- National rank
- #404
- State rank
- #72 of 590 in NY
Livability — Lynbrook
- Score
- 88/100
- State rank
- #10
- US rank
- #221
Category grades
Schools grade is shown separately in the Schools card above.
Census & demographics
- Census place
- Lynbrook, NY
- County
- Nassau County · 653,051 people
- City population
- 22,899
- Metro
- New York-Newark-Jersey City, NY-NJ-PA
- Population (ZIP)
- 22,899
- Household income
- $136,887
- Rent vs Own
- Severe rent burden
- 618.0
Population outlook (Nassau County) Hauer SSP2
- Today (2025)
- 1,409,302 people
- By 2030
- 1,431,482 · +1.6%
- By 2040
- 1,471,607 · +4.4%
- By 2050
- 1,502,845 · +6.6%
- By 2075
- 1,575,403 · +11.8%
- By 2100
- 1,554,356 · +10.3%
Race, ethnicity, and origin ACS 2023
- Neighborhood character
- Diverse neighborhood (Simpson 0.56)
- Race & ethnicity
- White 62% Hispanic / Latino 21% Two or more races 10% Asian 7% Black 7%
- Hispanic origin (detail)
- Mexican 1% Puerto Rican 4% Cuban 2% Dominican 3%
- Common ancestry
- Hispanic 2% Romanian 2% Scotch-Irish 2%
- Foreign-born
- 17% · Canada, China, Jamaica
- Languages at home
- 74% English-only · Spanish 13% Other Indo-European 7% French/Haitian/Cajun 2%
Political lean MEDSL · Nassau
- 2024 margin
- Toss-up / Even · D 47.9% · R 52.1%
- 2008→2024 swing
- -12.6pp toward R · 2008: 8.4pp · 2024: -4.2pp
- All cycles
- 2024: R+4.2 2020: D+9.5 2016: D+5.3 2012: D+6.7 2008: D+8.4
Not yet ingested
- Civics
- —
Market trends
- HPI YoY
- ▼ -652.00%
- Current HPI
- 317.1455
- Rent YoY
- —
- Metro
- New York-Newark-Jersey City, NY-NJ-PA
- State GDP YoY
- ▲ 2.60%
- F500 in state
- 92
Industry mix (Fortune 500 HQ in NY)
| Industry | F500 HQs | Revenue |
|---|---|---|
| Financial Services | 10 | $950B |
|
||
| Consumer Goods | 9 | $162B |
|
||
| Insurance | 4 | $225B |
|
||
| Telecommunications | 2 | $144B |
|
||
| Pharmaceuticals | 2 | $112B |
|
||
| Media / Entertainment | 2 | $69B |
|
||
Price history
+333.0% since first listed11 events — show timeline
- 2026-04-21 Pending — OneKey® MLS as Distributed by MLS Grid
- 2026-03-18 Listed $775,000 OneKey® MLS as Distributed by MLS Grid
- 2023-12-22 Rental Removed $1,700 ONEKEY
- 2023-12-01 Listed for Rent $1,700 ONEKEY
- 2015-07-17 Sold (Public Records) $462,500 Public Records
- 2015-07-06 Sold (MLS) $462,500 OneKey® MLS as Distributed by MLS Grid
- 2015-07-06 Sold (MLS) $462,500 MLSLI
- 2015-05-19 Pending — MLSLI
- 2015-04-14 Listed $469,000 MLSLI
- 2015-03-31 Listed $469,000 OneKey® MLS as Distributed by MLS Grid
- 1986-03-25 Sold (Public Records) $179,000 Public Records
Property tax history
+2.4%/yrLatest (2024): $10,429 · -6.6% YoY. Source: county tax records.
Cash-flow waterfall
monthlySold comps — $/sqft
last 12 mo · ≤1 miLoading sold comps…