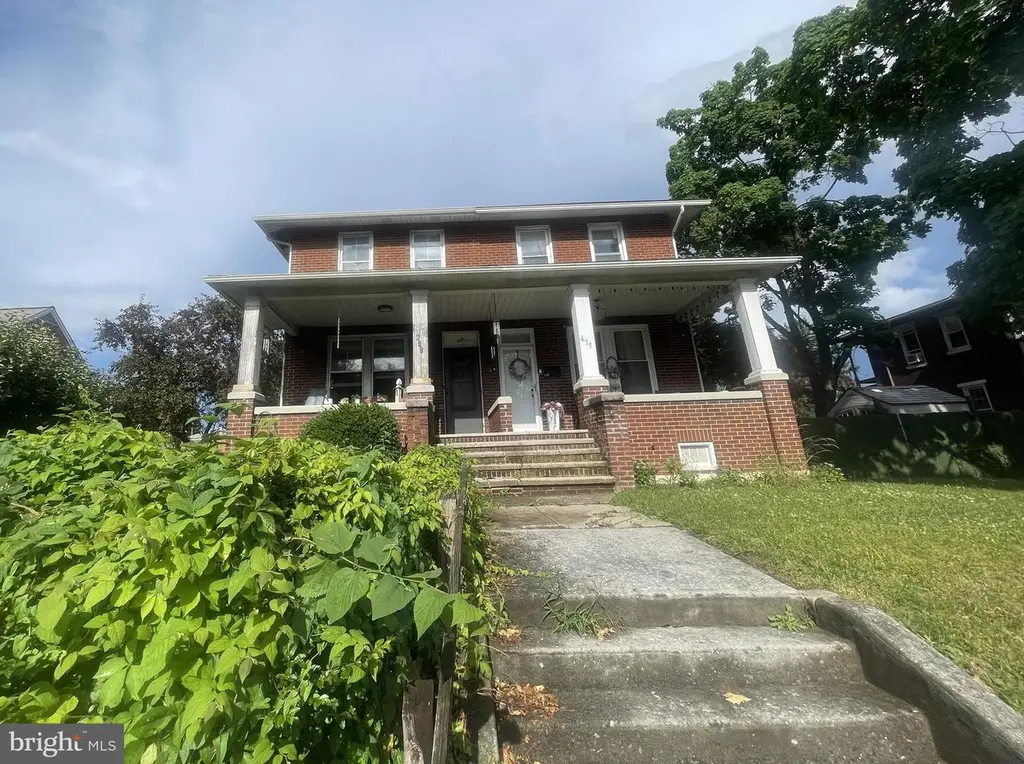
633 S 29th St · Paxtang, PA
Flood risk 1/10 · Minimal
- FEMA flood zone
- X (unshaded)
- Chance of flooding over 30 yrs
- 0.0%
- Est. flood insurance / yr
- $473 – $860
Fire risk 1/10 · Minimal
- Est. fire insurance / yr
- $511 – $949
Heat risk 5/10 · Moderate
- Hot days now (above 100°F)
- 7 days/yr
- Hot days in 30 yrs
- 15 days/yr
Wind risk 3/10 · Minor
- Chance of severe wind over 30 yrs
- 5.0%
Air-quality risk 3/10 · Minor
- Unhealthy air days now
- 2 days/yr
- Unhealthy air days in 30 yrs
- 4 days/yr
Risk factors via First Street. Map © Google.
Why this score? — see what drove the C+ grade
The composite is a weighted blend of 9 inputs, each scored 0–100. Each bar is that input's sub-score; the figure is the points it added to the 100-point composite (weight × sub-score).
- Cash flow +20.1/30.0
- ARV discount +15.0/15.0
- DSCR +6.4/10.0
- 1% rule +5.5/10.0
- Livability +4.1/5.0
- Schools +3.6/10.0
- Rent growth +3.4/5.0
- Condition / age +2.5/5.0
- Appreciation +0.0/10.0
$139,900
🖨 Deal sheet 📄 Offer letter ✓ Due diligence
Listing remarks
This classic all-brick home in Harrisburg offers a solid foundation and a fantastic canvas for your personal style. Key mechanical peace of mind includes a newer electrical panel and a roof replaced within the last decade. The property features a detached 2-car garage and a complete appliance package—including a refrigerator, stove, washer, and dryer. Bring your vision to customize the kitchen, bathrooms, and finishes exactly to your liking. Ideal for anyone looking to build equity in a great neighborhood.
Key facts
- 8,276 sq ft lot
- 2 garage spots
- Built 1915
Property features AI
Finance
- Other: Ownership: Fee simple; Assessor indicates about 1,600 finished above-grade area
Exterior
- Parking: Detached garage with 2 garage spaces (total 2 parking spaces)
- Utilities: Public water; Public sewer; Hot water: other
- Home design: Detached property; Slab foundation
- Construction: Slab foundation
- Exterior features: Not in a federal flood zone; Above-grade and below-grade other structures; Detached structure
Interior
- Bedrooms: 2 bedrooms on the first upper level
- Bathrooms: 2 full bathrooms (both on the first upper level)
- Heating & cooling: Central heating; Electric heating components; Central air conditioning; Electric cooling
- Interior features: No basement; Finished living area based on assessor
Neighborhood map
What this means for you Summary
Snapshot
- This is a 2-bed/2.0-bath single-family listed at $140k.
Deal economics
- At list price, monthly cash flow is $175 ($2k/yr) — positive.
- The deal already cash-flows at list — no discount required.
- Meets the 1% rule at list price ($1k rent vs $140k).
Location & tenants
- Location reads 82/100 on livability (#156 in PA, #1,291 nationally) — a professional / high-income tenant draw. Strengths: crime A+, cost of living A+, housing A+; Watch: amenities F, commute F.
- Central Dauphin SD (suburban): math 30% / reading 52% proficiency, ranked #305 of 539 in PA (top 57%) — families likely to look elsewhere, expect single-tenant / working-renter base with shorter leases.
- Zoned schools: Central Dauphin Shs (math 71% / reading 24%, grade D, #164 of 437 statewide, top 38%, 1,975 students, 33% FRL) — zoned schools at 33% FRL track the district average.
- Market conditions: Rents rising (+3.8%/yr); 178 active listings in the ZIP; 13 comparable units currently listed for rent nearby; rentals at typical pace (median 23d on market — plan ~3-4 weeks tenant-placement turnaround); solid renter incomes; 540 units permitted in Dauphin County in 2024 (194 in 5+ unit buildings).
Forward outlook
- Local home prices are declining (-3.0%/yr); year-one equity from $967 of loan paydown is wiped out by about $4k of value loss. Plan a longer hold.
Negotiation context
- Only 5 days on market — expect competitive offers; lowballing is unlikely to land.
- Current owner paid $60k; list at $140k implies a 134% gain — meaningful room to come down on a strong offer.
Risks & watch-outs
- Watch-outs: built in 1915 — expect roof / HVAC / electrical / plumbing capex.
- Climate carrying-cost: extreme-heat days projected 7→15/yr by 2055 (HVAC capex compounding) — expect insurance premiums to compound above CPI over the hold.
Questions for the listing agent
- Built in 1915 — when were the roof, HVAC, electrical panel, plumbing, and water heater last replaced?
- Is there a deadline driving the sale (1031 exchange, divorce, estate, relocation)? That informs how much negotiation room exists.
- Schools are B-rated — typically a magnet for longer-tenancy family renters. What's the average tenant stay here, and is there a school-zone premium baked into asking?
- What's the average days-on-market for RENTAL listings here right now (not sales)? A rising rental-DOM trend means longer vacancies and softer asking-rent achievability than the comps imply.
- What's the recent tenant-quality profile in this submarket — average credit score on applications, eviction rate, late-payment / NSF rate, and stable-employment percentage? A property-management company in the area should have these aggregated.
- How much new for-sale + rental construction is in the pipeline within 1–3 miles? Heavy new supply typically softens prices + rents 12–24 months out; constrained supply supports both.
Investment metrics
- 1% rule
- 1.05% ✓
- Cap rate
- 7.80%
- Cash-on-cash
- 5.37%
- DSCR
- 1.24
- GRM
- 7.9
CMA / ARV
- ARV (on-the-fly)
- $252,800
- Comps found
- 12
Show comp detail 12 sales within ~0.75 mi
| Address | Dist | Beds/Ba | Sqft | Sold | Price | $/sf | Match |
|---|---|---|---|---|---|---|---|
| 630 S 29th St | 0.02mi | 3/1.5 (+1) | 1,508 (-6%) | 1mo | $250,000 | $166 | 81 |
| 3011 Greenwood St | 0.13mi | 3/1.5 (+1) | 1,569 (-2%) | 10mo | $230,100 | $147 | 75 |
| 474 N 32nd St | 0.14mi | 3/2.0 (+1) | 1,740 (+9%) | 7mo | $275,000 | $158 | 68 |
| 2444 Derry St | 0.26mi | 2/1.0 | 1,416 (-12%) | 2mo | $115,000 | $81 | 63 |
| 3700 Vista Ter | 0.60mi | 2/1.0 | 1,546 (-3%) | 0mo | $275,000 | $178 | 62 |
| 10 Park Ter | 0.27mi | 3/1.5 (+1) | 1,450 (-9%) | 8mo | $250,000 | $172 | 58 |
| 3109 Duke St | 0.16mi | 3/1.5 (+1) | 1,729 (+8%) | 17mo | $170,000 | $98 | 58 |
| 25 N 31st St | 0.19mi | 3/1.5 (+1) | 1,821 (+14%) | 7mo | $240,000 | $132 | 55 |
| 2406 Midland Rd | 0.73mi | 2/1.5 | 1,672 (+4%) | 11mo | $250,000 | $150 | 47 |
| 3727 Montour St | 0.73mi | 2/2.0 | 1,400 (-12%) | 9mo | $238,777 | $171 | 38 |
| 3740 Elder Rd | 0.71mi | 3/1.5 (+1) | 1,428 (-11%) | 9mo | $225,000 | $158 | 34 |
| 611 Central Ter | 0.71mi | 3/1.0 (+1) | 1,489 (-7%) | 18mo | $262,500 | $176 | 31 |
Match score weights: distance 35% · size 25% · config 20% · recency 20%. Top-matched comps best support the ARV.
Projected returns pro-forma
-3.0% appreciation · 3.76% rent growth · sell at horizon
- IRR
- -7.1%
- Equity multiple
- 0.74×
- Total profit
- $-10,345
- Equity at exit
- $20,860
- IRR
- 3.5%
- Equity multiple
- 1.26×
- Total profit
- $10,206
- Equity at exit
- $12,096
Cash invested: $39,172 (down + closing). Projections, not guarantees.
Landlord ↔ Tenant lean methodology
- Overall (STATE)
- 62 Landlord-Friendly
- State Pennsylvania
- 62 Landlord-Friendly · EVEN
- County
- — inherits STATE
- City
- — inherits STATE
ZIP-level market 17111
- Rents YoY
- 3.8%
- Active inventory
- 178
- Price-to-rent
- 7.9×
Monthly cashflow live
- Estimated rent
- $1,467 high interval (Pro) →
- Mortgage (P&I)
- −$734
- Tax from tax record
- −$192 /mo · $2,300/yr
- Insurance
- −$58
- HOA
- −$0
- Vacancy / Maint / Mgmt
- −$308
- Net cashflow
- $175
Break-even live
UW: 25.0% down · 7.5% · 30yr · 1.5% tax · 5.0% vac · 8.0% maint · 8.0% mgmt
Financing live
Cash to close
- Down payment
- $34,975
- Closing costs
- $4,197
- Reserves months
- —
- Total cash needed
- —
Loan-product check · same deal, 3 products live
Conventional
25% down · 7.5% · 30yr
- Down + closing
- —
- Monthly P&I
- —
- Monthly cashflow
- —
- DSCR
- —
- Eligible?
- —
Personal DTI + credit; lowest rate.
DSCR
20% down · 8.5% · 30yr
- Down + closing
- —
- Monthly P&I
- —
- Monthly cashflow
- —
- DSCR
- —
- Eligible?
- —
No personal income docs; deal must DSCR.
Hard money
10% down · 12.0% · 12mo
- Down + closing
- —
- Monthly P&I
- —
- Monthly cashflow
- —
- DSCR
- —
- Eligible?
- —
Short-term bridge; refi at stabilization.
Rent comps 13 comps
| Address | Beds | Baths | Sqft | Rent | $/sqft | DOM | Units | Dist |
|---|---|---|---|---|---|---|---|---|
| 649 S 23rd St Harrisburg, PA | 3.0 | 1.0 | 1450 | $1,465 | $1.01 | 21d | 1 | 0.42mi |
| 649 S 23rd St Unit 1 Harrisburg, PA | 3.0 | 1.0 | 1450 | $1,465 | $1.01 | 43d | 1 | 0.42mi |
| 2121 Kensington St Harrisburg, PA | 3.0 | 1.0 | 1088 | $1,450 | $1.33 | 43d | 1 | 0.70mi |
| 2016 Swatara St Harrisburg, PA | 3.0 | 1.0 | 1380 | $1,175 | $0.85 | 43d | 1 | 0.85mi |
| 1728 Paxton St Harrisburg, PA | 3.0 | 1.5 | 1320 | $1,295 | $0.98 | 13d | 1 | 1.05mi |
| 1615 Naudain St Harrisburg, PA | 3.0 | 1.0 | 1148 | $1,400 | $1.22 | 43d | 1 | 1.18mi |
| 217 N 40th St Unit 202 1 Harrisburg, PA | 2.0 | 1.0 | 1200 | $1,299 | $1.08 | 43d | 1 | 1.28mi |
| 1429 Naudain St Harrisburg, PA | 3.0 | 1.0 | 1254 | $1,400 | $1.12 | 23d | 1 | 1.32mi |
| 337 S 15th St Harrisburg, PA | 3.0 | 1.0 | 1440 | $1,195 | $0.83 | 21d | 1 | 1.32mi |
| 465 Sunday Dr Harrisburg, PA | 3.0 | 2.5 | 1540 | $1,895 | $1.23 | 13d | 1 | 1.34mi |
| 52 N 18th St Harrisburg, PA | 3.0 | 1.0 | 1100 | $1,250 | $1.14 | 13d | 1 | 1.37mi |
| 349 S 14th St Harrisburg, PA | 3.0 | 1.0 | 1544 | $1,450 | $0.94 | 23d | 1 | 1.39mi |
| 325 Lincoln St Steelton, PA | 3.0 | 1.0 | 1186 | $1,250 | $1.05 | 13d | 1 | 1.49mi |
Listing history 6 events
-
2026-06-18days on market $139,900 Active 5 DOM
-
2026-06-17days on market $139,900 Active 4 DOM
-
2026-06-16days on market $139,900 Active 3 DOM
-
2026-06-15days on market $139,900 Active 2 DOM
-
2026-06-14remarks 511-char remark
-
2026-06-14$139,900 Active 1 DOM
ⓘ Source: listings_history table (triggers on properties + properties_extension) + one-shot
backfill from property_details.listing_events for pre-trigger history.
Tax reassessment forecast PA · Partial reset (capped growth)
- Current annual tax
- $2,300 · $192/mo
- Projected year-2 tax
- $2,300 · $192/mo
- Expected delta
- $0/yr ($0/mo · 0.0%)
ⓘ Screening estimate from a state-policy table — verify with the county assessor before closing.
Climate risk First Street
- Flood 1/10 Low FEMA zone X (unshaded) · 0% chance over 30 yrs
- Wildfire 1/10 Low
- Heat 5/10 Major 7 d/yr ≥100°F today · 15 d/yr by 30 yrs out
- Wind 3/10 Moderate 5% chance of damaging wind over 30 yrs
- Air quality 3/10 Moderate 2 unhealthy d/yr today · 4 by 30 yrs out
Nearby sold comps map
Loading sold comps map…
Walkable amenities ~0.75 mi
Loading nearby amenities…
Taxation est. · year 1
- Rental income
- $17,603
- − Mortgage interest
- −$7,837
- − Property taxes
- −$2,300
- − Insurance
- −$700
- − Repairs & maintenance
- −$1,408
- − Management
- −$1,408
- − Depreciation
- −$4,070
- Taxable loss
- −$119
- Est. tax savings @ 24.0%
- +$29
- After-tax cash flow
- $2,132/yr
For passive investors: Depreciation is non-cash, so a rental often shows a tax loss while cash-flowing — sheltering income. Rental losses are passive: they offset passive income freely, and up to $25,000/yr can offset ordinary (W-2) income if you actively participate and your MAGI is under $100k (phasing out to $0 by $150k); unused losses carry forward. On sale, claimed depreciation is recaptured at up to 25%, and gains may owe capital-gains tax (a 1031 exchange can defer both). Figures are a year-1 estimate at your 24.0% rate — not tax advice; consult a CPA.
Schools (NCES district)
- District
- Central Dauphin SD
- NCES district ID
- 4205400
- Math proficiency
- 30% ▼ -12.00%
- Reading proficiency
- 52% ▼ -7.00%
- Median HH income
- $62,792
- Composite
- 36.46/100
- National rank
- #4664
- State rank
- #305 of 539 in PA
Livability — Paxtang
- Score
- 82/100
- State rank
- #156
- US rank
- #1291
Category grades
Schools grade is shown separately in the Schools card above.
Census & demographics
- Census place
- Paxtang, PA
- County
- Dauphin County · 247,857 people
- Metro
- Harrisburg-Carlisle, PA
- Population (ZIP)
- 36,744
- Household income
- $86,385
- Rent vs Own
- Severe rent burden
- 756.0
Population outlook (Dauphin County) Hauer SSP2
- Today (2025)
- 281,628 people
- By 2030
- 283,549 · +0.7%
- By 2040
- 285,385 · +1.3%
- By 2050
- 286,188 · +1.6%
- By 2075
- 291,053 · +3.3%
- By 2100
- 282,374 · +0.3%
Race, ethnicity, and origin ACS 2023
- Neighborhood character
- Diverse neighborhood (Simpson 0.65)
- Race & ethnicity
- White 53% Black 22% Asian 13% Hispanic / Latino 8% Two or more races 6%
- Hispanic origin (detail)
- Mexican 1% Puerto Rican 4%
- Common ancestry
- Romanian 4% Lithuanian 1% Serbian 1%
- Foreign-born
- 14% · India, Canada, Vietnam
- Languages at home
- 83% English-only · Other Indo-European 7% Spanish 6% Vietnamese 1%
Political lean MEDSL · Dauphin
- 2024 margin
- Lean D (+5.9) · D 52.4% · R 46.5% · Other 1.1%
- 2008→2024 swing
- -3.1pp toward R · 2008: 9.1pp · 2024: 5.9pp
- All cycles
- 2024: D+5.9 2020: D+8.5 2016: D+2.8 2012: D+6.0 2008: D+9.1
Not yet ingested
- Civics
- —
Market trends
- HPI YoY
- ▼ -140.67%
- Current HPI
- 236.6936
- Rent YoY
- ▲ 3.76%
- Metro
- Harrisburg-Carlisle, PA
- State GDP YoY
- ▲ 1.68%
- F500 in state
- 34
Industry mix (Fortune 500 HQ in PA)
| Industry | F500 HQs | Revenue |
|---|---|---|
| Healthcare | 2 | $309B |
|
||
| Insurance | 2 | $27B |
|
||
| Telecommunications / Media | 1 | $124B |
|
||
| Industrial Distribution | 1 | $22B |
|
||
| Financial Services | 1 | $20B |
|
||
| Chemicals / Materials | 1 | $18B |
|
||
Price history
+133.6% since first listed2 events — show timeline
- 2026-06-13 Listed $139,900 BRIGHT MLS
- 1998-11-24 Sold (Public Records) $59,900 Public Records
Property tax history
+1.8%/yrLatest (2026): $2,300 · +4.3% YoY. Source: county tax records.
Cash-flow waterfall
monthlySold comps — $/sqft
last 12 mo · ≤1 miLoading sold comps…