 🏷️ Likely Rental
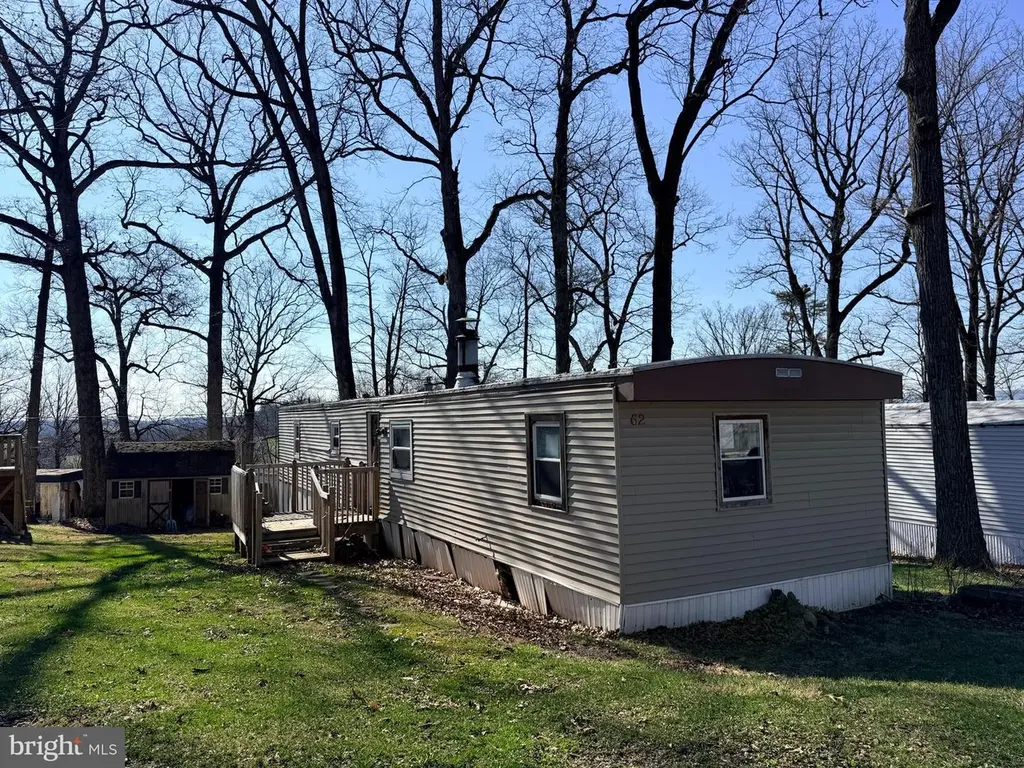
62 Upper Loop Rd · Centre, PA
Flood risk 1/10 · Minimal
- FEMA flood zone
- X (unshaded)
- Chance of flooding over 30 yrs
- 0.0%
- Est. flood insurance / yr
- $507 – $1,088
Fire risk 1/10 · Minimal
- Est. fire insurance / yr
- $511 – $949
Heat risk 4/10 · Minor
- Hot days now (above 98°F)
- 7 days/yr
- Hot days in 30 yrs
- 14 days/yr
Wind risk 4/10 · Minor
- Chance of severe wind over 30 yrs
- 16.0%
Air-quality risk 3/10 · Minor
- Unhealthy air days now
- 2 days/yr
- Unhealthy air days in 30 yrs
- 3 days/yr
Risk factors via First Street. Map © Google.
Why this score? — see what drove the D grade
The composite is a weighted blend of 9 inputs, each scored 0–100. Each bar is that input's sub-score; the figure is the points it added to the 100-point composite (weight × sub-score).
- Cash flow +15.0/30.0
- ARV discount +7.5/15.0
- 1% rule +5.0/10.0
- DSCR +5.0/10.0
- Schools +4.0/10.0
- Rent growth +2.5/5.0
- Livability +2.5/5.0
- Condition / age +2.5/5.0
- Appreciation +0.0/10.0
$8,300
🖨 Deal sheet 📄 Offer letter ✓ Due diligence
Listing remarks
Discover an opportunity with this 2-bedroom, 2-bath manufactured home built in 1978, offering 952 sq. ft. of living space within a peaceful wooded community in Leesport, PA. Nestled on a rented lot, the home features a spacious open-concept common area and a desirable split bedroom layout, with a bedroom and full bath on each side of the home for added privacy and functionality. Surrounded by mature trees and open common areas, the setting offers a serene atmosphere with plenty of potential for the right buyer. This property is in need of repairs and is best suited for an investor, handyman, or buyer looking to renovate and restore the home to its full potential. Home is being sold strictly
Key facts
- 1,307 sq ft lot
- Built 1978
- Listed 13 days
Property features AI
Finance
- Other: Fee simple ownership; Not in a federal flood zone; Above-grade finished area reported as 952 sq ft (assessor)
- HOA & community: Monthly HOA fee of $735
Exterior
- Parking: On-street parking
- Utilities: Electric hot water; Community water; On-site septic
- Home design: Manufactured home; Single wide
- Construction: Frame construction; Above-grade and below-grade structures noted
- Exterior features: Backs to open common area; Backs to trees; Rented lot; Lot dimensions approximately 40 x 25
Interior
- Bedrooms: Two bedrooms on the main level
- Bathrooms: Two full bathrooms (both on the main level)
- Interior features: No basement; Living area reported by assessor
- Laundry & utility: In-unit washer and dryer; Has laundry
Neighborhood map
What this means for you Summary
Snapshot
- This is a 2-bed/2.0-bath manufactured listed at $8k.
Deal economics
- At list price, monthly cash flow is $316 ($4k/yr) — positive.
- The deal already cash-flows at list — no discount required.
- Meets the 1% rule at list price ($1k rent vs $8k).
Location & tenants
- Location reads: area grade D — affects rentability + tenant quality, not the cash-flow math above.
- Schuylkill Valley SD (suburban): math 35% / reading 55% proficiency, ranked #240 of 539 in PA (top 44%) — families likely to look elsewhere, expect single-tenant / working-renter base with shorter leases.
- Market conditions: 38 active listings in the ZIP; 258 units permitted in Berks County in 2024 (27 in 5+ unit buildings).
Forward outlook
- Local home prices are declining (-3.0%/yr); year-one equity from $57 of loan paydown is wiped out by about $249 of value loss. Plan a longer hold.
- Berks County population projected at +3% by 2050 — modest demand growth; plan on rents tracking national, not racing it.
- At projected returns (-3.0% appreciation + 3.0% rent growth), your $2k cash investment doubles in ~1 year — after that, you're playing with house money.
Negotiation context
- Only 13 days on market — expect competitive offers; lowballing is unlikely to land.
Risks & watch-outs
- Watch-outs: property tax is 2.6% of price; HOA is 52% of rent.
Questions for the listing agent
- Built in 1978 — when were the roof, HVAC, electrical panel, plumbing, and water heater last replaced?
- Property tax is high relative to price — has the assessment been appealed recently, and will the sale trigger a re-assessment?
- What does the HOA fee cover, when was the last increase, and are there any pending special assessments or reserve-fund shortfalls?
- Is there a deadline driving the sale (1031 exchange, divorce, estate, relocation)? That informs how much negotiation room exists.
- The area grade is low — what's the realistic commute time and amenity access for the typical tenant pool here? Any planned neighborhood developments (good or bad) we should know about?
- What's the average days-on-market for RENTAL listings here right now (not sales)? A rising rental-DOM trend means longer vacancies and softer asking-rent achievability than the comps imply.
- What's the recent tenant-quality profile in this submarket — average credit score on applications, eviction rate, late-payment / NSF rate, and stable-employment percentage? A property-management company in the area should have these aggregated.
- How much new for-sale + rental construction is in the pipeline within 1–3 miles? Heavy new supply typically softens prices + rents 12–24 months out; constrained supply supports both.
Investment metrics
- 1% rule
- 17.02% ✓
- Cap rate
- 52.01%
- Cash-on-cash
- 163.26%
- DSCR
- 8.26
- GRM
- 0.5
CMA / ARV
- ARV (median comp)
- $249,795
- List price
- $8,300
- Delta
- -96.68%
- Verdict
- UNDERPRICED
- Comps
- 3 within 1.0 mi
Show comp detail 1 sale within ~0.75 mi
| Address | Dist | Beds/Ba | Sqft | Sold | Price | $/sf | Match |
|---|---|---|---|---|---|---|---|
| 52-17 B Upper Loop Rd | 0.01mi | 2/1.0 | 910 (-4%) | 18mo | $43,500 | $48 | 73 |
Match score weights: distance 35% · size 25% · config 20% · recency 20%. Top-matched comps best support the ARV.
Projected returns pro-forma
-3.0% appreciation · 3.0% rent growth · sell at horizon
- IRR
- —
- Equity multiple
- 9.29×
- Total profit
- $19,271
- Equity at exit
- $1,238
- IRR
- —
- Equity multiple
- 20.21×
- Total profit
- $44,653
- Equity at exit
- $718
Cash invested: $2,324 (down + closing). Projections, not guarantees.
Landlord ↔ Tenant lean methodology
- Overall (STATE)
- 62 Landlord-Friendly
- State Pennsylvania
- 62 Landlord-Friendly · EVEN
- County
- — inherits STATE
- City
- — inherits STATE
ZIP-level market 19533
- Home prices YoY
- -15.6%
- Active inventory
- 38
- Price-to-rent
- 0.5×
Monthly cashflow live
- Estimated rent
- $1,413 medium interval (Pro) →
- Mortgage (P&I)
- −$44
- Tax from tax record
- −$18 /mo · $217/yr
- Insurance
- −$3
- HOA
- −$735
- Vacancy / Maint / Mgmt
- −$297
- Net cashflow
- $316
Break-even live
UW: 25.0% down · 7.5% · 30yr · 1.5% tax · 5.0% vac · 8.0% maint · 8.0% mgmt
Financing live
Cash to close
- Down payment
- $2,075
- Closing costs
- $249
- Reserves months
- —
- Total cash needed
- —
Loan-product check · same deal, 3 products live
Conventional
25% down · 7.5% · 30yr
- Down + closing
- —
- Monthly P&I
- —
- Monthly cashflow
- —
- DSCR
- —
- Eligible?
- —
Personal DTI + credit; lowest rate.
DSCR
20% down · 8.5% · 30yr
- Down + closing
- —
- Monthly P&I
- —
- Monthly cashflow
- —
- DSCR
- —
- Eligible?
- —
No personal income docs; deal must DSCR.
Hard money
10% down · 12.0% · 12mo
- Down + closing
- —
- Monthly P&I
- —
- Monthly cashflow
- —
- DSCR
- —
- Eligible?
- —
Short-term bridge; refi at stabilization.
HOA detail
- Monthly dues
- $735 · $8,820/yr
Listing history 1 events
-
2026-05-13$8,300 Active 796-char remark
ⓘ Source: listings_history table (triggers on properties + properties_extension) + one-shot
backfill from property_details.listing_events for pre-trigger history.
Tax reassessment forecast PA · Partial reset (capped growth)
- Current annual tax
- $217 · $18/mo
- Projected year-2 tax
- $217 · $18/mo
- Expected delta
- $0/yr ($0/mo · 0.0%)
ⓘ Screening estimate from a state-policy table — verify with the county assessor before closing.
Climate risk First Street
- Flood 1/10 Low FEMA zone X (unshaded) · 0% chance over 30 yrs
- Wildfire 1/10 Low
- Heat 4/10 Moderate 7 d/yr ≥98°F today · 14 d/yr by 30 yrs out
- Wind 4/10 Moderate 16% chance of damaging wind over 30 yrs
- Air quality 3/10 Moderate 2 unhealthy d/yr today · 3 by 30 yrs out
Nearby sold comps map
Loading sold comps map…
Walkable amenities ~0.75 mi
Loading nearby amenities…
Taxation est. · year 1
- Rental income
- $16,956
- − Mortgage interest
- −$465
- − Property taxes
- −$217
- − Insurance
- −$42
- − Repairs & maintenance
- −$1,356
- − Management
- −$1,356
- − HOA
- −$8,820
- − Depreciation
- −$241
- Taxable income
- $4,458
- Est. tax owed @ 24.0%
- −$1,070
- After-tax cash flow
- $2,724/yr
For passive investors: Depreciation is non-cash, so a rental often shows a tax loss while cash-flowing — sheltering income. Rental losses are passive: they offset passive income freely, and up to $25,000/yr can offset ordinary (W-2) income if you actively participate and your MAGI is under $100k (phasing out to $0 by $150k); unused losses carry forward. On sale, claimed depreciation is recaptured at up to 25%, and gains may owe capital-gains tax (a 1031 exchange can defer both). Figures are a year-1 estimate at your 24.0% rate — not tax advice; consult a CPA.
Schools (NCES district)
- District
- Schuylkill Valley SD
- NCES district ID
- 4220970
- Math proficiency
- 35% ▼ -16.00%
- Reading proficiency
- 55% ▼ -14.00%
- Median HH income
- $66,301
- Composite
- 40.12/100
- National rank
- #3801
- State rank
- #240 of 539 in PA
Livability — Centre
No livability data for this city. (Only ~50 U.S. cities are tracked.)
Census & demographics
- Population (ZIP)
- 8,823
Population outlook (Berks County) Hauer SSP2
- Today (2025)
- 425,767 people
- By 2030
- 428,814 · +0.7%
- By 2040
- 433,463 · +1.8%
- By 2050
- 439,426 · +3.2%
- By 2075
- 478,647 · +12.4%
- By 2100
- 518,507 · +21.8%
Race, ethnicity, and origin ACS 2023
- Neighborhood character
- Predominantly White (87%)
- Race & ethnicity
- White 87% Hispanic / Latino 6% Two or more races 4% Black 2% Native American 1%
- Hispanic origin (detail)
- Puerto Rican 4%
- Common ancestry
- Romanian 6% Iranian 4% Serbian 3%
- Foreign-born
- 2% · Canada, Vietnam
- Languages at home
- 94% English-only · Spanish 3% German/W. Germanic 1%
Political lean MEDSL · Berks
- 2024 margin
- R (+12.2) · D 43.4% · R 55.6%
- 2008→2024 swing
- -21.4pp toward R · 2008: 9.2pp · 2024: -12.2pp
- All cycles
- 2024: R+12.2 2020: R+8.2 2016: R+10.2 2012: R+0.6 2008: D+9.2
Not yet ingested
- Civics
- —
Market trends
- HPI YoY
- ▼ -51.55%
- Current HPI
- 279.0823
- Rent YoY
- —
- Metro
- —
- State GDP YoY
- ▲ 1.68%
- F500 in state
- 34
Industry mix (Fortune 500 HQ in PA)
| Industry | F500 HQs | Revenue |
|---|---|---|
| Healthcare | 2 | $309B |
|
||
| Insurance | 2 | $27B |
|
||
| Telecommunications / Media | 1 | $124B |
|
||
| Industrial Distribution | 1 | $22B |
|
||
| Financial Services | 1 | $20B |
|
||
| Chemicals / Materials | 1 | $18B |
|
||
Price history
2 events — show timeline
- 2026-05-26 Pending — BRIGHT MLS
- 2026-05-13 Listed $8,300 BRIGHT MLS
Property tax history
+1.0%/yrLatest (2026): $217 · +0.1% YoY. Source: county tax records.
Cash-flow waterfall
monthlySold comps — $/sqft
last 12 mo · ≤1 miLoading sold comps…