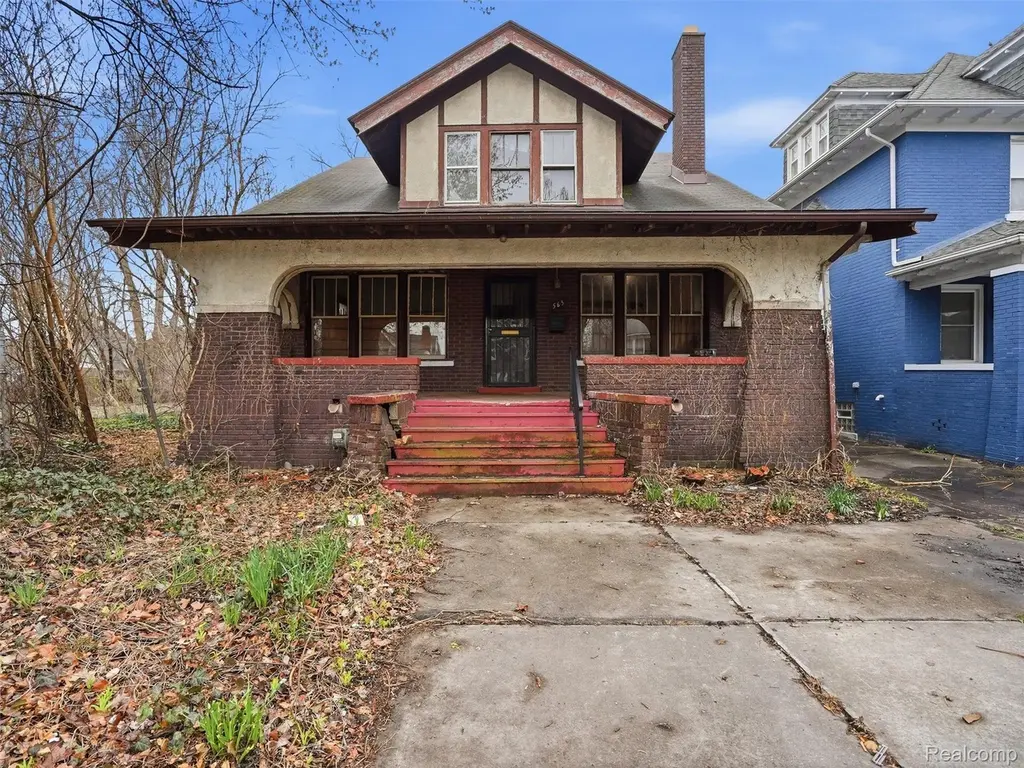
563 Chalmers St · Detroit, MI
Flood risk 6/10 · Moderate
- FEMA flood zone
- AE
- Chance of flooding over 30 yrs
- 0.74%
- Est. flood insurance / yr
- $2,026 – $9,024
Fire risk 1/10 · Minimal
- Est. fire insurance / yr
- $784 – $1,456
Heat risk 3/10 · Minor
- Hot days now (above 96°F)
- 7 days/yr
- Hot days in 30 yrs
- 15 days/yr
Wind risk 2/10 · Minimal
- Chance of severe wind over 30 yrs
- —
Air-quality risk 3/10 · Minor
- Unhealthy air days now
- 3 days/yr
- Unhealthy air days in 30 yrs
- 4 days/yr
Risk factors via First Street. Map © Google.
Why this score? — see what drove the B- grade
The composite is a weighted blend of 9 inputs, each scored 0–100. Each bar is that input's sub-score; the figure is the points it added to the 100-point composite (weight × sub-score).
- Cash flow +30.0/30.0
- 1% rule +10.0/10.0
- DSCR +10.0/10.0
- ARV discount +7.5/15.0
- Livability +3.7/5.0
- Rent growth +2.5/5.0
- Condition / age +2.5/5.0
- Schools +1.3/10.0
- Appreciation +0.0/10.0
$150,000
🖨 Deal sheet 📄 Offer letter ✓ Due diligence
Listing remarks MLS
Investor opportunity in the highly sought-after Jefferson Chalmers neighborhood! This 4-bedroom, 1.5-bath Craftsman-style bungalow offers an exceptional value-add opportunity with a strong existing footprint, solid foundation, and timeless architectural character ready to be brought back to life. Featuring a spacious layout and classic design elements, this property is a prime candidate for a full renovation, allowing investors or end users to unlock significant upside potential. Located in one of Detroit's most vibrant and revitalizing waterfront communities, the home is surrounded by ongoing development, increasing property values, and strong buyer demand. With the right vision and execution, this property can be transformed into a standout residence or high-performing resale. This home is next to two vacant lots that may be able to be purchased from Detroit Land Bank.
Key facts
- Solid foundation
- Full renovation
- Spacious layout
Tags
Neighborhood map
What this means for you Summary
Snapshot
- This is a 4-bed/2.5-bath single-family listed at $150k.
Deal economics
- At list price, monthly cash flow is $496 ($6k/yr) — positive.
- The deal already cash-flows at list — no discount required.
- Meets the 1% rule at list price ($2k rent vs $150k).
- Cap rate 13.9% vs local median 10.2% in Detroit — top-decile yield for the area; either an underpriced asset or a hidden risk that comps aren't pricing in. Stress-test before assuming the spread holds.
Location & tenants
- Location reads 73/100 on livability (#218 in MI) — a middle-class / working-renter tenant base. Strengths: amenities A+, commute A+, cost of living A+; Watch: schools F, crime F, employment F.
- Detroit Public Schools Community District (urban): math 10% / reading 24% proficiency, ranked #499 of 540 in MI (top 92%) — low school quality limits family demand, transient renter base, plan for 1-2y turnover; 90% free/reduced lunch — lower-income household profile, screen leases tightly.
- Market conditions: 137 active listings in the ZIP; 3 comparable units currently listed for rent nearby; rentals leasing fast (median 11d on market — plan ~1-2 weeks tenant-placement turnaround); 2,639 units permitted in Wayne County in 2024 (1,216 in 5+ unit buildings).
Forward outlook
- Local home prices are declining (-3.0%/yr); year-one equity from $1k of loan paydown is wiped out by about $4k of value loss. Plan a longer hold.
- Wayne County population projected at -17% by 2050 — secular population decline; favor cash flow + early exit over multi-decade hold.
- At projected returns (-3.0% appreciation + 3.0% rent growth), your $42k cash investment doubles in ~9 years — after that, you're playing with house money.
Negotiation context
- Only 12 days on market — expect competitive offers; lowballing is unlikely to land.
- 2 sale attempts with the ask held roughly flat each time — persistent listings suggest the price (not the market) is what's stuck; bring a comps-based counter.
Risks & watch-outs
- Watch-outs: flood insurance adds $460/mo; built in 1917 — expect roof / HVAC / electrical / plumbing capex.
- Climate carrying-cost: in FEMA flood zone AE (mandatory federal flood insurance) — expect insurance premiums to compound above CPI over the hold.
Questions for the listing agent
- Built in 1917 — when were the roof, HVAC, electrical panel, plumbing, and water heater last replaced?
- What's the actual annual flood-insurance premium (NFIP or private), and is the property in a SFHA with mandatory coverage?
- Is there a deadline driving the sale (1031 exchange, divorce, estate, relocation)? That informs how much negotiation room exists.
- Schools are F-rated, which usually means shorter tenancies and higher turnover. Who's the typical renter profile here, and what's been the actual vacancy rate?
- Crime grade is F in this area — have there been break-ins, vandalism, or insurance claims at this property in the last 3 years? What carrier currently insures it and at what premium?
- What's the average days-on-market for RENTAL listings here right now (not sales)? A rising rental-DOM trend means longer vacancies and softer asking-rent achievability than the comps imply.
- What's the recent tenant-quality profile in this submarket — average credit score on applications, eviction rate, late-payment / NSF rate, and stable-employment percentage? A property-management company in the area should have these aggregated.
- How much new for-sale + rental construction is in the pipeline within 1–3 miles? Heavy new supply typically softens prices + rents 12–24 months out; constrained supply supports both.
Investment metrics
- 1% rule
- 1.60% ✓
- Cap rate
- 13.95%
- Cash-on-cash
- 27.33%
- DSCR
- 2.22
- GRM
- 5.2
CMA / ARV
- ARV (on-the-fly)
- $422,622
- Comps found
- 12
Show comp detail 12 sales within ~0.75 mi
| Address | Dist | Beds/Ba | Sqft | Sold | Price | $/sf | Match |
|---|---|---|---|---|---|---|---|
| 269 Newport St | 0.45mi | 4/2.5 | 2,652 (-0%) | 7mo | $199,999 | $75 | 73 |
| 885 Lakewood St | 0.33mi | 4/1.5 | 2,750 (+4%) | 12mo | $270,000 | $98 | 65 |
| 880 Pemberton Rd | 0.49mi | 3/2.5 (-1) | 2,650 (-0%) | 11mo | $570,000 | $215 | 63 |
| 709 Middlesex Rd | 0.59mi | 4/2.5 | 2,550 (-4%) | 4mo | $565,000 | $222 | 63 |
| 473 Chalmers St | 0.12mi | 3/2.0 (-1) | 2,298 (-14%) | 14mo | $220,000 | $96 | 54 |
| 807 Barrington Rd | 0.36mi | 3/2.5 (-1) | 2,982 (+12%) | 7mo | $474,000 | $159 | 52 |
| 428 Alter Rd | 0.38mi | 3/2.0 (-1) | 2,431 (-8%) | 13mo | $210,000 | $86 | 50 |
| 614 Pemberton Rd | 0.58mi | 4/4.0 | 2,905 (+9%) | 5mo | $740,000 | $255 | 47 |
| 624 Lakepointe St | 0.63mi | 4/3.0 | 2,879 (+8%) | 9mo | $525,000 | $182 | 47 |
| 644 Pemberton Rd | 0.54mi | 3/2.5 (-1) | 2,900 (+9%) | 11mo | $715,000 | $247 | 45 |
| 475 Algonquin St | 0.66mi | 4/3.0 | 2,412 (-9%) | 9mo | $155,000 | $64 | 44 |
| 221 Ashland St | 0.58mi | 3/1.0 (-1) | 2,400 (-10%) | 13mo | $120,000 | $50 | 35 |
Match score weights: distance 35% · size 25% · config 20% · recency 20%. Top-matched comps best support the ARV.
Projected returns pro-forma
-3.0% appreciation · 3.0% rent growth · sell at horizon
- IRR
- 4.6%
- Equity multiple
- 1.18×
- Total profit
- $7,560
- Equity at exit
- $22,365
- IRR
- 14.2%
- Equity multiple
- 2.15×
- Total profit
- $48,326
- Equity at exit
- $12,969
Cash invested: $42,000 (down + closing). Projections, not guarantees.
Landlord ↔ Tenant lean methodology
- Overall (STATE)
- 62 Landlord-Friendly
- State Michigan
- 62 Landlord-Friendly · EVEN
- County
- — inherits STATE
- City
- — inherits STATE
ZIP-level market 48215
- Home prices YoY
- -24.1%
- Active inventory
- 137
- Price-to-rent
- 5.2×
Monthly cashflow live
- Estimated rent
- $2,393 medium interval (Pro) →
- Mortgage (P&I)
- −$787
- Tax from tax record
- −$85 /mo · $1,019/yr
- Insurance
- −$62
- Flood insurance flood zone
- −$460 /mo · $5,525/yr
- HOA
- −$0
- Vacancy / Maint / Mgmt
- −$503
- Net cashflow
- $496
Break-even live
UW: 25.0% down · 7.5% · 30yr · 1.5% tax · 5.0% vac · 8.0% maint · 8.0% mgmt
Financing live
Cash to close
- Down payment
- $37,500
- Closing costs
- $4,500
- Reserves months
- —
- Total cash needed
- —
Loan-product check · same deal, 3 products live
Conventional
25% down · 7.5% · 30yr
- Down + closing
- —
- Monthly P&I
- —
- Monthly cashflow
- —
- DSCR
- —
- Eligible?
- —
Personal DTI + credit; lowest rate.
DSCR
20% down · 8.5% · 30yr
- Down + closing
- —
- Monthly P&I
- —
- Monthly cashflow
- —
- DSCR
- —
- Eligible?
- —
No personal income docs; deal must DSCR.
Hard money
10% down · 12.0% · 12mo
- Down + closing
- —
- Monthly P&I
- —
- Monthly cashflow
- —
- DSCR
- —
- Eligible?
- —
Short-term bridge; refi at stabilization.
Rent comps 3 comps
| Address | Beds | Baths | Sqft | Rent | $/sqft | DOM | Units | Dist |
|---|---|---|---|---|---|---|---|---|
| 371 Piper Blvd Detroit, MI | 3.0 | 1.5 | 2340 | $2,000 | $0.85 | 43d | 1 | 0.38mi |
| 2174 Springle St Detroit, MI | 3.0 | 1.0 | 2256 | $1,150 | $0.51 | 1d | 1 | 1.01mi |
| 685 Bedford Ln Grosse Pointe Park, MI | 4.0 | 2.5 | 2690 | $4,500 | $1.67 | 10d | 1 | 1.07mi |
Listing history 4 events
-
2026-04-28status Pending 883-char remark
Show marketing remark (883 chars)
Investor opportunity in the highly sought-after Jefferson Chalmers neighborhood! This 4-bedroom, 1.5-bath Craftsman-style bungalow offers an exceptional value-add opportunity with a strong existing footprint, solid foundation, and timeless architectural character ready to be brought back to life. Featuring a spacious layout and classic design elements, this property is a prime candidate for a full renovation, allowing investors or end users to unlock significant upside potential. Located in one of Detroit's most vibrant and revitalizing waterfront communities, the home is surrounded by ongoing development, increasing property values, and strong buyer demand. With the right vision and execution, this property can be transformed into a standout residence or high-performing resale. This home is next to two vacant lots that may be able to be purchased from Detroit Land Bank.
-
2026-04-28status Pending
Show marketing remark (883 chars)
Investor opportunity in the highly sought-after Jefferson Chalmers neighborhood! This 4-bedroom, 1.5-bath Craftsman-style bungalow offers an exceptional value-add opportunity with a strong existing footprint, solid foundation, and timeless architectural character ready to be brought back to life. Featuring a spacious layout and classic design elements, this property is a prime candidate for a full renovation, allowing investors or end users to unlock significant upside potential. Located in one of Detroit's most vibrant and revitalizing waterfront communities, the home is surrounded by ongoing development, increasing property values, and strong buyer demand. With the right vision and execution, this property can be transformed into a standout residence or high-performing resale. This home is next to two vacant lots that may be able to be purchased from Detroit Land Bank.
-
2026-04-16$150,000 Active
Show marketing remark (883 chars)
Investor opportunity in the highly sought-after Jefferson Chalmers neighborhood! This 4-bedroom, 1.5-bath Craftsman-style bungalow offers an exceptional value-add opportunity with a strong existing footprint, solid foundation, and timeless architectural character ready to be brought back to life. Featuring a spacious layout and classic design elements, this property is a prime candidate for a full renovation, allowing investors or end users to unlock significant upside potential. Located in one of Detroit's most vibrant and revitalizing waterfront communities, the home is surrounded by ongoing development, increasing property values, and strong buyer demand. With the right vision and execution, this property can be transformed into a standout residence or high-performing resale. This home is next to two vacant lots that may be able to be purchased from Detroit Land Bank.
-
2026-04-16$150,000 Active 883-char remark
Show marketing remark (883 chars)
Investor opportunity in the highly sought-after Jefferson Chalmers neighborhood! This 4-bedroom, 1.5-bath Craftsman-style bungalow offers an exceptional value-add opportunity with a strong existing footprint, solid foundation, and timeless architectural character ready to be brought back to life. Featuring a spacious layout and classic design elements, this property is a prime candidate for a full renovation, allowing investors or end users to unlock significant upside potential. Located in one of Detroit's most vibrant and revitalizing waterfront communities, the home is surrounded by ongoing development, increasing property values, and strong buyer demand. With the right vision and execution, this property can be transformed into a standout residence or high-performing resale. This home is next to two vacant lots that may be able to be purchased from Detroit Land Bank.
ⓘ Source: listings_history table (triggers on properties + properties_extension) + one-shot
backfill from property_details.listing_events for pre-trigger history.
Tax reassessment forecast MI · Partial reset (capped growth)
- Current annual tax
- $1,019 · $85/mo
- Projected year-2 tax
- $1,665 · $139/mo
- Expected delta
- +$645/yr (+$54/mo · 63.3%)
ⓘ Screening estimate from a state-policy table — verify with the county assessor before closing.
Climate risk First Street
- Flood 6/10 Major FEMA zone AE · 74% chance over 30 yrs
- Wildfire 1/10 Low
- Heat 3/10 Moderate 7 d/yr ≥96°F today · 15 d/yr by 30 yrs out
- Wind 2/10 Low
- Air quality 3/10 Moderate 3 unhealthy d/yr today · 4 by 30 yrs out
Nearby sold comps map
Loading sold comps map…
Walkable amenities ~0.75 mi
Loading nearby amenities…
Taxation est. · year 1
- Rental income
- $28,720
- − Mortgage interest
- −$8,402
- − Property taxes
- −$1,019
- − Insurance
- −$6,275
- − Repairs & maintenance
- −$2,298
- − Management
- −$2,298
- − Depreciation
- −$4,364
- Taxable income
- $4,065
- Est. tax owed @ 24.0%
- −$976
- After-tax cash flow
- $4,980/yr
For passive investors: Depreciation is non-cash, so a rental often shows a tax loss while cash-flowing — sheltering income. Rental losses are passive: they offset passive income freely, and up to $25,000/yr can offset ordinary (W-2) income if you actively participate and your MAGI is under $100k (phasing out to $0 by $150k); unused losses carry forward. On sale, claimed depreciation is recaptured at up to 25%, and gains may owe capital-gains tax (a 1031 exchange can defer both). Figures are a year-1 estimate at your 24.0% rate — not tax advice; consult a CPA.
Schools (NCES district)
- District
- Detroit Public Schools Community District
- NCES district ID
- 2601103
- Math proficiency
- 10% ▼ -2.00%
- Reading proficiency
- 24% ▲ 6.00%
- Median HH income
- $25,815
- Composite
- 13.06/100
- National rank
- #9564
- State rank
- #499 of 540 in MI
Livability — Detroit
- Score
- 73/100
- State rank
- #218
- US rank
- #5427
Category grades
Schools grade is shown separately in the Schools card above.
Census & demographics
- Census place
- Detroit, MI
- City population
- 572,865
- Population (ZIP)
- 10,238
Population outlook (Wayne County) Hauer SSP2
- Today (2025)
- 1,675,273 people
- By 2030
- 1,620,300 · -3.3%
- By 2040
- 1,502,341 · -10.3%
- By 2050
- 1,384,039 · -17.4%
- By 2075
- 1,124,592 · -32.9%
- By 2100
- 881,193 · -47.4%
Race, ethnicity, and origin ACS 2023
- Neighborhood character
- Predominantly Black (87%)
- Race & ethnicity
- Black 87% White 9% Two or more races 2% Hispanic / Latino 2%
- Common ancestry
- Romanian 1% Slovak 1% Lithuanian 1%
- Foreign-born
- 1% · Canada
- Languages at home
- 99% English-only · Spanish 1%
Political lean MEDSL · Wayne
- 2024 margin
- Strong D (+29.0) · D 62.7% · R 33.7% · Other 3.6%
- 2008→2024 swing
- -20.5pp toward R · 2008: 49.5pp · 2024: 29.0pp
- All cycles
- 2024: D+29.0 2020: D+38.1 2016: D+37.3 2012: D+46.9 2008: D+49.5
Not yet ingested
- Civics
- —
Market trends
- HPI YoY
- ▼ -60.84%
- Current HPI
- 191.0405
- Rent YoY
- —
- Metro
- —
- State GDP YoY
- ▲ 1.37%
- F500 in state
- 28
Industry mix (Fortune 500 HQ in MI)
| Industry | F500 HQs | Revenue |
|---|---|---|
| Automotive Parts | 3 | $48B |
|
||
| Automotive | 2 | $372B |
|
||
| Chemicals | 1 | $45B |
|
||
| Automotive Retail | 1 | $29B |
|
||
| Healthcare / Medical Devices | 1 | $23B |
|
||
| Automotive Technology | 1 | $20B |
|
||
Price history
+0.0% since first listed4 events — show timeline
- 2026-04-28 Pending — MiRealSource-MiMLS
- 2026-04-28 Pending — REALCOMP
- 2026-04-16 Listed $150,000 REALCOMP
- 2026-04-16 Listed $150,000 MiRealSource-MiMLS
Property tax history
-0.5%/yrLatest (2025): $1,019 · -1.5% YoY. Source: county tax records.
Cash-flow waterfall
monthlySold comps — $/sqft
last 12 mo · ≤1 miLoading sold comps…