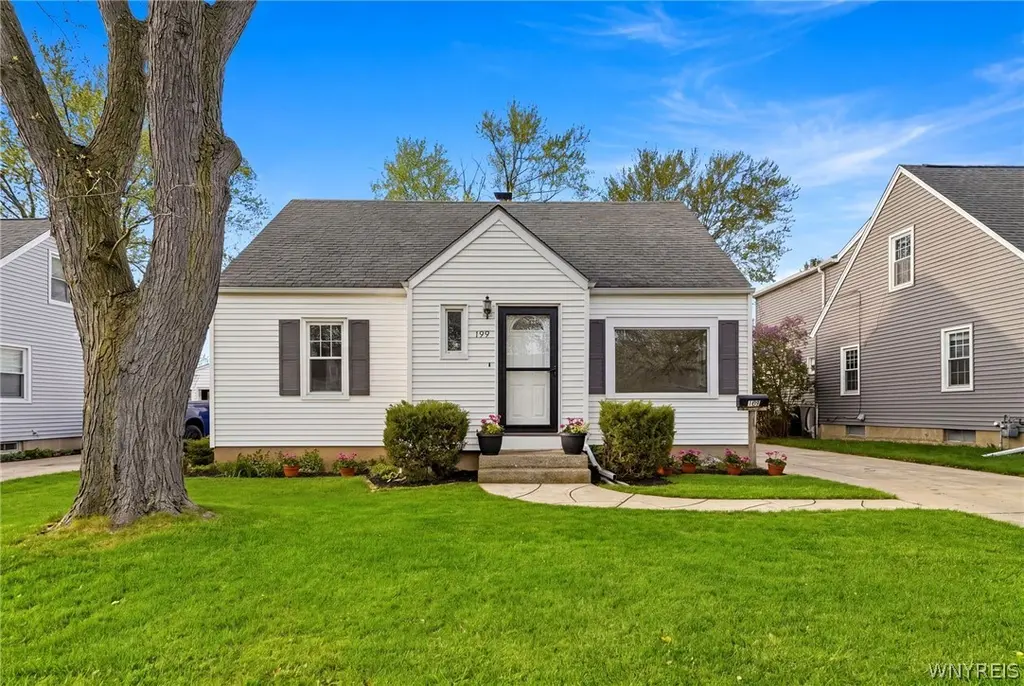
199 Homewood Ave · Tonawanda Town, NY
Flood risk 1/10 · Minimal
- FEMA flood zone
- X (unshaded)
- Chance of flooding over 30 yrs
- 0.0%
- Est. flood insurance / yr
- $473 – $860
Fire risk 1/10 · Minimal
- Est. fire insurance / yr
- $691 – $1,283
Heat risk 3/10 · Minor
- Hot days now (above 92°F)
- 7 days/yr
- Hot days in 30 yrs
- 15 days/yr
Wind risk 1/10 · Minimal
- Chance of severe wind over 30 yrs
- —
Air-quality risk 3/10 · Minor
- Unhealthy air days now
- 3 days/yr
- Unhealthy air days in 30 yrs
- 4 days/yr
Risk factors via First Street. Map © Google.
Why this score? — see what drove the C- grade
The composite is a weighted blend of 9 inputs, each scored 0–100. Each bar is that input's sub-score; the figure is the points it added to the 100-point composite (weight × sub-score).
- Cash flow +16.5/30.0
- ARV discount +11.7/15.0
- 1% rule +5.2/10.0
- DSCR +5.1/10.0
- Rent growth +4.9/5.0
- Schools +3.9/10.0
- Livability +2.5/5.0
- Condition / age +2.5/5.0
- Appreciation +0.0/10.0
$249,900
🖨 Deal sheet 📄 Offer letter ✓ Due diligence
Listing remarks
199 Homewood Ave is picture perfect and move in ready! 4 bedrooms and 1.5 bathrooms. Completely remodeled kitchen with new appliances. Both bathrooms are remodeled. Gleaming hardwood floors thoroughout the livingroom and downstairs bedrooms. New floors thoughout the kitchen, both bathrooms, and upstairs bedrooms. Freshly painted throughout. Updated: windows, mechanics, and electrical. Architectural roof. Vinyl siding and concrete driveway. Massive backyard with draintile. 1.5 detached garage. Don't wait!
Key facts
- New floors
- Updated windows
- Remodeled kitchen
Tags
Property features AI
Exterior
- Parking: Detached garage; Approximately 1.5 garage spaces
- Utilities: Public water (connected); Sewer connected
- Home design: Single-story; Existing construction; Vinyl siding
- Construction: Poured foundation
- Exterior features: Concrete driveway; City street frontage; Rectangular residential lot (approx. 50 x 127)
Interior
- Kitchen: Dishwasher; Free-standing range; Oven; Refrigerator
- Bedrooms: 2 main-level bedrooms
- Flooring: Hardwood; Luxury vinyl; Varies
- Bathrooms: 1 full bathroom; 1 half bathroom
- Heating & cooling: Gas forced-air heating
- Interior features: Eat-in kitchen; Bedroom on main level; Main-level primary bedroom; Full basement
- Laundry & utility: Gas water heater
Neighborhood map
What this means for you Summary
Snapshot
- This is a 4-bed/1.5-bath single-family listed at $250k.
Deal economics
- At list price, monthly cash flow is $147 ($2k/yr) — positive.
- The deal already cash-flows at list — no discount required.
- Meets the 1% rule at list price ($3k rent vs $250k).
- Recommended offer: $246k (1.5% below list) — sets the bar for market timing.
- Cap rate 7.0% vs local median 4.1% in Tonawanda Town — top-decile yield for the area; either an underpriced asset or a hidden risk that comps aren't pricing in. Stress-test before assuming the spread holds.
Location & tenants
- Location reads: area grade C — affects rentability + tenant quality, not the cash-flow math above.
- Kenmore-Tonawanda Union Free School District (suburban): math 44% / reading 47% proficiency, ranked #453 of 590 in NY (top 77%) — families likely to look elsewhere, expect single-tenant / working-renter base with shorter leases.
- Market conditions: Rents rising fast (+9.8%/yr); 99 active listings in the ZIP; 4 comparable units currently listed for rent nearby; rentals at typical pace (median 24d on market — plan ~3-4 weeks tenant-placement turnaround); 1,244 units permitted in Erie County in 2024 (563 in 5+ unit buildings).
- This rent runs 42% of the median local income ($74k/yr) — at the standard rent-burdened threshold; future hikes will face affordability resistance.
Forward outlook
- Local home prices are declining (-3.0%/yr); year-one equity from $2k of loan paydown is wiped out by about $7k of value loss. Plan a longer hold.
- At projected returns (-3.0% appreciation + 8.0% rent growth), your $70k cash investment doubles in ~10 years — after that, you're playing with house money.
Negotiation context
- It's been on market 27 days — a 2% lower offer ($246k) is reasonable based on typical stale-listing flexibility.
Risks & watch-outs
- Watch-outs: built in 1946 — expect roof / HVAC / electrical / plumbing capex.
Questions for the listing agent
- Built in 1946 — when were the roof, HVAC, electrical panel, plumbing, and water heater last replaced?
- Is there a deadline driving the sale (1031 exchange, divorce, estate, relocation)? That informs how much negotiation room exists.
- What's the average days-on-market for RENTAL listings here right now (not sales)? A rising rental-DOM trend means longer vacancies and softer asking-rent achievability than the comps imply.
- What's the recent tenant-quality profile in this submarket — average credit score on applications, eviction rate, late-payment / NSF rate, and stable-employment percentage? A property-management company in the area should have these aggregated.
- How much new for-sale + rental construction is in the pipeline within 1–3 miles? Heavy new supply typically softens prices + rents 12–24 months out; constrained supply supports both.
Investment metrics
- 1% rule
- 1.02% ✓
- Cap rate
- 7.00%
- Cash-on-cash
- 2.53%
- DSCR
- 1.11
- GRM
- 8.2
CMA / ARV
- ARV (median comp)
- $275,495
- List price
- $249,900
- Delta
- -9.29%
- Verdict
- FAIR
- Comps
- 20 within 1.0 mi
Show comp detail 12 sales within ~0.75 mi
| Address | Dist | Beds/Ba | Sqft | Sold | Price | $/sf | Match |
|---|---|---|---|---|---|---|---|
| 298 Lowell Rd | 0.29mi | 3/1.5 (-1) | 1,249 (+5%) | 2mo | $190,000 | $152 | 71 |
| 308 Lowell Rd | 0.31mi | 3/1.0 (-1) | 1,249 (+5%) | 6mo | $243,000 | $195 | 65 |
| 99 Coventry Rd | 0.19mi | 3/2.0 (-1) | 1,314 (+11%) | 6mo | $285,000 | $217 | 61 |
| 216 Waverly Ave | 0.38mi | 3/1.0 (-1) | 1,257 (+6%) | 6mo | $185,000 | $147 | 60 |
| 82 Canterbury Ln | 0.23mi | 3/1.0 (-1) | 1,307 (+10%) | 8mo | $235,000 | $180 | 59 |
| 21 Waverly Ave | 0.50mi | 3/1.0 (-1) | 1,248 (+5%) | 8mo | $223,000 | $179 | 54 |
| 295 Westchester Blvd | 0.47mi | 3/1.0 (-1) | 1,284 (+8%) | 6mo | $220,000 | $171 | 52 |
| 110 Traverse Blvd | 0.59mi | 3/1.5 (-1) | 1,290 (+9%) | 2mo | $255,000 | $198 | 52 |
| 16 Zimmerman Blvd | 0.43mi | 3/1.0 (-1) | 1,009 (-15%) | 3mo | $211,050 | $209 | 46 |
| 155 Traverse Blvd | 0.67mi | 3/1.0 (-1) | 1,305 (+10%) | 6mo | $235,000 | $180 | 40 |
| 140 Thurston Ave | 0.63mi | 3/1.0 (-1) | 1,322 (+11%) | 7mo | $255,000 | $193 | 39 |
| 111 Paramount Pkwy | 0.69mi | 3/1.5 (-1) | 1,322 (+11%) | 8mo | $308,149 | $233 | 38 |
Match score weights: distance 35% · size 25% · config 20% · recency 20%. Top-matched comps best support the ARV.
Projected returns pro-forma
-3.0% appreciation · 8.0% rent growth · sell at horizon
- IRR
- -6.4%
- Equity multiple
- 0.75×
- Total profit
- $-17,482
- Equity at exit
- $37,261
- IRR
- 8.8%
- Equity multiple
- 1.84×
- Total profit
- $58,816
- Equity at exit
- $21,607
Cash invested: $69,972 (down + closing). Projections, not guarantees.
Landlord ↔ Tenant lean methodology
- Overall (STATE)
- 15 Strongly Tenant-Friendly
- State New York
- 15 Strongly Tenant-Friendly · D+10
- County
- — inherits STATE
- City
- — inherits STATE
ZIP-level market 14217
- Home prices YoY
- -34.3%
- Rents YoY
- 9.8%
- Active inventory
- 99
- Price-to-rent
- 8.2×
Monthly cashflow live
- Estimated rent
- $2,554 medium interval (Pro) →
- Mortgage (P&I)
- −$1,311
- Tax from tax record
- −$456 /mo · $5,470/yr
- Insurance
- −$104
- HOA
- −$0
- Vacancy / Maint / Mgmt
- −$536
- Net cashflow
- $147
Break-even live
UW: 25.0% down · 7.5% · 30yr · 1.5% tax · 5.0% vac · 8.0% maint · 8.0% mgmt
Financing live
Cash to close
- Down payment
- $62,475
- Closing costs
- $7,497
- Reserves months
- —
- Total cash needed
- —
Loan-product check · same deal, 3 products live
Conventional
25% down · 7.5% · 30yr
- Down + closing
- —
- Monthly P&I
- —
- Monthly cashflow
- —
- DSCR
- —
- Eligible?
- —
Personal DTI + credit; lowest rate.
DSCR
20% down · 8.5% · 30yr
- Down + closing
- —
- Monthly P&I
- —
- Monthly cashflow
- —
- DSCR
- —
- Eligible?
- —
No personal income docs; deal must DSCR.
Hard money
10% down · 12.0% · 12mo
- Down + closing
- —
- Monthly P&I
- —
- Monthly cashflow
- —
- DSCR
- —
- Eligible?
- —
Short-term bridge; refi at stabilization.
Rent comps 4 comps
| Address | Beds | Baths | Sqft | Rent | $/sqft | DOM | Units | Dist |
|---|---|---|---|---|---|---|---|---|
| 148 Colonial Ave Buffalo, NY | 4.0 | 2.0 | 1240 | $2,900 | $2.34 | 23d | 1 | 0.09mi |
| 36-46 Crowell Ct Unit 40 Tonawanda, NY | 3.0 | 1.0 | 1000 | $1,395 | $1.40 | 23d | 1 | 0.59mi |
| 237 W Girard Blvd Buffalo, NY | 4.0 | 1.5 | 1329 | $4,000 | $3.01 | 23d | 1 | 0.83mi |
| 53 Winkler Dr Tonawanda, NY | 3.0 | 1.0 | 1060 | $2,100 | $1.98 | 11d | 1 | 1.20mi |
Listing history 4 events
-
2026-06-02statusdays on market $249,900 Pending 27 DOM
-
2026-06-01days on market $249,900 Active 26 DOM
-
2026-05-31days on market $249,900 Active 25 DOM
-
2026-05-06$249,900 Active 509-char remark
ⓘ Source: listings_history table (triggers on properties + properties_extension) + one-shot
backfill from property_details.listing_events for pre-trigger history.
Tax reassessment forecast NY · Partial reset (capped growth)
- Current annual tax
- $5,470 · $456/mo
- Projected year-2 tax
- $5,470 · $456/mo
- Expected delta
- $0/yr ($0/mo · 0.0%)
ⓘ Screening estimate from a state-policy table — verify with the county assessor before closing.
Climate risk First Street
- Flood 1/10 Low FEMA zone X (unshaded) · 0% chance over 30 yrs
- Wildfire 1/10 Low
- Heat 3/10 Moderate 7 d/yr ≥92°F today · 15 d/yr by 30 yrs out
- Wind 1/10 Low
- Air quality 3/10 Moderate 3 unhealthy d/yr today · 4 by 30 yrs out
Nearby sold comps map
Loading sold comps map…
Walkable amenities ~0.75 mi
Loading nearby amenities…
Taxation est. · year 1
- Rental income
- $30,650
- − Mortgage interest
- −$13,998
- − Property taxes
- −$5,470
- − Insurance
- −$1,250
- − Repairs & maintenance
- −$2,452
- − Management
- −$2,452
- − Depreciation
- −$7,270
- Taxable loss
- −$2,241
- Est. tax savings @ 24.0%
- +$538
- After-tax cash flow
- $2,306/yr
For passive investors: Depreciation is non-cash, so a rental often shows a tax loss while cash-flowing — sheltering income. Rental losses are passive: they offset passive income freely, and up to $25,000/yr can offset ordinary (W-2) income if you actively participate and your MAGI is under $100k (phasing out to $0 by $150k); unused losses carry forward. On sale, claimed depreciation is recaptured at up to 25%, and gains may owe capital-gains tax (a 1031 exchange can defer both). Figures are a year-1 estimate at your 24.0% rate — not tax advice; consult a CPA.
Schools (NCES district)
- District
- Kenmore-Tonawanda Union Free School District
- NCES district ID
- 3616230
- Math proficiency
- 44% ▼ -12.00%
- Reading proficiency
- 47% ▼ -1.00%
- Median HH income
- $51,433
- Composite
- 39.18/100
- National rank
- #4024
- State rank
- #453 of 590 in NY
Livability — Tonawanda Town
No livability data for this city. (Only ~50 U.S. cities are tracked.)
Census & demographics
- Census place
- Tonawanda Town, NY
- County
- Erie County · 714,559 people
- City population
- 63,948
- Metro
- Buffalo-Cheektowaga, NY
- Population (ZIP)
- 22,471
- Household income
- $73,800
- Rent vs Own
- Severe rent burden
- 727.0
Population outlook (Erie County) Hauer SSP2
- Today (2025)
- 933,037 people
- By 2030
- 935,181 · +0.2%
- By 2040
- 928,531 · -0.5%
- By 2050
- 905,725 · -2.9%
- By 2075
- 834,037 · -10.6%
- By 2100
- 708,033 · -24.1%
Race, ethnicity, and origin ACS 2023
- Neighborhood character
- Predominantly White (82%)
- Race & ethnicity
- White 82% Two or more races 8% Hispanic / Latino 6% Black 5%
- Hispanic origin (detail)
- Puerto Rican 4%
- Common ancestry
- Romanian 13% Italian 2% Slovak 2%
- Foreign-born
- 4% · Canada
- Languages at home
- 94% English-only · Spanish 3% Arabic 1% Russian/Polish/Slavic 1%
Political lean MEDSL · Erie
- 2024 margin
- Lean D (+9.7) · D 54.8% · R 45.2%
- 2008→2024 swing
- -7.9pp toward R · 2008: 17.5pp · 2024: 9.7pp
- All cycles
- 2024: D+9.7 2020: D+14.7 2016: D+4.8 2012: D+15.6 2008: D+17.5
Not yet ingested
- Civics
- —
Market trends
- HPI YoY
- ▼ -172.52%
- Current HPI
- 330.7596
- Rent YoY
- ▲ 9.76%
- Metro
- Buffalo-Cheektowaga, NY
- State GDP YoY
- ▲ 2.60%
- F500 in state
- 92
Industry mix (Fortune 500 HQ in NY)
| Industry | F500 HQs | Revenue |
|---|---|---|
| Financial Services | 10 | $950B |
|
||
| Consumer Goods | 9 | $162B |
|
||
| Insurance | 4 | $225B |
|
||
| Telecommunications | 2 | $144B |
|
||
| Pharmaceuticals | 2 | $112B |
|
||
| Media / Entertainment | 2 | $69B |
|
||
Price history
2 events — show timeline
- 2026-06-02 Pending — WNYREIS
- 2026-05-06 Listed $249,900 WNYREIS
Property tax history
+7.8%/yrLatest (2025): $5,470 · +4.0% YoY. Source: county tax records.
Cash-flow waterfall
monthlySold comps — $/sqft
last 12 mo · ≤1 miLoading sold comps…