900 E Rankin Rd #110 · Tulare, CA
Flood risk 8/10 · Major
- FEMA flood zone
- A
- Chance of flooding over 30 yrs
- 0.99%
- Est. flood insurance / yr
- $1,009 – $1,996
Fire risk 4/10 · Minor
- Est. fire insurance / yr
- $659 – $1,223
Heat risk 8/10 · Major
- Hot days now (above 106°F)
- 7 days/yr
- Hot days in 30 yrs
- 18 days/yr
Wind risk 1/10 · Minimal
- Chance of severe wind over 30 yrs
- —
Air-quality risk 10/10 · Severe
- Unhealthy air days now
- 33 days/yr
- Unhealthy air days in 30 yrs
- 38 days/yr
Risk factors via First Street. Map © Google.
Why this score? — see what drove the C+ grade
The composite is a weighted blend of 9 inputs, each scored 0–100. Each bar is that input's sub-score; the figure is the points it added to the 100-point composite (weight × sub-score).
- Cash flow +30.0/30.0
- 1% rule +10.0/10.0
- DSCR +10.0/10.0
- Condition / age +3.8/5.0
- Rent growth +3.2/5.0
- Schools +3.0/10.0
- Livability +2.9/5.0
- ARV discount +0.0/15.0
- Appreciation +0.0/10.0
$109,900
🖨 Deal sheet 📄 Offer letter ✓ Due diligence
Listing remarks
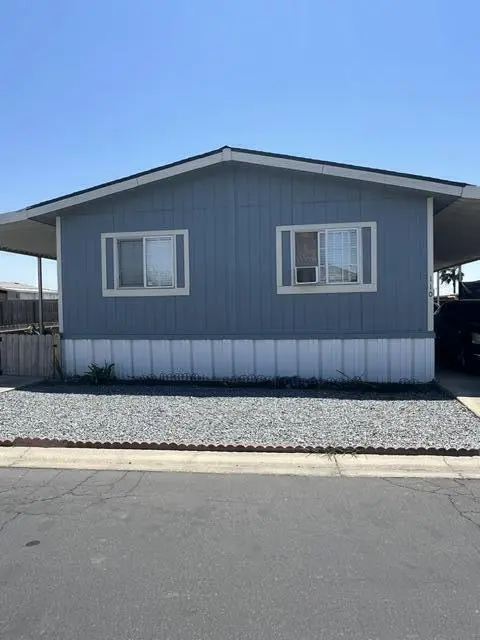
Welcome to this beautifully maintained home located in the desirable Country Club Estates community in Tulare! This spacious 3 bedroom, 2 bath home offers an inviting open concept layout with warm wood style flooring, vaulted ceilings, and abundant natural light throughout. The kitchen features rich cabinetry, ample counter space, a breakfast bar, and plenty of storage perfect for everyday living and entertaining. The oversized primary bathroom offers dual sinks, generous space, and a functional layout designed for comfort. Enjoy relaxing mornings or evening gatherings on the large covered porch, plus low-maintenance landscaping and covered parking for added convenience. Pride of ownership
Key facts
- Ample counter space
- Rich cabinetry
- Vaulted ceilings
Tags
Property features AI
Finance
- HOA & community: Homeowners association with a $100 monthly fee; HOA fee includes sewer and trash
Exterior
- Parking: Attached carport
- Security: Smoke detectors
- Utilities: Public water; Public sewer; Natural gas available and connected
- Home design: Manufactured in park (double wide); No shared/common walls
- Construction: Stucco exterior; Composition roof; Pillar/post/pier foundation; Skirted with metal
- Exterior features: Balcony; Patio; Side porch
Interior
- Kitchen: Dishwasher; Gas range; Microwave; Refrigerator
- Flooring: Laminate
- Bathrooms: 2 full bathrooms
- Heating & cooling: Central air conditioning; Forced air heating
- Interior features: Dishwasher; Gas range; Microwave; Refrigerator; Water heater; Laminate flooring
- Laundry & utility: Laundry inside
Neighborhood map
What this means for you Summary
Snapshot
- This is a 3-bed/2.0-bath manufactured listed at $110k. Condition is rated good.
Deal economics
- At list price, monthly cash flow is $691 ($8k/yr) — positive.
- The deal already cash-flows at list — no discount required.
- Meets the 1% rule at list price ($2k rent vs $110k).
- Recommended offer: $108k (1.5% below list) — sets the bar for market timing.
- Cap rate 15.2% vs local median 3.3% in Tulare — top-decile yield for the area; either an underpriced asset or a hidden risk that comps aren't pricing in. Stress-test before assuming the spread holds.
Location & tenants
- Location reads 58/100 on livability (#701 in CA) — a working-class tenant base; expect higher turnover. Strengths: housing A+; Watch: commute C-, employment D+, schools D-.
- Tulare Joint Union High (suburban): math 18% / reading 52% proficiency, ranked #280 of 517 in CA (top 54%) — families likely to look elsewhere, expect single-tenant / working-renter base with shorter leases.
- Market conditions: Rents rising (+2.7%/yr); 352 active listings in the ZIP; 1,447 units permitted in Tulare County in 2024 (307 in 5+ unit buildings).
- This rent runs 35% of the median local income ($73k/yr) — at the standard rent-burdened threshold; future hikes will face affordability resistance.
Forward outlook
- Local home prices are declining (-3.0%/yr); year-one equity from $760 of loan paydown is wiped out by about $3k of value loss. Plan a longer hold.
- Tulare County population projected at +10% by 2050 — modest demand growth; plan on rents tracking national, not racing it.
- At projected returns (-3.0% appreciation + 2.7% rent growth), your $31k cash investment doubles in ~5 years — after that, you're playing with house money.
Negotiation context
- It's been on market 22 days — a 2% lower offer ($108k) is reasonable based on typical stale-listing flexibility.
Risks & watch-outs
- Watch-outs: flood insurance adds $125/mo.
- Climate carrying-cost: in FEMA flood zone A (mandatory federal flood insurance); extreme-heat days projected 7→18/yr by 2055 (HVAC capex compounding) — expect insurance premiums to compound above CPI over the hold.
Questions for the listing agent
- What's the actual annual flood-insurance premium (NFIP or private), and is the property in a SFHA with mandatory coverage?
- What does the HOA fee cover, when was the last increase, and are there any pending special assessments or reserve-fund shortfalls?
- Is there a deadline driving the sale (1031 exchange, divorce, estate, relocation)? That informs how much negotiation room exists.
- Schools are D-rated, which usually means shorter tenancies and higher turnover. Who's the typical renter profile here, and what's been the actual vacancy rate?
- Crime grade is F in this area — have there been break-ins, vandalism, or insurance claims at this property in the last 3 years? What carrier currently insures it and at what premium?
- What's the average days-on-market for RENTAL listings here right now (not sales)? A rising rental-DOM trend means longer vacancies and softer asking-rent achievability than the comps imply.
- What's the recent tenant-quality profile in this submarket — average credit score on applications, eviction rate, late-payment / NSF rate, and stable-employment percentage? A property-management company in the area should have these aggregated.
- How much new for-sale + rental construction is in the pipeline within 1–3 miles? Heavy new supply typically softens prices + rents 12–24 months out; constrained supply supports both.
Investment metrics
- 1% rule
- 1.93% ✓
- Cap rate
- 15.21%
- Cash-on-cash
- 31.84%
- DSCR
- 2.42
- GRM
- 4.3
CMA / ARV
- ARV (on-the-fly)
- $87,840
- Comps found
- 6
Show comp detail 6 sales within ~0.75 mi
| Address | Dist | Beds/Ba | Sqft | Sold | Price | $/sf | Match |
|---|---|---|---|---|---|---|---|
| 900 E Rankin Rd Rd SE #72 | 0.05mi | 3/2.0 | 1,440 (-2%) | 2mo | $129,000 | $90 | 93 |
| 900 E Rankin Ave #3 | 0.05mi | 3/2.0 | 1,440 (-2%) | 6mo | $79,000 | $55 | 90 |
| 900 E Rankin Rd #134 | 0.05mi | 3/2.0 | 1,500 (+2%) | 11mo | $90,000 | $60 | 84 |
| 900 E Rankin Rd #69 | 0.05mi | 4/2.0 (+1) | 1,400 (-4%) | 6mo | $45,000 | $32 | 80 |
| 900 E Rankin Ave #70 | 0.05mi | 3/2.0 | 1,560 (+7%) | 21mo | $82,000 | $53 | 69 |
| 900 E Rankin Rd #98 | 0.00mi | 3/2.0 | 1,248 (-15%) | 23mo | $110,000 | $88 | 56 |
Match score weights: distance 35% · size 25% · config 20% · recency 20%. Top-matched comps best support the ARV.
Projected returns pro-forma
-3.0% appreciation · 2.67% rent growth · sell at horizon
- IRR
- 20.5%
- Equity multiple
- 1.83×
- Total profit
- $25,689
- Equity at exit
- $16,386
- IRR
- 28.5%
- Equity multiple
- 3.50×
- Total profit
- $76,894
- Equity at exit
- $9,502
Cash invested: $30,772 (down + closing). Projections, not guarantees.
Landlord ↔ Tenant lean methodology
- Overall (STATE)
- 18 Strongly Tenant-Friendly
- State California
- 18 Strongly Tenant-Friendly · D+13
- County
- — inherits STATE
- City
- — inherits STATE
ZIP-level market 93274
- Rents YoY
- 2.7%
- Active inventory
- 352
- Price-to-rent
- 4.3×
Monthly cashflow live
- Estimated rent
- $2,122 medium interval (Pro) →
- Mortgage (P&I)
- −$576
- Tax est. 1.5%
- −$137 /mo · $1,648/yr
- Insurance
- −$46
- Flood insurance flood zone
- −$125 /mo · $1,502/yr
- HOA
- −$100
- Vacancy / Maint / Mgmt
- −$446
- Net cashflow
- $691
Break-even live
UW: 25.0% down · 7.5% · 30yr · 1.5% tax · 5.0% vac · 8.0% maint · 8.0% mgmt
Financing live
Cash to close
- Down payment
- $27,475
- Closing costs
- $3,297
- Reserves months
- —
- Total cash needed
- —
Loan-product check · same deal, 3 products live
Conventional
25% down · 7.5% · 30yr
- Down + closing
- —
- Monthly P&I
- —
- Monthly cashflow
- —
- DSCR
- —
- Eligible?
- —
Personal DTI + credit; lowest rate.
DSCR
20% down · 8.5% · 30yr
- Down + closing
- —
- Monthly P&I
- —
- Monthly cashflow
- —
- DSCR
- —
- Eligible?
- —
No personal income docs; deal must DSCR.
Hard money
10% down · 12.0% · 12mo
- Down + closing
- —
- Monthly P&I
- —
- Monthly cashflow
- —
- DSCR
- —
- Eligible?
- —
Short-term bridge; refi at stabilization.
HOA detail
- Monthly dues
- $100 · $1,200/yr
- Likely covers
- landscaping
Listing history 17 events
-
2026-06-18days on market $109,900 Active 22 DOM
-
2026-06-17days on market $109,900 Active 21 DOM
-
2026-06-16days on market $109,900 Active 20 DOM
-
2026-06-15days on market $109,900 Active 19 DOM
-
2026-06-14days on market $109,900 Active 17 DOM
-
2026-06-13days on market $109,900 Active 16 DOM
-
2026-06-10days on market $109,900 Active 14 DOM
-
2026-06-09days on market $109,900 Active 13 DOM
-
2026-06-08days on market $109,900 Active 12 DOM
-
2026-06-07days on market $109,900 Active 11 DOM
-
2026-06-05days on market $109,900 Active 8 DOM
-
2026-06-03days on market $109,900 Active 7 DOM
-
2026-06-02days on market $109,900 Active 6 DOM
-
2026-06-01days on market $109,900 Active 5 DOM
-
2026-05-31days on market $109,900 Active 4 DOM
-
2026-05-30days on market $109,900 Active 3 DOM
-
2026-05-28$109,900 Active
ⓘ Source: listings_history table (triggers on properties + properties_extension) + one-shot
backfill from property_details.listing_events for pre-trigger history.
Climate risk First Street
- Flood 8/10 Severe FEMA zone A · 99% chance over 30 yrs
- Wildfire 4/10 Moderate
- Heat 8/10 Severe 7 d/yr ≥106°F today · 18 d/yr by 30 yrs out
- Wind 1/10 Low
- Air quality 10/10 Extreme 33 unhealthy d/yr today · 38 by 30 yrs out
Nearby sold comps map
Loading sold comps map…
Walkable amenities ~0.75 mi
Loading nearby amenities…
Taxation est. · year 1
- Rental income
- $25,458
- − Mortgage interest
- −$6,156
- − Property taxes
- −$1,648
- − Insurance
- −$2,052
- − Repairs & maintenance
- −$2,037
- − Management
- −$2,037
- − HOA
- −$1,200
- − Depreciation
- −$3,197
- Taxable income
- $7,131
- Est. tax owed @ 24.0%
- −$1,711
- After-tax cash flow
- $6,584/yr
For passive investors: Depreciation is non-cash, so a rental often shows a tax loss while cash-flowing — sheltering income. Rental losses are passive: they offset passive income freely, and up to $25,000/yr can offset ordinary (W-2) income if you actively participate and your MAGI is under $100k (phasing out to $0 by $150k); unused losses carry forward. On sale, claimed depreciation is recaptured at up to 25%, and gains may owe capital-gains tax (a 1031 exchange can defer both). Figures are a year-1 estimate at your 24.0% rate — not tax advice; consult a CPA.
Condition & rehab AI · 8 photos
This well-maintained mobile home in Country Club Estates offers a good condition with minor cosmetic updates needed to enhance its resale and rental value.
Repairs flagged
- Minor kitchen backsplash — simple update to modernize kitchen
- Minor bathroom vanity — simple update to modernize bathroom
Value-add opportunities
- Both paint interior walls — enhances curb appeal and interior aesthetics
- Both replace kitchen backsplash — modernizes kitchen and adds value
- Both replace bathroom vanity — modernizes bathroom and adds value
Renovation cost estimate screening
| Repair item | Severity | Est. cost |
|---|---|---|
| kitchen backsplash · simple update to modernize kitchen | Minor | $500–3,000 |
| bathroom vanity · simple update to modernize bathroom | Minor | $500–3,000 |
| Total estimated repair cost · 2 items | $1,000–6,000 |
Value-add ROI direction
- Both paint interior walls — enhances curb appeal and interior aesthetics ↑
- Both replace kitchen backsplash — modernizes kitchen and adds value ↑
- Both replace bathroom vanity — modernizes bathroom and adds value ↑
ⓘ Cost ranges are severity-bucket heuristics (US national rule-of-thumb). Get contractor quotes + a written scope before underwriting a rehab budget.
Schools (NCES district)
- District
- Tulare Joint Union High
- NCES district ID
- 0639930
- Math proficiency
- 18% ▼ -6.00%
- Reading proficiency
- 52% ▼ -1.00%
- Median HH income
- $46,858
- Composite
- 29.91/100
- National rank
- #6384
- State rank
- #280 of 517 in CA
Livability — Tulare
- Score
- 58/100
- State rank
- #701
- US rank
- #21185
Category grades
Schools grade is shown separately in the Schools card above.
Census & demographics
- Census place
- Tulare, CA
- County
- Tulare County · 323,826 people
- City population
- 80,026
- Metro
- Visalia, CA
- Population (ZIP)
- 80,026
- Household income
- $72,650
- Rent vs Own
- Severe rent burden
- 2393.0
Population outlook (Tulare County) Hauer SSP2
- Today (2025)
- 484,681 people
- By 2030
- 496,241 · +2.4%
- By 2040
- 518,507 · +7.0%
- By 2050
- 534,920 · +10.4%
- By 2075
- 548,417 · +13.2%
- By 2100
- 513,085 · +5.9%
Race, ethnicity, and origin ACS 2023
- Neighborhood character
- Majority Hispanic (64%)
- Race & ethnicity
- Hispanic / Latino 64% White 29% Two or more races 24% Asian 2% Black 2%
- Hispanic origin (detail)
- Mexican 60%
- Common ancestry
- Russian 7% Iranian 1% Italian 1%
- Foreign-born
- 19% · Canada, Vietnam
- Languages at home
- 52% English-only · Spanish 42% Other Indo-European 3% Other Asian/Pacific 1%
Political lean MEDSL · Tulare
- 2024 margin
- Strong R (+20.7) · D 38.5% · R 59.2% · Other 2.3%
- 2008→2024 swing
- -5.4pp toward R · 2008: -15.3pp · 2024: -20.7pp
- All cycles
- 2024: R+20.7 2020: R+7.8 2016: R+12.1 2012: R+17.8 2008: R+15.3
Not yet ingested
- Civics
- —
Market trends
- HPI YoY
- ▼ -402.03%
- Current HPI
- 316.0806
- Rent YoY
- ▲ 2.67%
- Metro
- Visalia, CA
- State GDP YoY
- ▲ 3.21%
- F500 in state
- 116
Industry mix (Fortune 500 HQ in CA)
| Industry | F500 HQs | Revenue |
|---|---|---|
| Technology | 27 | $1,492B |
|
||
| Financial Services | 3 | $174B |
|
||
| Retail | 3 | $44B |
|
||
| Insurance | 3 | $26B |
|
||
| Media / Entertainment | 2 | $115B |
|
||
| Pharmaceuticals / Biotech | 2 | $62B |
|
||
Price history
1 event — show timeline
- 2026-05-28 Listed $109,900 TCMLS
Cash-flow waterfall
monthlySold comps — $/sqft
last 12 mo · ≤1 miLoading sold comps…