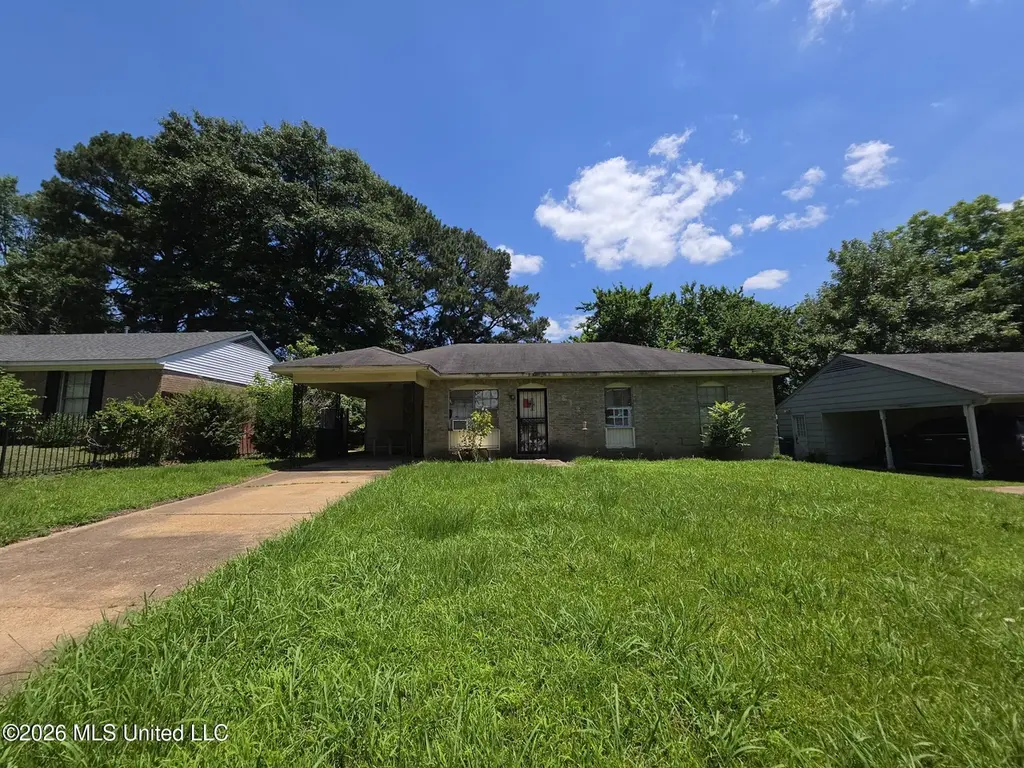
8182 Elmbrook Dr · Southaven, MS
Flood risk 1/10 · Minimal
- FEMA flood zone
- X (unshaded)
- Chance of flooding over 30 yrs
- 0.0%
- Est. flood insurance / yr
- $507 – $1,088
Fire risk 1/10 · Minimal
- Est. fire insurance / yr
- $1,241 – $2,305
Heat risk 6/10 · Moderate
- Hot days now (above 109°F)
- 7 days/yr
- Hot days in 30 yrs
- 21 days/yr
Wind risk 4/10 · Minor
- Chance of severe wind over 30 yrs
- 18.0%
Air-quality risk 2/10 · Minimal
- Unhealthy air days now
- 2 days/yr
- Unhealthy air days in 30 yrs
- 2 days/yr
Risk factors via First Street. Map © Google.
Why this score? — see what drove the B grade
The composite is a weighted blend of 9 inputs, each scored 0–100. Each bar is that input's sub-score; the figure is the points it added to the 100-point composite (weight × sub-score).
- Cash flow +30.0/30.0
- 1% rule +10.0/10.0
- DSCR +10.0/10.0
- ARV discount +7.5/15.0
- Schools +4.0/10.0
- Rent growth +3.3/5.0
- Livability +3.2/5.0
- Condition / age +2.5/5.0
- Appreciation +0.0/10.0
$77,500
🖨 Deal sheet 📄 Offer letter ✓ Due diligence
Listing remarks
Unlock the potential of this diamond in the rough! This property offers a unique opportunity for renovation and transformation. Deferred maintenance, repairs, and updates are needed throughout the property. Suitable for cash buyers, investors, or those experienced with major remodeling projects. Sold as-is. Home will not qualify for standard mortgage financing.
Key facts
- 8,276 sq ft lot
- Parking
- Built 1977
Property features AI
Finance
- HOA & community: Curbs (community feature)
Exterior
- Parking: Carport (1 space); Paved parking
- Security: Dead bolt locks; Security door features; Smoke detectors
- Utilities: Public water; Public sewer; Electricity connected; Natural gas connected; Cable available
- Home design: Single-family house; One level
- Construction: Brick construction; Asphalt shingle roof; Slab foundation; Built (year source: assessor)
- Exterior features: Level lot; Chain link fencing; Curbs
Interior
- Kitchen: Oven
- Flooring: Carpet; Linoleum
- Bathrooms: 1 full bathroom; 1 half bathroom (total 1.5 bathrooms)
- Heating & cooling: Natural gas heating; Central electric air conditioning
- Interior features: Oven; Wood-framed windows; Dead bolt locks and security door features; Smoke detectors
- Laundry & utility: Dedicated laundry room
Neighborhood map
What this means for you Summary
Snapshot
- This is a 2-bed/1.5-bath single-family listed at $78k.
Deal economics
- At list price, monthly cash flow is $634 ($8k/yr) — positive.
- The deal already cash-flows at list — no discount required.
- Meets the 1% rule at list price ($1k rent vs $78k).
- Cap rate 16.1% vs local median 5.2% in Southaven — top-decile yield for the area; either an underpriced asset or a hidden risk that comps aren't pricing in. Stress-test before assuming the spread holds.
Location & tenants
- Location reads 65/100 on livability (#107 in MS) — a middle-class / working-renter tenant base. Strengths: cost of living A+, housing A+; Watch: amenities F, commute F, health & safety F.
- Desoto County School District (suburban): math 48% / reading 42% proficiency, ranked #20 of 130 in MS (top 15%) — families likely to look elsewhere, expect single-tenant / working-renter base with shorter leases.
- Zoned schools: Southaven Elementary (math 20% / reading 23%, grade F, #239 of 375 statewide, top 64%, 684 students, 100% FRL); Southaven Middle School (math 33% / reading 25%, grade F, #90 of 179 statewide, top 52%, 1,456 students, 100% FRL); Southaven High School (math 26% / reading 35%, grade F, #88 of 197 statewide, top 45%, 1,850 students, 100% FRL) — zoned schools average 100% FRL vs 43% district-wide (56 pts higher); higher-poverty schools than district average — tighter screening recommended.
- Zoned-school proficiency averages 27% at this address vs 45% district-wide (-18 pts) — the specific schools serving this property underperform the Desoto County School District average; the district grade overstates school quality for this exact location.
- Market conditions: Rents rising (+3.2%/yr); 193 active listings in the ZIP; 39 comparable units currently listed for rent nearby; rentals at typical pace (median 21d on market — plan ~3-4 weeks tenant-placement turnaround); 1,155 units permitted in DeSoto County in 2024 (0 in 5+ unit buildings).
Forward outlook
- Local home prices are declining (-3.0%/yr); year-one equity from $536 of loan paydown is wiped out by about $2k of value loss. Plan a longer hold.
- DeSoto County population projected at +33% by 2050 — long-run rental-demand tailwind backs the buy-and-hold thesis.
- At projected returns (-3.0% appreciation + 3.2% rent growth), your $22k cash investment doubles in ~4 years — after that, you're playing with house money.
Negotiation context
- Only 1 days on market — expect competitive offers; lowballing is unlikely to land.
- 4 sale attempts since 26y ago with the ask held roughly flat each time — persistent listings suggest the price (not the market) is what's stuck; bring a comps-based counter.
Risks & watch-outs
- Climate carrying-cost: extreme-heat days projected 7→21/yr by 2055 (HVAC capex compounding) — expect insurance premiums to compound above CPI over the hold.
Questions for the listing agent
- Built in 1977 — when were the roof, HVAC, electrical panel, plumbing, and water heater last replaced?
- Is there a deadline driving the sale (1031 exchange, divorce, estate, relocation)? That informs how much negotiation room exists.
- Schools are D-rated, which usually means shorter tenancies and higher turnover. Who's the typical renter profile here, and what's been the actual vacancy rate?
- What's the average days-on-market for RENTAL listings here right now (not sales)? A rising rental-DOM trend means longer vacancies and softer asking-rent achievability than the comps imply.
- What's the recent tenant-quality profile in this submarket — average credit score on applications, eviction rate, late-payment / NSF rate, and stable-employment percentage? A property-management company in the area should have these aggregated.
- How much new for-sale + rental construction is in the pipeline within 1–3 miles? Heavy new supply typically softens prices + rents 12–24 months out; constrained supply supports both.
Investment metrics
- 1% rule
- 1.91% ✓
- Cap rate
- 16.11%
- Cash-on-cash
- 35.08%
- DSCR
- 2.56
- GRM
- 4.4
CMA / ARV
- ARV (on-the-fly)
- $174,400
- Comps found
- 10
Show comp detail 10 sales within ~0.75 mi
| Address | Dist | Beds/Ba | Sqft | Sold | Price | $/sf | Match |
|---|---|---|---|---|---|---|---|
| 8182 Cedarbrook Dr | 0.06mi | 3/1.0 (+1) | 1,075 (-1%) | 2mo | $176,900 | $165 | 87 |
| 8194 Elmbrook Dr | 0.01mi | 3/1.5 (+1) | 1,144 (+5%) | 9mo | $169,900 | $149 | 79 |
| 601 Cottonbrook Cv | 0.32mi | 3/1.0 (+1) | 1,100 (+1%) | 8mo | $145,000 | $132 | 70 |
| 213 Hillbrook Dr | 0.11mi | 3/1.0 (+1) | 1,000 (-8%) | 12mo | $160,000 | $160 | 64 |
| 8131 Oakbrook Dr | 0.15mi | 3/1.5 (+1) | 1,248 (+14%) | 2mo | $189,000 | $151 | 62 |
| 549 Cottonbrook Cv | 0.27mi | 3/1.5 (+1) | 1,200 (+10%) | 8mo | $189,000 | $158 | 59 |
| 8181 Martha Ann Ln | 0.35mi | 3/1.0 (+1) | 1,100 (+1%) | 22mo | $160,000 | $145 | 57 |
| 7708 Lilly Ln | 0.63mi | 2/2.0 | 1,117 (+2%) | 14mo | $215,000 | $192 | 53 |
| 7643 Lilly Ln | 0.70mi | 2/2.0 | 1,100 (+1%) | 20mo | $183,000 | $166 | 47 |
| 7693 Iris Cv | 0.67mi | 3/2.0 (+1) | 1,200 (+10%) | 14mo | $219,900 | $183 | 33 |
Match score weights: distance 35% · size 25% · config 20% · recency 20%. Top-matched comps best support the ARV.
Projected returns pro-forma
-3.0% appreciation · 3.2% rent growth · sell at horizon
- IRR
- 30.9%
- Equity multiple
- 2.30×
- Total profit
- $28,164
- Equity at exit
- $11,556
- IRR
- 38.2%
- Equity multiple
- 4.59×
- Total profit
- $77,869
- Equity at exit
- $6,701
Cash invested: $21,700 (down + closing). Projections, not guarantees.
Landlord ↔ Tenant lean methodology
- Overall (STATE)
- 90 Strongly Landlord-Friendly
- State Mississippi
- 90 Strongly Landlord-Friendly · R+11
- County
- — inherits STATE
- City
- — inherits STATE
ZIP-level market 38671
- Home prices YoY
- -18.2%
- Rents YoY
- 3.2%
- Active inventory
- 193
- Price-to-rent
- 4.4×
Monthly cashflow live
- Estimated rent
- $1,481 high interval (Pro) →
- Mortgage (P&I)
- −$406
- Tax est. 1.5%
- −$97 /mo · $1,162/yr
- Insurance
- −$32
- HOA
- −$0
- Vacancy / Maint / Mgmt
- −$311
- Net cashflow
- $634
Break-even live
UW: 25.0% down · 7.5% · 30yr · 1.5% tax · 5.0% vac · 8.0% maint · 8.0% mgmt
Financing live
Cash to close
- Down payment
- $19,375
- Closing costs
- $2,325
- Reserves months
- —
- Total cash needed
- —
Loan-product check · same deal, 3 products live
Conventional
25% down · 7.5% · 30yr
- Down + closing
- —
- Monthly P&I
- —
- Monthly cashflow
- —
- DSCR
- —
- Eligible?
- —
Personal DTI + credit; lowest rate.
DSCR
20% down · 8.5% · 30yr
- Down + closing
- —
- Monthly P&I
- —
- Monthly cashflow
- —
- DSCR
- —
- Eligible?
- —
No personal income docs; deal must DSCR.
Hard money
10% down · 12.0% · 12mo
- Down + closing
- —
- Monthly P&I
- —
- Monthly cashflow
- —
- DSCR
- —
- Eligible?
- —
Short-term bridge; refi at stabilization.
Rent comps 39 comps
| Address | Beds | Baths | Sqft | Rent | $/sqft | DOM | Units | Dist |
|---|---|---|---|---|---|---|---|---|
| 8082 Whitebrook Dr Southaven, MS | 3.0 | 1.0 | 1100 | $1,495 | $1.36 | 23d | 1 | 0.16mi |
| 8254 Pinebrook Dr Southaven, MS | 3.0 | 1.0 | 1095 | $1,385 | $1.26 | 43d | 1 | 0.18mi |
| 842 Farmington Dr N Southaven, MS | 3.0 | 2.0 | 1400 | $1,595 | $1.14 | 4d | 1 | 0.64mi |
| 7711 Iris Cv Southaven, MS | 3.0 | 2.0 | 1284 | $1,710 | $1.33 | 2d | 1 | 0.65mi |
| 8061 Creekwood Cir W Southaven, MS | 2.0 | 1.5 | 1300 | $1,550 | $1.19 | 16d | 1 | 0.82mi |
| 8085 Creekwood Cir E Southaven, MS | 2.0 | 2.0 | 1000 | $1,600 | $1.60 | 43d | 1 | 0.87mi |
| 7456 Overlook Dr Southaven, MS | 2.0 | 2.0 | 1212 | $1,550 | $1.28 | 43d | 1 | 0.93mi |
| 8375 Old Forge Rd Southaven, MS | 3.0 | 2.0 | 1080 | $1,295 | $1.20 | 4d | 1 | 0.95mi |
| 7560 Chesteridge Ave Southaven, MS | 1.0–3.0 | 1.0–2.0 | 887 | $1,312 | $1.48 | 1d | 7 | 0.97mi |
| 7187 Gazebo Dr Southaven, MS | 2.0 | 2.0 | 1026 | $1,450 | $1.41 | 14d | 1 | 1.02mi |
| 769 Barrington Woods Cv Unit 6 Southaven, MS | 2.0 | 2.0 | 1100 | $1,345 | $1.22 | 23d | 1 | 1.08mi |
| 8743 Greenbrook Pkwy Southaven, MS | 3.0 | 2.0 | 1229 | $1,590 | $1.29 | 21d | 1 | 1.11mi |
| 818 Barrington Woods Cv Unit 769-6 Southaven, MS | 2.0 | 2.0 | 1100 | $1,345 | $1.22 | 23d | 1 | 1.13mi |
| 818 Barrington Woods Cv Unit 817 Southaven, MS | 2.0 | 1.5 | 1176 | $1,395 | $1.19 | 14d | 1 | 1.13mi |
| 817 Barrington Woods Cv Southaven, MS | 2.0 | 1.5 | 1176 | $1,395 | $1.19 | 14d | 1 | 1.13mi |
| 1000 Sutton Pl Horn Lake, MS | 1.0 | 1.0 | 900 | $1,454 | $1.62 | 11d | 1 | 1.14mi |
| 1000 Sutton Pl Horn Lake, MS | 2.0 | 2.0 | 1100 | $1,540 | $1.40 | 44d | 1 | 1.14mi |
| 1000 Sutton Pl Horn Lake, MS | 1.0 | 1.0 | 900 | $1,328 | $1.48 | 2d | 1 | 1.14mi |
| 1000 Sutton Pl Horn Lake, MS | 1.0 | 1.0 | 900 | $1,336 | $1.48 | 43d | 1 | 1.14mi |
| 863 Hackberry Dr Southaven, MS | 3.0 | 2.0 | 1500 | $1,665 | $1.11 | 3d | 1 | 1.18mi |
| 7661 Ragland Pl Southaven, MS | 3.0 | 2.0 | 1242 | $1,793 | $1.44 | 43d | 1 | 1.19mi |
| 875 Hackberry Dr Southaven, MS | 3.0 | 2.0 | 1283 | $1,525 | $1.19 | 21d | 1 | 1.19mi |
| 845 Rockwall Cv Southaven, MS | 3.0 | 1.5 | 1229 | $1,450 | $1.18 | 43d | 1 | 1.21mi |
| 330 Avery Jordan Cv Southaven, MS | 3.0 | 2.0 | 1221 | $1,605 | $1.31 | 4d | 1 | 1.23mi |
| 7654 Stonycreek Cv Southaven, MS | 3.0 | 2.0 | 1293 | $1,650 | $1.28 | 21d | 1 | 1.24mi |
| 8282 Fayette Cv Southaven, MS | 3.0 | 1.5 | 1297 | $1,545 | $1.19 | 14d | 1 | 1.25mi |
| 7605 Davis Pkwy Southaven, MS | 3.0 | 2.0 | 1351 | $1,710 | $1.27 | 23d | 1 | 1.27mi |
| 4896 Lochinvar Dr Southaven, MS | 3.0 | 1.5 | 1112 | $1,081 | $0.97 | 21d | 1 | 1.27mi |
| 5572 Lochinvar Dr Southaven, MS | 3.0 | 1.0 | 1065 | $1,090 | $1.02 | 43d | 1 | 1.27mi |
| 970 Millcreek Pl Southaven, MS | 3.0 | 2.0 | 1253 | $1,550 | $1.24 | 14d | 1 | 1.28mi |
| 1416 Moss Point Dr Southaven, MS | 3.0 | 1.0 | 1197 | $1,533 | $1.28 | 43d | 1 | 1.30mi |
| 1590 Custer Dr Southaven, MS | 3.0 | 1.0 | 900 | $1,295 | $1.44 | 20d | 1 | 1.30mi |
| 371 Alex Cv Southaven, MS | 3.0 | 2.0 | 1300 | $1,595 | $1.23 | 1d | 1 | 1.31mi |
| 1319 Stateline Rd W Southaven, MS | 3.0 | 1.5 | 1189 | $1,395 | $1.17 | 4d | 1 | 1.32mi |
| 8280 Hastings Cv Southaven, MS | 3.0 | 1.5 | 1184 | $1,350 | $1.14 | 21d | 1 | 1.34mi |
| 1296 Vicksburg Dr Southaven, MS | 3.0 | 1.0 | 1000 | $1,250 | $1.25 | 23d | 1 | 1.35mi |
| 8297 Baldwyn Cv Southaven, MS | 3.0 | 1.0 | 1065 | $1,323 | $1.24 | 23d | 1 | 1.35mi |
| 8328 Dottley Dr Southaven, MS | 3.0 | 2.0 | 1184 | $1,573 | $1.33 | 43d | 1 | 1.39mi |
| 1699 Whitehead Dr Southaven, MS | 3.0 | 1.0 | 1000 | $1,195 | $1.20 | 43d | 1 | 1.41mi |
Listing history 2 events
-
2026-06-07remarks 363-char remark
-
2026-06-07$77,500 Pending 1 DOM
ⓘ Source: listings_history table (triggers on properties + properties_extension) + one-shot
backfill from property_details.listing_events for pre-trigger history.
Climate risk First Street
- Flood 1/10 Low FEMA zone X (unshaded) · 0% chance over 30 yrs
- Wildfire 1/10 Low
- Heat 6/10 Major 7 d/yr ≥109°F today · 21 d/yr by 30 yrs out
- Wind 4/10 Moderate 18% chance of damaging wind over 30 yrs
- Air quality 2/10 Low 2 unhealthy d/yr today · 2 by 30 yrs out
Nearby sold comps map
Loading sold comps map…
Walkable amenities ~0.75 mi
Loading nearby amenities…
Taxation est. · year 1
- Rental income
- $17,771
- − Mortgage interest
- −$4,341
- − Property taxes
- −$1,162
- − Insurance
- −$388
- − Repairs & maintenance
- −$1,422
- − Management
- −$1,422
- − Depreciation
- −$2,255
- Taxable income
- $6,782
- Est. tax owed @ 24.0%
- −$1,628
- After-tax cash flow
- $5,984/yr
For passive investors: Depreciation is non-cash, so a rental often shows a tax loss while cash-flowing — sheltering income. Rental losses are passive: they offset passive income freely, and up to $25,000/yr can offset ordinary (W-2) income if you actively participate and your MAGI is under $100k (phasing out to $0 by $150k); unused losses carry forward. On sale, claimed depreciation is recaptured at up to 25%, and gains may owe capital-gains tax (a 1031 exchange can defer both). Figures are a year-1 estimate at your 24.0% rate — not tax advice; consult a CPA.
Schools (NCES district)
- District
- Desoto County School District
- NCES district ID
- 2801320
- Math proficiency
- 48% ▼ -13.00%
- Reading proficiency
- 42% ▼ -6.00%
- Median HH income
- $59,272
- Composite
- 39.56/100
- National rank
- #3933
- State rank
- #20 of 130 in MS
Livability — Southaven
- Score
- 65/100
- State rank
- #107
- US rank
- #12584
Category grades
Schools grade is shown separately in the Schools card above.
Census & demographics
- Census place
- Southaven, MS
- County
- DeSoto County · 176,513 people
- City population
- 53,755
- Metro
- Memphis, TN-MS-AR
- Population (ZIP)
- 37,319
- Household income
- $61,843
- Rent vs Own
- Severe rent burden
- 1583.0
Population outlook (DeSoto County) Hauer SSP2
- Today (2025)
- 203,338 people
- By 2030
- 217,692 · +7.1%
- By 2040
- 245,320 · +20.6%
- By 2050
- 270,133 · +32.8%
- By 2075
- 323,341 · +59.0%
- By 2100
- 348,742 · +71.5%
Race, ethnicity, and origin ACS 2023
- Neighborhood character
- Diverse neighborhood (Simpson 0.58)
- Race & ethnicity
- White 49% Black 42% Hispanic / Latino 6% Two or more races 4%
- Hispanic origin (detail)
- Mexican 3%
- Common ancestry
- Italian 1% Lithuanian 1% Serbian 1%
- Foreign-born
- 3% · Canada
- Languages at home
- 95% English-only · Spanish 4%
Political lean MEDSL · DeSoto
- 2024 margin
- Strong R (+24.1) · D 36.7% · R 60.8% · Other 2.5%
- 2008→2024 swing
- +14.2pp toward D · 2008: -38.2pp · 2024: -24.1pp
- All cycles
- 2024: R+24.1 2020: R+23.9 2016: R+34.8 2012: R+33.5 2008: R+38.2
Not yet ingested
- Civics
- —
Market trends
- HPI YoY
- ▼ -49.08%
- Current HPI
- 220.7875
- Rent YoY
- ▲ 3.20%
- Metro
- Memphis, TN-MS-AR
- State GDP YoY
- —
- F500 in state
- 0
Price history
+16.5% since first listed9 events — show timeline
- 2026-06-04 Pending — MLSU
- 2026-06-04 Listed $77,500 MLSU
- 2021-10-11 Listing Removed — MLSU
- 2021-10-03 Listing Removed — MLSU
- 2002-10-01 Sold (Public Records) — Public Records
- 2002-09-30 Sold (MLS) — MLSU
- 2002-07-25 Listed $69,900 MLSU
- 2001-03-21 Listed $64,900 MLSU
- 2000-06-30 Listed $66,500 MLSU
Property tax history
-32.0%/yrLatest (2025): $8 · +0.0% YoY. Source: county tax records.
Cash-flow waterfall
monthlySold comps — $/sqft
last 12 mo · ≤1 miLoading sold comps…