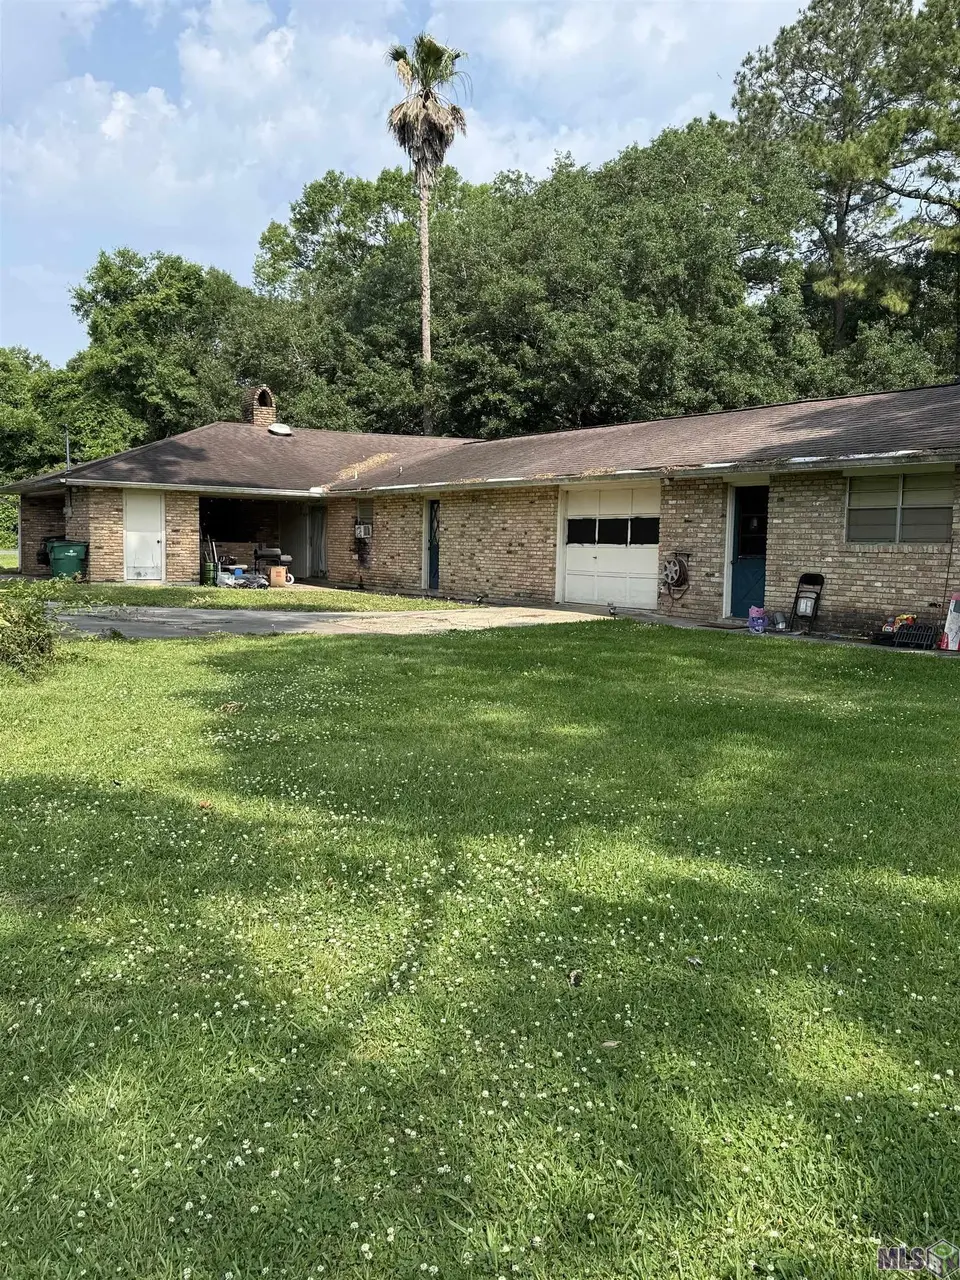
18675 Sidney · Grosse Tete, LA
Flood risk 1/10 · Minimal
- FEMA flood zone
- X
- Chance of flooding over 30 yrs
- 0.0%
- Est. flood insurance / yr
- $507 – $1,088
Fire risk 1/10 · Minimal
- Est. fire insurance / yr
- $1,269 – $2,357
Heat risk 8/10 · Major
- Hot days now (above 108°F)
- 7 days/yr
- Hot days in 30 yrs
- 20 days/yr
Wind risk 9/10 · Severe
- Chance of severe wind over 30 yrs
- 99.0%
Air-quality risk 1/10 · Minimal
- Unhealthy air days now
- 0 days/yr
- Unhealthy air days in 30 yrs
- 0 days/yr
Risk factors via First Street. Map © Google.
Why this score? — see what drove the D- grade
The composite is a weighted blend of 9 inputs, each scored 0–100. Each bar is that input's sub-score; the figure is the points it added to the 100-point composite (weight × sub-score).
- Cash flow +8.2/30.0
- ARV discount +7.5/15.0
- Appreciation +5.0/10.0
- Livability +2.9/5.0
- Rent growth +2.5/5.0
- Condition / age +2.5/5.0
- Schools +2.4/10.0
- DSCR +2.2/10.0
- 1% rule +2.0/10.0
$189,900
🖨 Deal sheet (PDF) 📄 Offer letter ✓ Due diligence
Listing remarks MLS
Lovely home on a beautifully shaded lot in the country. House has lots of space with a formal living room and dining room, den and a recreation room with a separate kitchen. 2 large oak trees shade the yard. A must see!!!
Key facts
- Mother-in-law suite
- Country-style living
- Expansive yard
Tags
Property features AI
Exterior
- Parking: Carport
- Utilities: Public water; Septic tank sewer
- Home design: Detached single-family residence; Residential property
- Construction: Brick construction; Slab foundation; Built area approximately 3300
- Exterior features: Brick exterior; 1-acre lot; Lot dimensions approximately 290 x 290
Interior
- Bathrooms: 3 full bathrooms
- Heating & cooling: Wall furnace heating; Wall unit cooling
- Interior features: Wall furnace heating; Wall unit cooling
Neighborhood map
What this means for you Summary
Snapshot
- This is a 3-bed/3.0-bath single-family listed at $190k.
Deal economics
- At list price, monthly cash flow is $-177 ($-2k/yr) — negative.
- To cash-flow at today's rent, offer at most $159k (16.5% below list).
- To meet the 1% rule (rent ≥ 1% of price), the offer needs to be $133k (30.1% below list).
- Recommended offer: $133k (30.1% below list) — sets the bar for 1% rule.
Location & tenants
- Location reads 57/100 on livability (#330 in LA) — a working-class tenant base; expect higher turnover. Strengths: cost of living A+, housing B+; Watch: crime F, amenities F, commute F.
- Iberville Parish (rural): math 23% / reading 34% proficiency, ranked #45 of 98 in LA (top 46%) — low school quality limits family demand, transient renter base, plan for 1-2y turnover; 76% free/reduced lunch — lower-income household profile, screen leases tightly.
- Zoned schools: North Iberville Elementary (math 22% / reading 32%, grade F, #359 of 646 statewide, top 57%, 285 students, 82% FRL); Plaquemine Senior High School (math 23% / reading 36%, grade F, #127 of 265 statewide, top 49%, 1,131 students, 66% FRL) — zoned schools at 74% FRL track the district average.
- Market conditions: 6 active listings in the ZIP; 117 units permitted in Iberville Parish in 2024 (0 in 5+ unit buildings).
Forward outlook
- In year one you build about $7k of equity ($1k loan paydown + $6k appreciation (3.0% local appreciation)).
- Iberville County population projected to shrink 6% by 2050 — rents likely to lag national; underwrite the cash flow, not the appreciation.
- By year 5, paydown + projected appreciation supports a ~$30k cash-out refi (75% LTV) — recoverable capital for the next deal without selling this one.
Negotiation context
- It's been on market 40 days — a 3% lower offer ($184k) is reasonable based on typical stale-listing flexibility.
- 4 sale attempts since 7y ago; this cycle's ask has dropped $19k (9%) from the opening price — seller is motivated, your offer sets the floor, not the list.
Risks & watch-outs
- Climate carrying-cost: severe wind risk, 99% chance of damaging wind over 30y; extreme-heat days projected 7→20/yr by 2055 (HVAC capex compounding) — expect insurance premiums to compound above CPI over the hold.
Questions for the listing agent
- What do current leases actually rent for vs. the listed asking? Can we see a recent rent roll and the last 12 months of T-12 income?
- It's been on market 40 days. Have you received any prior offers? Is the seller open to a 30% concession, seller financing, or rate buy-down credit?
- Built in 1969 — when were the roof, HVAC, electrical panel, plumbing, and water heater last replaced?
- Is there a deadline driving the sale (1031 exchange, divorce, estate, relocation)? That informs how much negotiation room exists.
- Schools are F-rated, which usually means shorter tenancies and higher turnover. Who's the typical renter profile here, and what's been the actual vacancy rate?
- Crime grade is F in this area — have there been break-ins, vandalism, or insurance claims at this property in the last 3 years? What carrier currently insures it and at what premium?
- The area grade is low — what's the realistic commute time and amenity access for the typical tenant pool here? Any planned neighborhood developments (good or bad) we should know about?
- What's the average days-on-market for RENTAL listings here right now (not sales)? A rising rental-DOM trend means longer vacancies and softer asking-rent achievability than the comps imply.
- What's the recent tenant-quality profile in this submarket — average credit score on applications, eviction rate, late-payment / NSF rate, and stable-employment percentage? A property-management company in the area should have these aggregated.
- How much new for-sale + rental construction is in the pipeline within 1–3 miles? Heavy new supply typically softens prices + rents 12–24 months out; constrained supply supports both.
Investment metrics
- 1% rule
- 0.70% ✗
- Cap rate
- 5.17%
- Cash-on-cash
- -4.00%
- DSCR
- 0.82
- GRM
- 11.9
CMA / ARV
- ARV (median comp)
- $403,259
- List price
- $189,900
- Delta
- -52.91%
- Verdict
- UNDERPRICED
- Comps
- 1 within 2.0 mi
Projected returns pro-forma
3.0% appreciation · 3.0% rent growth · sell at horizon
- IRR
- 3.8%
- Equity multiple
- 1.22×
- Total profit
- $11,568
- Equity at exit
- $85,387
- IRR
- 7.0%
- Equity multiple
- 2.07×
- Total profit
- $56,967
- Equity at exit
- $131,592
Cash invested: $53,172 (down + closing). Projections, not guarantees.
Landlord ↔ Tenant lean methodology
- Overall (STATE)
- 90 Strongly Landlord-Friendly
- State Louisiana
- 90 Strongly Landlord-Friendly · R+12
- County
- — inherits STATE
- City
- — inherits STATE
ZIP-level market 70740
- Active inventory
- 6
- Price-to-rent
- 11.9×
Monthly cashflow live
- Estimated rent
- $1,328 medium interval (Pro) →
- Mortgage (P&I)
- −$996
- Tax from tax record
- −$151 /mo · $1,816/yr
- Insurance
- −$79
- HOA
- −$0
- Vacancy / Maint / Mgmt
- −$279
- Net cashflow
- $-177
Break-even live
Sensitivity live
| Price | -10% $-70 | -5% $-123 | +0% $-177 | +5% $-231 | +10% $-285 |
|---|---|---|---|---|---|
| Rent | -10% $-282 | -5% $-230 | +0% $-177 | +5% $-125 | +10% $-72 |
| Rate | -1.0pp $-81 | -0.5pp $-129 | base $-177 | +0.5pp $-226 | +1.0pp $-276 |
UW: 25.0% down · 7.5% · 30yr · 1.5% tax · 5.0% vac · 8.0% maint · 8.0% mgmt
Financing live
Cash to close
- Down payment
- $47,475
- Closing costs
- $5,697
- Reserves months
- —
- Total cash needed
- —
Loan-product check · same deal, 3 products live
Conventional
25% down · 7.5% · 30yr
- Down + closing
- —
- Monthly P&I
- —
- Monthly cashflow
- —
- DSCR
- —
- Eligible?
- —
Personal DTI + credit; lowest rate.
DSCR
20% down · 8.5% · 30yr
- Down + closing
- —
- Monthly P&I
- —
- Monthly cashflow
- —
- DSCR
- —
- Eligible?
- —
No personal income docs; deal must DSCR.
Hard money
10% down · 12.0% · 12mo
- Down + closing
- —
- Monthly P&I
- —
- Monthly cashflow
- —
- DSCR
- —
- Eligible?
- —
Short-term bridge; refi at stabilization.
Listing history 17 events
-
2026-06-10days on market $189,900 Active 40 DOM
-
2026-06-09days on market $189,900 Active 39 DOM
-
2026-06-08days on market $189,900 Active 38 DOM
-
2026-06-07days on market $189,900 Active 37 DOM
-
2026-06-03days on market $189,900 Active 33 DOM
-
2026-06-02days on market $189,900 Active 32 DOM
-
2026-06-01days on market $189,900 Active 31 DOM
-
2026-05-31days on market $189,900 Active 30 DOM
-
2026-05-31pricedays on market $189,900 Active 29 DOM
-
2026-05-12price $199,900 937-char remark
-
2026-05-12price $199,900 943-char remark
-
2026-04-30$209,000 Active 937-char remark
-
2026-04-30$209,000 Active 943-char remark
-
2019-10-18soldstatus Sold
Show marketing remark (221 chars)
Lovely home on a beautifully shaded lot in the country. House has lots of space with a formal living room and dining room, den and a recreation room with a separate kitchen. 2 large oak trees shade the yard. A must see!!!
-
2019-09-19status Pending
Show marketing remark (221 chars)
Lovely home on a beautifully shaded lot in the country. House has lots of space with a formal living room and dining room, den and a recreation room with a separate kitchen. 2 large oak trees shade the yard. A must see!!!
-
2019-07-09$225,000 Active
Show marketing remark (221 chars)
Lovely home on a beautifully shaded lot in the country. House has lots of space with a formal living room and dining room, den and a recreation room with a separate kitchen. 2 large oak trees shade the yard. A must see!!!
-
2019-07-09$225,000
Show marketing remark (221 chars)
Lovely home on a beautifully shaded lot in the country. House has lots of space with a formal living room and dining room, den and a recreation room with a separate kitchen. 2 large oak trees shade the yard. A must see!!!
ⓘ Source: listings_history table (triggers on properties + properties_extension) + one-shot
backfill from property_details.listing_events for pre-trigger history.
Tax reassessment forecast LA · Resets to sale price
- Current annual tax
- $1,816 · $151/mo
- Projected year-2 tax
- $1,816 · $151/mo
- Expected delta
- $0/yr ($0/mo · 0.0%)
ⓘ Screening estimate from a state-policy table — verify with the county assessor before closing.
Climate risk First Street
- Flood 1/10 Low FEMA zone X · 0% chance over 30 yrs
- Wildfire 1/10 Low
- Heat 8/10 Severe 7 d/yr ≥108°F today · 20 d/yr by 30 yrs out
- Wind 9/10 Extreme 99% chance of damaging wind over 30 yrs
- Air quality 1/10 Low 0 unhealthy d/yr today · 0 by 30 yrs out
Nearby sold comps map
Loading sold comps map…
Walkable amenities ~0.75 mi
Loading nearby amenities…
Taxation est. · year 1
- Rental income
- $15,938
- − Mortgage interest
- −$10,637
- − Property taxes
- −$1,816
- − Insurance
- −$950
- − Repairs & maintenance
- −$1,275
- − Management
- −$1,275
- − Depreciation
- −$5,524
- Taxable loss
- −$5,539
- Est. tax savings @ 24.0%
- +$1,329
- After-tax cash flow
- $-795/yr
For passive investors: Depreciation is non-cash, so a rental often shows a tax loss while cash-flowing — sheltering income. Rental losses are passive: they offset passive income freely, and up to $25,000/yr can offset ordinary (W-2) income if you actively participate and your MAGI is under $100k (phasing out to $0 by $150k); unused losses carry forward. On sale, claimed depreciation is recaptured at up to 25%, and gains may owe capital-gains tax (a 1031 exchange can defer both). Figures are a year-1 estimate at your 24.0% rate — not tax advice; consult a CPA.
Schools (NCES district)
- District
- Iberville Parish
- NCES district ID
- 2200750
- Math proficiency
- 23% ▼ -43.00%
- Reading proficiency
- 34% ▼ -35.00%
- Median HH income
- $44,386
- Composite
- 24.38/100
- National rank
- #7690
- State rank
- #45 of 98 in LA
Livability — Grosse Tete
- Score
- 57/100
- State rank
- #330
- US rank
- #22185
Category grades
Schools grade is shown separately in the Schools card above.
Census & demographics
- Population (ZIP)
- 883
Population outlook (Iberville County) Hauer SSP2
- Today (2025)
- 33,056 people
- By 2030
- 32,819 · -0.7%
- By 2040
- 32,043 · -3.1%
- By 2050
- 30,956 · -6.4%
- By 2075
- 28,314 · -14.3%
- By 2100
- 23,559 · -28.7%
Race, ethnicity, and origin ACS 2023
- Neighborhood character
- Predominantly White (90%)
- Race & ethnicity
- White 90% Black 10%
- Common ancestry
- Lithuanian 17% Italian 4%
Political lean MEDSL · Iberville
- 2024 margin
- Toss-up / Even · D 48.9% · R 49.6% · Other 1.5%
- 2008→2024 swing
- -11.9pp toward R · 2008: 11.2pp · 2024: -0.7pp
- All cycles
- 2024: R+0.7 2020: D+3.7 2016: D+6.3 2012: D+13.4 2008: D+11.2
Not yet ingested
- Civics
- —
Market trends
- HPI YoY
- —
- Current HPI
- —
- Rent YoY
- —
- Metro
- —
- State GDP YoY
- ▲ 3.29%
- F500 in state
- 10
Industry mix (Fortune 500 HQ in LA)
| Industry | F500 HQs | Revenue |
|---|---|---|
| Telecommunications | 2 | $23B |
|
||
| Utilities | 1 | $12B |
|
||
| Wholesale / Distribution | 1 | $5B |
|
||
| Advertising | 1 | $2B |
|
||
Price history
-15.6% since first listed10 events — show timeline
- 2026-05-29 Price Changed $189,900 AcadianaMLS
- 2026-05-29 Price Changed $189,900 GBRMLS
- 2026-05-12 Price Changed $199,900 AcadianaMLS
- 2026-05-12 Price Changed $199,900 GBRMLS
- 2026-04-30 Listed $209,000 GBRMLS
- 2026-04-30 Listed $209,000 AcadianaMLS
- 2019-10-18 Sold (MLS) — GBRMLS
- 2019-09-19 Pending — GBRMLS
- 2019-07-09 Listed $225,000 AcadianaMLS
- 2019-07-09 Listed $225,000 GBRMLS
Property tax history
+6.7%/yrLatest (2024): $1,816 · -0.1% YoY. Source: county tax records.
Cash-flow waterfall
monthlySold comps — $/sqft
last 12 mo · ≤1 miLoading sold comps…