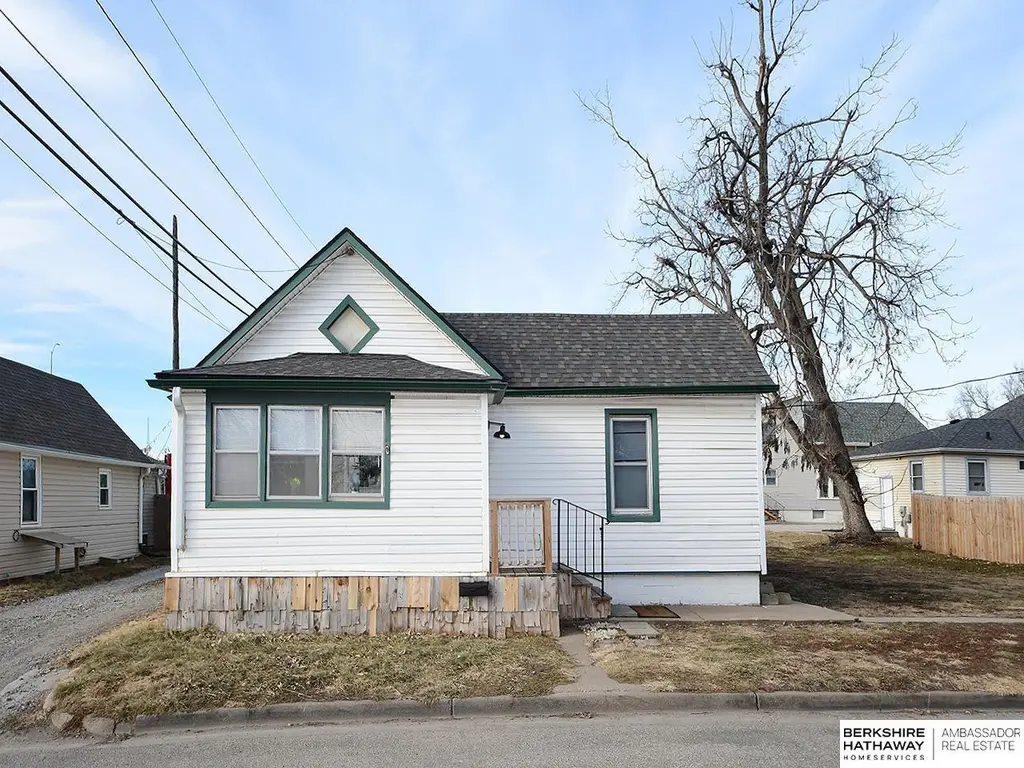
1235 N 7th St · Lincoln, NE
Flood risk No data
- FEMA flood zone
- —
- Chance of flooding over 30 yrs
- —
- Est. flood insurance / yr
- —
Fire risk No data
- Est. fire insurance / yr
- —
Heat risk No data
- Hot days now (above threshold)
- —
- Hot days in 30 yrs
- —
Wind risk No data
- Chance of severe wind over 30 yrs
- —
Air-quality risk No data
- Unhealthy air days now
- —
- Unhealthy air days in 30 yrs
- —
Risk factors via First Street. Map © Google.
Why this score? — see what drove the C+ grade
The composite is a weighted blend of 9 inputs, each scored 0–100. Each bar is that input's sub-score; the figure is the points it added to the 100-point composite (weight × sub-score).
- Cash flow +15.8/30.0
- ARV discount +13.8/15.0
- Appreciation +9.7/10.0
- DSCR +4.9/10.0
- Schools +4.4/10.0
- Livability +4.2/5.0
- 1% rule +4.1/10.0
- Rent growth +2.9/5.0
- Condition / age +2.5/5.0
$134,900
🖨 Deal sheet 📄 Offer letter ✓ Due diligence
Listing remarks
Cute as a button, move in ready and updated! You will love the fabulous location of this nicely renovated Bungalow. Situated within walking distance to Memorial Stadium, easy access to downtown and the Interstate. With new LVP, carpet, kitchen and bath upgrades this wonderful property is ready for new owners. The quaint enclosed front porch is a great space to sit for a coffee break, relax after work, and enjoy being closer to the outdoors during inclement weather. The additional space in the back could be perfect for an office, play area, or a mud room. Take a look at this gem and see for yourself. It could be a great 1st time home, an Airbnb option, perfect for college students, or a ren
Key facts
- New lvp
- 3,485 sq ft lot
- Built 1900
Tags
Property features AI
Exterior
- Parking: No garage
- Utilities: Public water; Public sewer
- Home design: Single-family residence; Residential property; Not new / not a model; One-story (main floor living)
- Construction: Vinyl siding; Built in 1900; Slab foundation
- Exterior features: Porch; Enclosed porch; Shed(s) on the lot; Lot approximately 50 x 70 (about 0.08 acres, up to 1/4 acre)
Interior
- Kitchen: Dining area; Range; Refrigerator
- Bedrooms: Primary bedroom on main floor with ceiling fan and luxury vinyl plank flooring; Second bedroom on main floor with ceiling fan and luxury vinyl plank flooring; Third bedroom on main floor with ceiling fan and luxury vinyl plank flooring; Office on main floor with wall-to-wall carpeting
- Flooring: Luxury vinyl plank; Wall-to-wall carpeting
- Bathrooms: One full bathroom (main level)
- Heating & cooling: Natural gas forced air heating; Central air conditioning
- Interior features: No basement; No fireplaces
- Laundry & utility: Washer; Dryer
Neighborhood map
What this means for you Summary
Snapshot
- This is a 3-bed/1.0-bath single-family listed at $135k.
Deal economics
- At list price, monthly cash flow is $62 ($746/yr) — positive.
- The deal already cash-flows at list — no discount required.
- To meet the 1% rule (rent ≥ 1% of price), the offer needs to be $122k (9.3% below list).
- Recommended offer: $122k (9.3% below list) — sets the bar for 1% rule.
- Cap rate 6.8% vs local median 3.0% in Lincoln — top-decile yield for the area; either an underpriced asset or a hidden risk that comps aren't pricing in. Stress-test before assuming the spread holds.
Location & tenants
- Location reads 85/100 on livability (#5 in NE, #545 nationally) — a professional / high-income tenant draw. Strengths: amenities A+, cost of living A+, housing A+; Watch: crime D+.
- Lincoln Public Schools (urban): math 50% / reading 53% proficiency, ranked #59 of 111 in NE (top 53%) — acceptable for families but not a draw, mixed tenant base, ~2y average lease.
- Zoned schools: Mcphee Elementary School (math 22% / reading 37%, grade F, #427 of 502 statewide, top 87%, 282 students, 0% FRL); Park Middle School (math 37% / reading 37%, grade F, #99 of 128 statewide, top 79%, 834 students, 68% FRL); Lincoln High School (math 38% / reading 41%, grade F, #184 of 261 statewide, top 76%, 2,196 students, 59% FRL).
- Zoned-school proficiency averages 35% at this address vs 52% district-wide (-16 pts) — the specific schools serving this property underperform the Lincoln Public Schools average; the district grade overstates school quality for this exact location.
- Market conditions: Rents rising (+1.7%/yr); 47 active listings in the ZIP; 37 comparable units currently listed for rent nearby; rentals at typical pace (median 21d on market — plan ~3-4 weeks tenant-placement turnaround); 43% of comp listings sitting > 30 days — soft ceiling on asking rent; lower-income renter base — watch delinquency; 1,940 units permitted in Lancaster County in 2024 (895 in 5+ unit buildings).
Forward outlook
- In year one you build about $13k of equity ($933 loan paydown + $13k appreciation (9.3% local appreciation)).
- Lancaster County population projected at +37% by 2050 — long-run rental-demand tailwind backs the buy-and-hold thesis.
- At projected returns (9.3% appreciation + 1.7% rent growth), your $38k cash investment doubles in ~3 years — after that, you're playing with house money.
- By year 3, paydown + projected appreciation supports a ~$34k cash-out refi (75% LTV) — recoverable capital for the next deal without selling this one.
Negotiation context
- Only 12 days on market — expect competitive offers; lowballing is unlikely to land.
- 5 sale attempts since 3y ago with the ask held roughly flat each time — persistent listings suggest the price (not the market) is what's stuck; bring a comps-based counter.
Risks & watch-outs
- Watch-outs: built in 1900 — expect roof / HVAC / electrical / plumbing capex.
Questions for the listing agent
- Built in 1900 — when were the roof, HVAC, electrical panel, plumbing, and water heater last replaced?
- Is there a deadline driving the sale (1031 exchange, divorce, estate, relocation)? That informs how much negotiation room exists.
- Schools are A-rated — typically a magnet for longer-tenancy family renters. What's the average tenant stay here, and is there a school-zone premium baked into asking?
- Crime grade is D in this area — have there been break-ins, vandalism, or insurance claims at this property in the last 3 years? What carrier currently insures it and at what premium?
- What's the average days-on-market for RENTAL listings here right now (not sales)? A rising rental-DOM trend means longer vacancies and softer asking-rent achievability than the comps imply.
- What's the recent tenant-quality profile in this submarket — average credit score on applications, eviction rate, late-payment / NSF rate, and stable-employment percentage? A property-management company in the area should have these aggregated.
- How much new for-sale + rental construction is in the pipeline within 1–3 miles? Heavy new supply typically softens prices + rents 12–24 months out; constrained supply supports both.
Investment metrics
- 1% rule
- 0.91% ✗
- Cap rate
- 6.85%
- Cash-on-cash
- 1.97%
- DSCR
- 1.09
- GRM
- 9.2
CMA / ARV
- ARV (median comp)
- $156,748
- List price
- $134,900
- Delta
- -4.50%
- Verdict
- FAIR
- Comps
- 18 within 1.0 mi
Show comp detail 5 sales within ~0.75 mi
| Address | Dist | Beds/Ba | Sqft | Sold | Price | $/sf | Match |
|---|---|---|---|---|---|---|---|
| 824 Y St | 0.13mi | 2/1.0 (-1) | 936 (-3%) | 14mo | $95,000 | $101 | 73 |
| 836 Y St | 0.14mi | 3/1.0 | 1,040 (+8%) | 14mo | $104,000 | $100 | 68 |
| 1108 Charleston St | 0.31mi | 3/2.0 | 948 (-1%) | 15mo | $124,000 | $131 | 67 |
| 1041 Charleston St | 0.28mi | 3/1.5 | 880 (-8%) | 14mo | $132,000 | $150 | 59 |
| 224 West St E | 0.57mi | 3/1.0 | 840 (-13%) | 8mo | $150,000 | $179 | 46 |
Match score weights: distance 35% · size 25% · config 20% · recency 20%. Top-matched comps best support the ARV.
Projected returns pro-forma
9.31% appreciation · 1.69% rent growth · sell at horizon
- IRR
- 23.8%
- Equity multiple
- 2.84×
- Total profit
- $69,540
- Equity at exit
- $114,830
- IRR
- 20.9%
- Equity multiple
- 6.22×
- Total profit
- $197,187
- Equity at exit
- $240,838
Cash invested: $37,772 (down + closing). Projections, not guarantees.
Landlord ↔ Tenant lean methodology
- Overall (STATE)
- 83 Strongly Landlord-Friendly
- State Nebraska
- 83 Strongly Landlord-Friendly · R+13
- County
- — inherits STATE
- City
- — inherits STATE
ZIP-level market 68508
- Home prices YoY
- 4.1%
- Rents YoY
- 1.7%
- Active inventory
- 47
- Price-to-rent
- 9.2×
Monthly cashflow live
- Estimated rent
- $1,224 high interval (Pro) →
- Mortgage (P&I)
- −$707
- Tax from tax record
- −$141 /mo · $1,692/yr
- Insurance
- −$56
- HOA
- −$0
- Vacancy / Maint / Mgmt
- −$257
- Net cashflow
- $62
Break-even live
UW: 25.0% down · 7.5% · 30yr · 1.5% tax · 5.0% vac · 8.0% maint · 8.0% mgmt
Financing live
Cash to close
- Down payment
- $33,725
- Closing costs
- $4,047
- Reserves months
- —
- Total cash needed
- —
Loan-product check · same deal, 3 products live
Conventional
25% down · 7.5% · 30yr
- Down + closing
- —
- Monthly P&I
- —
- Monthly cashflow
- —
- DSCR
- —
- Eligible?
- —
Personal DTI + credit; lowest rate.
DSCR
20% down · 8.5% · 30yr
- Down + closing
- —
- Monthly P&I
- —
- Monthly cashflow
- —
- DSCR
- —
- Eligible?
- —
No personal income docs; deal must DSCR.
Hard money
10% down · 12.0% · 12mo
- Down + closing
- —
- Monthly P&I
- —
- Monthly cashflow
- —
- DSCR
- —
- Eligible?
- —
Short-term bridge; refi at stabilization.
Rent comps 37 comps
| Address | Beds | Baths | Sqft | Rent | $/sqft | DOM | Units | Dist |
|---|---|---|---|---|---|---|---|---|
| 129 N 10th St Lincoln, NE | 2.0–3.0 | 1.0–2.0 | 1273 | $2,290 | $1.80 | 21d | 4 | 0.81mi |
| 139 N 11th St #1003 Lincoln, NE | 2.0 | 2.0 | 719 | $1,450 | $2.02 | 13d | 1 | 0.84mi |
| 2521 N 9th St Lincoln, NE | 1.0–2.0 | 1.0–2.0 | 700 | $999 | $1.43 | 13d | 4 | 0.88mi |
| 2635 N 5th St Unit 2635 Lincoln, NE | 3.0 | 2.0 | 1060 | $1,595 | $1.50 | 43d | 1 | 0.94mi |
| 2636 N 4th St Unit 2636 Lincoln, NE | 3.0 | 2.0 | 1060 | $1,595 | $1.50 | 43d | 1 | 0.95mi |
| 1421 P St Lincoln, NE | 2.0 | 1.0 | 431 | $1,150 | $2.67 | 21d | 2 | 0.96mi |
| 1421 P St Lincoln, NE | 1.0–2.0 | 1.0 | 508 | $1,150 | $2.26 | 13d | 1 | 0.96mi |
| 1320 N St Lincoln, NE | 2.0 | 1.0 | 886 | $1,475 | $1.66 | 43d | 1 | 1.04mi |
| 126 N 16th St Lincoln, NE | 1.0–2.0 | 1.0–2.0 | 891 | $1,630 | $1.83 | 21d | 4 | 1.06mi |
| 2700 N 1st St #2 Lincoln, NE | 2.0 | 1.0 | 897 | $1,095 | $1.22 | 21d | 1 | 1.07mi |
| 535 W Saunders Ave Unit 3 Lincoln, NE | 2.0 | 1.0 | 889 | $945 | $1.06 | 43d | 1 | 1.12mi |
| 2234 Dudley St Lincoln, NE | 3.0 | 1.0 | 892 | $1,350 | $1.51 | 21d | 1 | 1.15mi |
| 2252 W St Unit 4 Lincoln, NE | 2.0 | 1.0 | 660 | $900 | $1.36 | 43d | 1 | 1.20mi |
| 2260 W St Unit 12 Lincoln, NE | 2.0 | 1.0 | 660 | $900 | $1.36 | 13d | 1 | 1.21mi |
| 1205 Adams St Lincoln, NE | 2.0 | 1.0 | 875 | $1,350 | $1.54 | 43d | 1 | 1.21mi |
| 2900 N 1st St Lincoln, NE | 2.0–3.0 | 1.0–2.0 | 1061 | $1,395 | $1.31 | 43d | 3 | 1.23mi |
| 300 S 16th St Apt 301 Lincoln, NE | 2.0 | 2.0 | 950 | $1,350 | $1.42 | 21d | 1 | 1.24mi |
| 2212 R St Unit 10 Lincoln, NE | 2.0 | 1.0 | 708 | $895 | $1.26 | 43d | 1 | 1.28mi |
| 1735 M St Unit 1737 Lincoln, NE | 2.0 | 1.0 | 1047 | $875 | $0.84 | 13d | 1 | 1.30mi |
| 3201 N 12th St Lincoln, NE | 3.0 | 1.0 | 928 | $1,250 | $1.35 | 13d | 1 | 1.30mi |
| 2335 W St Unit 2343-01 Lincoln, NE | 2.0 | 1.0 | 750 | $950 | $1.27 | 13d | 1 | 1.33mi |
| 539 N 24th St Unit 9 Lincoln, NE | 2.0 | 1.0 | 821 | $945 | $1.15 | 13d | 1 | 1.36mi |
| 539 N 24th St Unit 16 Lincoln, NE | 2.0 | 1.0 | 821 | $945 | $1.15 | 43d | 1 | 1.36mi |
| 2417 Vine St #1 Lincoln, NE | 2.0 | 1.0 | 900 | $875 | $0.97 | 21d | 1 | 1.37mi |
| 2417 Vine St #6 Lincoln, NE | 2.0 | 1.0 | 750 | $850 | $1.13 | 43d | 1 | 1.37mi |
| 830 Judson St Lincoln, NE | 3.0 | 1.0 | 816 | $1,700 | $2.08 | 43d | 1 | 1.38mi |
| 2434 W St Lincoln, NE | 2.0 | 1.0 | 872 | $1,350 | $1.55 | 21d | 1 | 1.38mi |
| 1140 N 25th St Lincoln, NE | 3.0 | 1.0 | 912 | $900 | $0.99 | 43d | 1 | 1.40mi |
| 2516 Dudley St Lincoln, NE | 3.0 | 2.0 | 1028 | $1,450 | $1.41 | 21d | 1 | 1.41mi |
| 420 S 18th St Lincoln, NE | 1.0–3.0 | 1.0–2.0 | 996 | $1,499 | $1.51 | 13d | 8 | 1.41mi |
| 2515 W St Lincoln, NE | 2.0 | 1.0 | 832 | $925 | $1.11 | 21d | 1 | 1.43mi |
| 2515 W St Lincoln, NE | 2.0 | 1.0 | 832 | $925 | $1.11 | 43d | 1 | 1.43mi |
| 521 N 25th St Unit 18 Lincoln, NE | 2.0 | 1.0 | 783 | $850 | $1.09 | 43d | 1 | 1.43mi |
| 2504 Vine St Apt 26 Lincoln, NE | 2.0 | 1.0 | 800 | $835 | $1.04 | 21d | 1 | 1.44mi |
| 930 F St Lincoln, NE | 2.0 | 1.0 | 861 | $1,150 | $1.34 | 21d | 1 | 1.46mi |
| 1900 K St Lincoln, NE | 2.0 | 1.0–2.0 | 775 | $1,630 | $2.10 | 43d | 1 | 1.48mi |
| 2430 Q St Apt 8 Lincoln, NE | 2.0 | 1.0 | 780 | $1,095 | $1.40 | 43d | 1 | 1.49mi |
Listing history 26 events
-
2026-06-18days on market $134,900 Active 12 DOM
-
2026-06-17days on market $134,900 Active 11 DOM
-
2026-06-16days on market $134,900 Active 10 DOM
-
2026-06-15days on market $134,900 Active 9 DOM
-
2026-06-14statusdays on market $134,900 Active 7 DOM
-
2026-06-10days on market $134,900 New 4 DOM
-
2026-06-09days on market $134,900 New 3 DOM
-
2026-06-08days on market $134,900 New 2 DOM
-
2026-06-07pricestatusdays on market $134,900 New 1 DOM
-
2026-06-05days on market $149,700 Active 42 DOM
-
2026-06-03days on market $149,700 Active 41 DOM
-
2026-06-02days on market $149,700 Active 40 DOM
-
2026-06-01days on market $149,700 Active 39 DOM
-
2026-05-31days on market $149,700 Active 38 DOM
-
2026-05-30days on market $149,700 Active 37 DOM
-
2026-04-22$149,700 New 791-char remark
-
2026-04-19historical
-
2026-03-03price $157,500
-
2026-01-21$164,900 New
-
2024-05-30historical
-
2024-02-09$180,000 New
-
2023-09-06soldstatus $125,000 Sold
-
2023-08-06status Pending
-
2023-08-02price $129,000
-
2023-07-20price $139,000
-
2023-07-05$149,500 New
ⓘ Source: listings_history table (triggers on properties + properties_extension) + one-shot
backfill from property_details.listing_events for pre-trigger history.
Tax reassessment forecast NE · Resets to sale price
- Current annual tax
- $1,692 · $141/mo
- Projected year-2 tax
- $2,334 · $194/mo
- Expected delta
- +$642/yr (+$53/mo · 37.9%)
ⓘ Screening estimate from a state-policy table — verify with the county assessor before closing.
Nearby sold comps map
Loading sold comps map…
Walkable amenities ~0.75 mi
Loading nearby amenities…
Taxation est. · year 1
- Rental income
- $14,685
- − Mortgage interest
- −$7,556
- − Property taxes
- −$1,692
- − Insurance
- −$674
- − Repairs & maintenance
- −$1,175
- − Management
- −$1,175
- − Depreciation
- −$3,924
- Taxable loss
- −$1,512
- Est. tax savings @ 24.0%
- +$363
- After-tax cash flow
- $1,108/yr
For passive investors: Depreciation is non-cash, so a rental often shows a tax loss while cash-flowing — sheltering income. Rental losses are passive: they offset passive income freely, and up to $25,000/yr can offset ordinary (W-2) income if you actively participate and your MAGI is under $100k (phasing out to $0 by $150k); unused losses carry forward. On sale, claimed depreciation is recaptured at up to 25%, and gains may owe capital-gains tax (a 1031 exchange can defer both). Figures are a year-1 estimate at your 24.0% rate — not tax advice; consult a CPA.
Schools (NCES district)
- District
- Lincoln Public Schools
- NCES district ID
- 3172840
- Math proficiency
- 50% ▼ -6.00%
- Reading proficiency
- 53% ▼ -3.00%
- Median HH income
- $50,273
- Composite
- 44.05/100
- National rank
- #2880
- State rank
- #59 of 111 in NE
Livability — Lincoln
- Score
- 85/100
- State rank
- #5
- US rank
- #545
Category grades
Schools grade is shown separately in the Schools card above.
Census & demographics
- Census place
- Lincoln, NE
- County
- Lancaster County · 291,509 people
- City population
- 291,509
- Metro
- Lincoln, NE
- Population (ZIP)
- 18,163
- Household income
- $31,191
- Rent vs Own
- Severe rent burden
- 1882.0
Population outlook (Lancaster County) Hauer SSP2
- Today (2025)
- 352,806 people
- By 2030
- 377,899 · +7.1%
- By 2040
- 428,582 · +21.5%
- By 2050
- 483,103 · +36.9%
- By 2075
- 632,390 · +79.2%
- By 2100
- 759,513 · +115.3%
Race, ethnicity, and origin ACS 2023
- Neighborhood character
- Predominantly White (74%)
- Race & ethnicity
- White 74% Hispanic / Latino 11% Two or more races 7% Asian 6% Black 4%
- Hispanic origin (detail)
- Mexican 6%
- Common ancestry
- Romanian 3% Scotch-Irish 2% Lithuanian 2%
- Foreign-born
- 10% · Canada, China, Philippines
- Languages at home
- 84% English-only · Spanish 8% Other Asian/Pacific 2% Chinese 2%
Political lean MEDSL · Lancaster
- 2024 margin
- Toss-up / Even · D 51.4% · R 47.1% · Other 1.5%
- 2008→2024 swing
- -0.7pp no change · 2008: 5.0pp · 2024: 4.3pp
- All cycles
- 2024: D+4.3 2020: D+7.8 2016: D+0.1 2012: R+1.0 2008: D+5.0
Not yet ingested
- Civics
- —
Market trends
- HPI YoY
- ▲ 9.31%
- Current HPI
- 238.2553
- Rent YoY
- ▲ 1.69%
- Metro
- Lincoln, NE
- State GDP YoY
- ▲ 0.68%
- F500 in state
- 2
Industry mix (Fortune 500 HQ in NE)
| Industry | F500 HQs | Revenue |
|---|---|---|
| Conglomerate | 1 | $371B |
|
||
Price history
-9.8% since first listed13 events — show timeline
- 2026-06-06 Listed $134,900 GPRMLS
- 2026-06-05 Listing Removed — GPRMLS
- 2026-04-22 Listed $149,700 GPRMLS
- 2026-04-19 Listing Removed — GPRMLS
- 2026-03-03 Price Changed $157,500 GPRMLS
- 2026-01-21 Listed $164,900 GPRMLS
- 2024-05-30 Listing Removed — GPRMLS
- 2024-02-09 Listed $180,000 GPRMLS
- 2023-09-06 Sold (MLS) $125,000 GPRMLS
- 2023-08-06 Pending — GPRMLS
- 2023-08-02 Price Changed $129,000 GPRMLS
- 2023-07-20 Price Changed $139,000 GPRMLS
- 2023-07-05 Listed $149,500 GPRMLS
Property tax history
-11.5%/yrLatest (2025): $1,692 · -16.4% YoY. Source: county tax records.
Cash-flow waterfall
monthlySold comps — $/sqft
last 12 mo · ≤1 miLoading sold comps…