 🌊 Lakefront
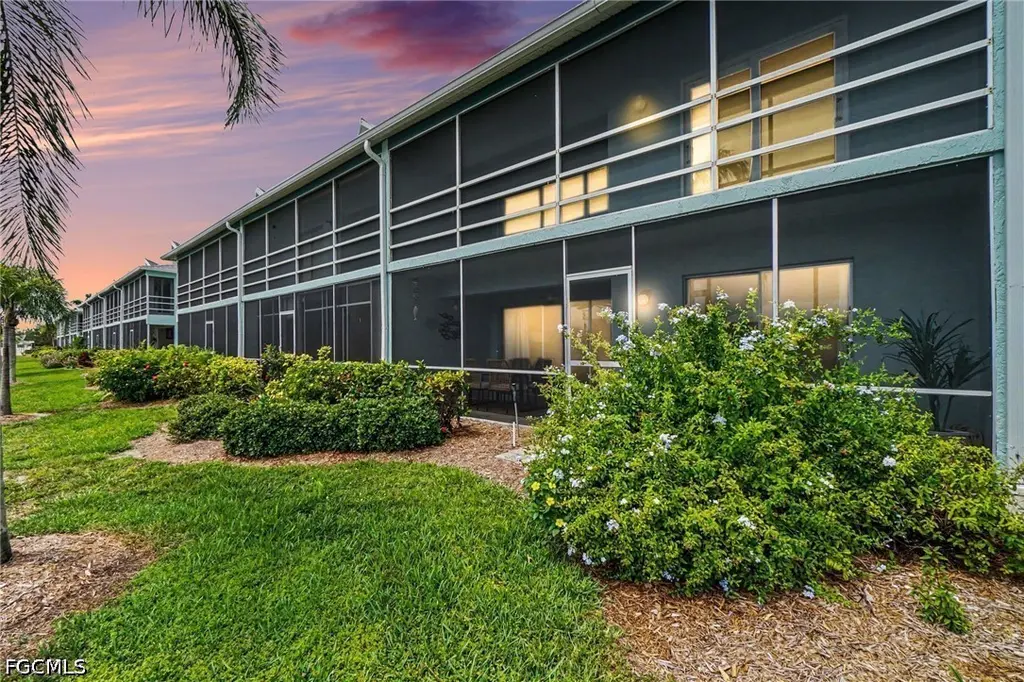
2912 Oleander St Unit B3 · St. James City, FL
Flood risk 9/10 · Severe
- FEMA flood zone
- AE
- Chance of flooding over 30 yrs
- 0.99%
- Est. flood insurance / yr
- $1,737 – $8,500
Fire risk 3/10 · Minor
- Est. fire insurance / yr
- $947 – $1,759
Heat risk 10/10 · Severe
- Hot days now (above 107°F)
- 7 days/yr
- Hot days in 30 yrs
- 28 days/yr
Wind risk 10/10 · Severe
- Chance of severe wind over 30 yrs
- 99.0%
Air-quality risk 2/10 · Minimal
- Unhealthy air days now
- 1 days/yr
- Unhealthy air days in 30 yrs
- 2 days/yr
Risk factors via First Street. Map © Google.
Why this score? — see what drove the B- grade
The composite is a weighted blend of 9 inputs, each scored 0–100. Each bar is that input's sub-score; the figure is the points it added to the 100-point composite (weight × sub-score).
- Cash flow +27.3/30.0
- 1% rule +10.0/10.0
- DSCR +9.5/10.0
- ARV discount +7.5/15.0
- Schools +4.1/10.0
- Rent growth +2.5/5.0
- Livability +2.5/5.0
- Condition / age +2.5/5.0
- Appreciation +0.0/10.0
$325,900
🖨 Deal sheet 📄 Offer letter ✓ Due diligence
Listing remarks
Wake up to shimmering waterfront views and spend your afternoons on the boat, and come home to Fisherman’s Wharf Unit B3—your perfect island retreat in the heart of St. James City. Located in the highly sought-after waterfront community of Pine Island, this coastal getaway offers the laid-back lifestyle buyers dream about, whether you’re searching for a full-time residence, seasonal escape, or income-producing investment property. Unit B3 places you right in the center of some of Southwest Florida’s best fishing and boating waters, with easy access to the Intracoastal, nearby islands, waterfront restaurants, and world-class backwater fishing. Inside, the unit is desi
Key facts
- Waterfront views
- Local marinas
- $750 HOA
Tags
Property features AI
Finance
- Other: Waterfront with canal access, navigable water and seawall; mangroves and intersecting canal; Zero lot line; Private paved road with private maintenance
- HOA & community: Homeowners association (monthly fee $750); HOA covers insurance, grounds maintenance, pest control and water; Community amenities include pool, RV/boat storage, shuffleboard court and storage; Community of 32 units; Boat facilities
Exterior
- Parking: Assigned covered parking; Detached carport (1 space); Driveway and guest parking (paved)
- Security: Fire sprinkler system; Smoke detectors
- Utilities: Public water; Public sewer; Cable available; High-speed internet available
- Home design: Single-story; Entry level: 1; Resale property; Faces west; East exposure
- Construction: Block, concrete and stucco construction; Shingle roof
- Exterior features: Lanai/porch (screened); Sprinkler/automatic irrigation; Storage; Security/high impact doors; Community pool
Interior
- Kitchen: Electric cooktop; Self-cleaning oven; Microwave; Dishwasher; Refrigerator with ice maker; Icemaker
- Bedrooms: Bedroom on main level
- Flooring: Vinyl
- Bathrooms: 2 full bathrooms
- Heating & cooling: Central heating (electric); Central air conditioning (electric); Ceiling fans
- Interior features: Furnished; Breakfast bar; Kitchen island; Open living/dining area; Family/dining room; Split bedroom floorplan; Separate shower (shower only); Single hung and sliding windows with impact glass; Screened porch
- Laundry & utility: Washer; Dryer
Neighborhood map
What this means for you Summary
Snapshot
- This is a 2-bed/2.0-bath condo listed at $326k.
Deal economics
- At list price, monthly cash flow is $520 ($6k/yr) — positive.
- The deal already cash-flows at list — no discount required.
- Meets the 1% rule at list price ($5k rent vs $326k).
- Recommended offer: $321k (1.5% below list) — sets the bar for market timing.
- Cap rate 9.8% vs local median 4.9% in St. James City — top-decile yield for the area; either an underpriced asset or a hidden risk that comps aren't pricing in. Stress-test before assuming the spread holds.
Location & tenants
- Location reads: area grade B — affects rentability + tenant quality, not the cash-flow math above.
- Lee (suburban): math 47% / reading 50% proficiency, ranked #42 of 73 in FL (top 58%) — families likely to look elsewhere, expect single-tenant / working-renter base with shorter leases.
- Market conditions: 287 active listings in the ZIP; 5 comparable units currently listed for rent nearby; rentals at typical pace (median 24d on market — plan ~3-4 weeks tenant-placement turnaround); 15,411 units permitted in Lee County in 2024 (4,686 in 5+ unit buildings).
Forward outlook
- Local home prices are declining (-3.0%/yr); year-one equity from $2k of loan paydown is wiped out by about $10k of value loss. Plan a longer hold.
- Lee County population projected at +44% by 2050 — long-run rental-demand tailwind backs the buy-and-hold thesis.
Negotiation context
- It's been on market 26 days — a 2% lower offer ($321k) is reasonable based on typical stale-listing flexibility.
- Current owner paid $57k; list at $326k implies a 473% gain — meaningful room to come down on a strong offer.
Risks & watch-outs
- Watch-outs: flood insurance adds $427/mo.
- Climate carrying-cost: in FEMA flood zone AE (mandatory federal flood insurance); severe wind risk, 99% chance of damaging wind over 30y; extreme-heat days projected 7→28/yr by 2055 (HVAC capex compounding) — expect insurance premiums to compound above CPI over the hold.
Questions for the listing agent
- What's the actual annual flood-insurance premium (NFIP or private), and is the property in a SFHA with mandatory coverage?
- What does the HOA fee cover, when was the last increase, and are there any pending special assessments or reserve-fund shortfalls?
- Any open or pending special assessments — roof, HVAC, plumbing, elevator, façade? What's the per-unit balance and payoff schedule, and is the seller paying it off at close or rolling it to the buyer?
- Is there a deadline driving the sale (1031 exchange, divorce, estate, relocation)? That informs how much negotiation room exists.
- This sits on a lake — are riparian / water-frontage rights deeded with the parcel? Any dock permits, shoreline easements, or HOA water-use restrictions?
- What's the documented flood / surge / shoreline-erosion history here (FEMA AND non-FEMA — e.g., storm surge, creek backup, septic-field saturation)?
- Any water-quality or seasonal algae-bloom issues that affect tenant satisfaction or short-term-rental demand?
- What's the average days-on-market for RENTAL listings here right now (not sales)? A rising rental-DOM trend means longer vacancies and softer asking-rent achievability than the comps imply.
- What's the recent tenant-quality profile in this submarket — average credit score on applications, eviction rate, late-payment / NSF rate, and stable-employment percentage? A property-management company in the area should have these aggregated.
- How much new apartment / multifamily construction is in the pipeline within 1–3 miles? Heavy new supply (>2% of stock underway) typically softens rents 12–24 months out; light construction supports rent growth.
Investment metrics
- 1% rule
- 1.50% ✓
- Cap rate
- 9.78%
- Cash-on-cash
- 12.45%
- DSCR
- 1.55
- GRM
- 5.6
CMA / ARV
No comps found within radius.
Projected returns pro-forma
-3.0% appreciation · 3.0% rent growth · sell at horizon
- IRR
- -5.6%
- Equity multiple
- 0.79×
- Total profit
- $-18,946
- Equity at exit
- $48,593
- IRR
- 4.3%
- Equity multiple
- 1.32×
- Total profit
- $29,163
- Equity at exit
- $28,178
Cash invested: $91,252 (down + closing). Projections, not guarantees.
Landlord ↔ Tenant lean methodology
- Overall (STATE)
- 87 Strongly Landlord-Friendly
- State Florida
- 87 Strongly Landlord-Friendly · R+3
- County
- — inherits STATE
- City
- — inherits STATE
ZIP-level market 33956
- Home prices YoY
- -16.3%
- Active inventory
- 287
- Price-to-rent
- 5.6×
Monthly cashflow live
- Estimated rent
- $4,884 medium interval (Pro) →
- Mortgage (P&I)
- −$1,709
- Tax from tax record
- −$317 /mo · $3,798/yr
- Insurance
- −$136
- Flood insurance flood zone
- −$427 /mo · $5,118/yr
- HOA
- −$750
- Vacancy / Maint / Mgmt
- −$1,026
- Net cashflow
- $520
Break-even live
UW: 25.0% down · 7.5% · 30yr · 1.5% tax · 5.0% vac · 8.0% maint · 8.0% mgmt
Financing live
Cash to close
- Down payment
- $81,475
- Closing costs
- $9,777
- Reserves months
- —
- Total cash needed
- —
Loan-product check · same deal, 3 products live
Conventional
25% down · 7.5% · 30yr
- Down + closing
- —
- Monthly P&I
- —
- Monthly cashflow
- —
- DSCR
- —
- Eligible?
- —
Personal DTI + credit; lowest rate.
DSCR
20% down · 8.5% · 30yr
- Down + closing
- —
- Monthly P&I
- —
- Monthly cashflow
- —
- DSCR
- —
- Eligible?
- —
No personal income docs; deal must DSCR.
Hard money
10% down · 12.0% · 12mo
- Down + closing
- —
- Monthly P&I
- —
- Monthly cashflow
- —
- DSCR
- —
- Eligible?
- —
Short-term bridge; refi at stabilization.
Rent comps 5 comps
| Address | Beds | Baths | Sqft | Rent | $/sqft | DOM | Units | Dist |
|---|---|---|---|---|---|---|---|---|
| 2951 York Rd Saint James City, FL | 2.0 | 2.0 | 1444 | $5,500 | $3.81 | 23d | 1 | 0.13mi |
| 3103 Harpoon Ln Saint James City, FL | 2.0 | 2.0 | 1094 | $3,000 | $2.74 | 23d | 1 | 0.38mi |
| 2744 Sanderling Ct Saint James City, FL | 2.0 | 1.0 | 841 | $5,300 | $6.30 | 23d | 1 | 0.41mi |
| 3864 Royal Palm Dr Saint James City, FL | 2.0 | 1.0 | 960 | $1,650 | $1.72 | 23d | 1 | 0.46mi |
| 3811 Emerald Ave Saint James City, FL | 3.0 | 2.5 | 1500 | $5,500 | $3.67 | 23d | 1 | 0.72mi |
HOA detail condo
- Monthly dues
- $750 · $9,000/yr
- Likely covers
- water
- Assessments
- None detected in remarks — confirm with the listing agent.
Listing history 14 events
-
2026-06-17days on market $325,900 Active 26 DOM
-
2026-06-16days on market $325,900 Active 25 DOM
-
2026-06-15days on market $325,900 Active 24 DOM
-
2026-06-13days on market $325,900 Active 22 DOM
-
2026-06-10days on market $325,900 Active 19 DOM
-
2026-06-09days on market $325,900 Active 18 DOM
-
2026-06-08days on market $325,900 Active 17 DOM
-
2026-06-07days on market $325,900 Active 16 DOM
-
2026-06-03days on market $325,900 Active 12 DOM
-
2026-06-02days on market $325,900 Active 11 DOM
-
2026-06-01days on market $325,900 Active 10 DOM
-
2026-05-31days on market $325,900 Active 9 DOM
-
2026-05-16$325,900 Active
-
1983-05-01soldstatus $56,900
ⓘ Source: listings_history table (triggers on properties + properties_extension) + one-shot
backfill from property_details.listing_events for pre-trigger history.
Tax reassessment forecast FL · Resets to sale price
- Current annual tax
- $3,798 · $317/mo
- Projected year-2 tax
- $3,798 · $317/mo
- Expected delta
- $0/yr ($0/mo · 0.0%)
ⓘ Screening estimate from a state-policy table — verify with the county assessor before closing.
Climate risk First Street
- Flood 9/10 Extreme FEMA zone AE · 99% chance over 30 yrs
- Wildfire 3/10 Moderate
- Heat 10/10 Extreme 7 d/yr ≥107°F today · 28 d/yr by 30 yrs out
- Wind 10/10 Extreme 99% chance of damaging wind over 30 yrs
- Air quality 2/10 Low 1 unhealthy d/yr today · 2 by 30 yrs out
Nearby sold comps map
Loading sold comps map…
Walkable amenities ~0.75 mi
Loading nearby amenities…
Taxation est. · year 1
- Rental income
- $58,602
- − Mortgage interest
- −$18,255
- − Property taxes
- −$3,798
- − Insurance
- −$6,748
- − Repairs & maintenance
- −$4,688
- − Management
- −$4,688
- − HOA
- −$9,000
- − Depreciation
- −$9,481
- Taxable income
- $1,943
- Est. tax owed @ 24.0%
- −$466
- After-tax cash flow
- $5,774/yr
For passive investors: Depreciation is non-cash, so a rental often shows a tax loss while cash-flowing — sheltering income. Rental losses are passive: they offset passive income freely, and up to $25,000/yr can offset ordinary (W-2) income if you actively participate and your MAGI is under $100k (phasing out to $0 by $150k); unused losses carry forward. On sale, claimed depreciation is recaptured at up to 25%, and gains may owe capital-gains tax (a 1031 exchange can defer both). Figures are a year-1 estimate at your 24.0% rate — not tax advice; consult a CPA.
Schools (NCES district)
- District
- Lee
- NCES district ID
- 1201080
- Math proficiency
- 47% ▼ -11.00%
- Reading proficiency
- 50% ▼ -4.00%
- Median HH income
- $49,518
- Composite
- 41.49/100
- National rank
- #3458
- State rank
- #42 of 73 in FL
Livability — St. James City
No livability data for this city. (Only ~50 U.S. cities are tracked.)
Census & demographics
- Census place
- St. James City, FL
- Population (ZIP)
- 3,846
Population outlook (Lee County) Hauer SSP2
- Today (2025)
- 871,946 people
- By 2030
- 955,468 · +9.6%
- By 2040
- 1,113,587 · +27.7%
- By 2050
- 1,256,891 · +44.1%
- By 2075
- 1,560,270 · +78.9%
- By 2100
- 1,726,848 · +98.0%
Race, ethnicity, and origin ACS 2023
- Neighborhood character
- Predominantly White (94%)
- Race & ethnicity
- White 94% Two or more races 3% Pacific Islander 2% Hispanic / Latino 1%
- Common ancestry
- Romanian 6% Slovak 4% Iranian 3%
- Foreign-born
- 5% · Canada
- Languages at home
- 95% English-only · French/Haitian/Cajun 2% German/W. Germanic 2% Russian/Polish/Slavic 1%
Political lean MEDSL · Lee
- 2024 margin
- Strong R (+28.4) · D 35.5% · R 63.9%
- 2008→2024 swing
- -18.0pp toward R · 2008: -10.4pp · 2024: -28.4pp
- All cycles
- 2024: R+28.4 2020: R+19.2 2016: R+20.4 2012: R+16.6 2008: R+10.4
Not yet ingested
- Civics
- —
Market trends
- HPI YoY
- ▼ -58.47%
- Current HPI
- 300.1416
- Rent YoY
- —
- Metro
- —
- State GDP YoY
- ▲ 3.28%
- F500 in state
- 36
Industry mix (Fortune 500 HQ in FL)
| Industry | F500 HQs | Revenue |
|---|---|---|
| Industrial Technology | 2 | $29B |
|
||
| Insurance | 2 | $17B |
|
||
| Retail | 1 | $60B |
|
||
| Technology Distribution | 1 | $58B |
|
||
| Homebuilding | 1 | $35B |
|
||
| Technology Manufacturing | 1 | $35B |
|
||
Price history
+472.8% since first listed2 events — show timeline
- 2026-05-16 Listed $325,900 FORTMLS
- 1983-05-01 Sold (Public Records) $56,900 Public Records
Property tax history
+6.8%/yrLatest (2025): $3,798 · +7.8% YoY. Source: county tax records.
Cash-flow waterfall
monthlySold comps — $/sqft
last 12 mo · ≤1 miLoading sold comps…