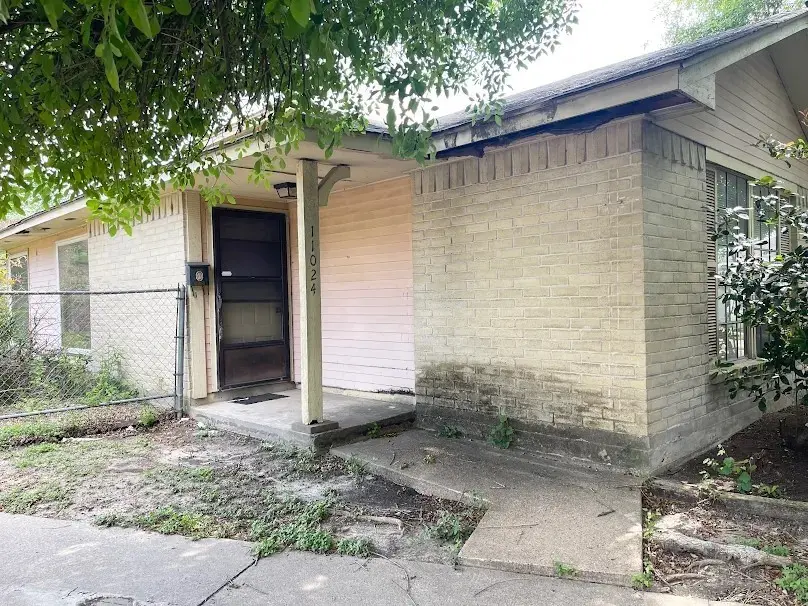
11024 Tridens Ct · Houston, TX
Flood risk 1/10 · Minimal
- FEMA flood zone
- X (unshaded)
- Chance of flooding over 30 yrs
- 0.0%
- Est. flood insurance / yr
- $507 – $1,088
Fire risk 1/10 · Minimal
- Est. fire insurance / yr
- $1,222 – $2,270
Heat risk 9/10 · Severe
- Hot days now (above 110°F)
- 7 days/yr
- Hot days in 30 yrs
- 23 days/yr
Wind risk 8/10 · Major
- Chance of severe wind over 30 yrs
- 99.0%
Air-quality risk 3/10 · Minor
- Unhealthy air days now
- 3 days/yr
- Unhealthy air days in 30 yrs
- 4 days/yr
Risk factors via First Street. Map © Google.
Why this score? — see what drove the C grade
The composite is a weighted blend of 9 inputs, each scored 0–100. Each bar is that input's sub-score; the figure is the points it added to the 100-point composite (weight × sub-score).
- Cash flow +18.1/30.0
- ARV discount +14.7/15.0
- Appreciation +5.8/10.0
- DSCR +5.7/10.0
- 1% rule +5.5/10.0
- Livability +3.7/5.0
- Condition / age +2.5/5.0
- Rent growth +2.2/5.0
- Schools +1.5/10.0
$130,000
🖨 Deal sheet 📄 Offer letter ✓ Due diligence
Listing remarks
This quaint 2 bedroom, 2 bath home has a great backyard with no backneighbors! It is an opportunity to update this property to make it your own! The primary bedroom has an en-suite bathroom with double sinks and two walk in closets. There is plenty of natural light from the large windows in the living room and kitchen dining area. Conveniently situated near Beltway 8 and Highway 249, with an easy 24-minute commute to Downtown.
Key facts
- Near highway 249
- Near beltway 8
- Open backyard
Tags
Property features AI
Finance
- Other: Lease not considered
- HOA & community: Sterling ASI homeowner association; Annual association fee of $180
Exterior
- Parking: Detached garage (1 car)
- Utilities: Public water; Public sewer
- Home design: Residential property; Entry level: First floor
- Construction: Built in 1981; Wood siding; Composition roof; Slab foundation
- Exterior features: Fenced backyard; Cul-de-sac lot
Interior
- Kitchen: Kitchen on the first floor
- Bedrooms: 2 bedrooms (both on the first floor)
- Flooring: Carpet
- Bathrooms: 2 full bathrooms (both on the first floor); Primary bathroom on the first floor
- Heating & cooling: Central heating (gas); Central electric air conditioning
- Interior features: Double vanity; High ceilings; Tub/shower combination; Ceiling fan(s)
- Laundry & utility: Washer hookup; Electric dryer hookup
Neighborhood map
What this means for you Summary
Snapshot
- This is a 2-bed/2.0-bath townhouse listed at $130k.
Deal economics
- At list price, monthly cash flow is $115 ($1k/yr) — positive.
- The deal already cash-flows at list — no discount required.
- Meets the 1% rule at list price ($1k rent vs $130k).
- Recommended offer: $128k (1.5% below list) — sets the bar for market timing.
- Cap rate 7.4% vs local median 3.2% in Houston — top-decile yield for the area; either an underpriced asset or a hidden risk that comps aren't pricing in. Stress-test before assuming the spread holds.
Location & tenants
- Location reads 74/100 on livability (#184 in TX, #4,771 nationally) — a middle-class / working-renter tenant base. Strengths: amenities A+, cost of living A+, housing A+; Watch: crime F.
- Aldine ISD (suburban): math 16% / reading 21% proficiency, ranked #790 of 826 in TX (top 96%) — low school quality limits family demand, transient renter base, plan for 1-2y turnover; 79% free/reduced lunch — lower-income household profile, screen leases tightly.
- Zoned schools: Carmichael El (math 31% / reading 30%, grade F, #2,464 of 4,322 statewide, top 58%, 621 students, 96% FRL); Shotwell Middle (math 14% / reading 23%, grade F, #1,478 of 1,662 statewide, top 90%, 1,078 students, 92% FRL).
- Market conditions: Rents soft (-1.2%/yr); 79 active listings in the ZIP; 17 comparable units currently listed for rent nearby; rentals at typical pace (median 20d on market — plan ~3-4 weeks tenant-placement turnaround); 29,883 units permitted in Harris County in 2024 (8,621 in 5+ unit buildings).
Forward outlook
- In year one you build about $3k of equity ($899 loan paydown + $2k appreciation (1.6% local appreciation)).
- Harris County population projected at +47% by 2050 — long-run rental-demand tailwind backs the buy-and-hold thesis.
- At projected returns (1.6% appreciation + 0.0% rent growth), your $36k cash investment doubles in ~9 years — after that, you're playing with house money.
Negotiation context
- It's been on market 16 days — a 2% lower offer ($128k) is reasonable based on typical stale-listing flexibility.
Risks & watch-outs
- Climate carrying-cost: severe wind risk, 99% chance of damaging wind over 30y; extreme-heat days projected 7→23/yr by 2055 (HVAC capex compounding) — expect insurance premiums to compound above CPI over the hold.
Questions for the listing agent
- What does the HOA fee cover, when was the last increase, and are there any pending special assessments or reserve-fund shortfalls?
- Is there a deadline driving the sale (1031 exchange, divorce, estate, relocation)? That informs how much negotiation room exists.
- Schools are D-rated, which usually means shorter tenancies and higher turnover. Who's the typical renter profile here, and what's been the actual vacancy rate?
- Crime grade is F in this area — have there been break-ins, vandalism, or insurance claims at this property in the last 3 years? What carrier currently insures it and at what premium?
- What's the average days-on-market for RENTAL listings here right now (not sales)? A rising rental-DOM trend means longer vacancies and softer asking-rent achievability than the comps imply.
- What's the recent tenant-quality profile in this submarket — average credit score on applications, eviction rate, late-payment / NSF rate, and stable-employment percentage? A property-management company in the area should have these aggregated.
- How much new for-sale + rental construction is in the pipeline within 1–3 miles? Heavy new supply typically softens prices + rents 12–24 months out; constrained supply supports both.
Investment metrics
- 1% rule
- 1.05% ✓
- Cap rate
- 7.36%
- Cash-on-cash
- 3.80%
- DSCR
- 1.17
- GRM
- 7.9
CMA / ARV
- ARV (on-the-fly)
- $154,632
- Comps found
- 6
Show comp detail 6 sales within ~0.75 mi
| Address | Dist | Beds/Ba | Sqft | Sold | Price | $/sf | Match |
|---|---|---|---|---|---|---|---|
| 11024 Tridens Ct | 0.00mi | 2/2.0 | 1,137 (0%) | 1mo | $130,000 | $114 | 99 |
| 11007 Crinkleawn Dr | 0.09mi | 2/2.0 | 1,137 (0%) | 5mo | $130,000 | $114 | 92 |
| 11017 Tridens Ct | 0.04mi | 2/2.0 | 1,137 (0%) | 12mo | $164,000 | $144 | 88 |
| 11012 Crenchrus Ct | 0.07mi | 2/1.0 | 993 (-13%) | 1mo | $135,000 | $136 | 71 |
| 11006 Crinkleawn Dr | 0.07mi | 2/1.0 | 976 (-14%) | 5mo | $155,000 | $159 | 65 |
| 11016 Tanglehead Ct | 0.19mi | 3/2.0 (+1) | 1,215 (+7%) | 18mo | $148,000 | $122 | 60 |
Match score weights: distance 35% · size 25% · config 20% · recency 20%. Top-matched comps best support the ARV.
Projected returns pro-forma
1.6% appreciation · 0.0% rent growth · sell at horizon
- IRR
- 5.1%
- Equity multiple
- 1.27×
- Total profit
- $9,681
- Equity at exit
- $48,478
- IRR
- 7.2%
- Equity multiple
- 1.88×
- Total profit
- $31,935
- Equity at exit
- $67,720
Cash invested: $36,400 (down + closing). Projections, not guarantees.
Landlord ↔ Tenant lean methodology
- Overall (STATE)
- 87 Strongly Landlord-Friendly
- State Texas
- 87 Strongly Landlord-Friendly · R+5
- County
- — inherits STATE
- City
- — inherits STATE
ZIP-level market 77086
- Home prices YoY
- 0.6%
- Rents YoY
- -1.2%
- Active inventory
- 79
- Price-to-rent
- 7.9×
Monthly cashflow live
- Estimated rent
- $1,366 high interval (Pro) →
- Mortgage (P&I)
- −$682
- Tax from tax record
- −$213 /mo · $2,556/yr
- Insurance
- −$54
- HOA
- −$15
- Vacancy / Maint / Mgmt
- −$287
- Net cashflow
- $115
Break-even live
UW: 25.0% down · 7.5% · 30yr · 1.5% tax · 5.0% vac · 8.0% maint · 8.0% mgmt
Financing live
Cash to close
- Down payment
- $32,500
- Closing costs
- $3,900
- Reserves months
- —
- Total cash needed
- —
Loan-product check · same deal, 3 products live
Conventional
25% down · 7.5% · 30yr
- Down + closing
- —
- Monthly P&I
- —
- Monthly cashflow
- —
- DSCR
- —
- Eligible?
- —
Personal DTI + credit; lowest rate.
DSCR
20% down · 8.5% · 30yr
- Down + closing
- —
- Monthly P&I
- —
- Monthly cashflow
- —
- DSCR
- —
- Eligible?
- —
No personal income docs; deal must DSCR.
Hard money
10% down · 12.0% · 12mo
- Down + closing
- —
- Monthly P&I
- —
- Monthly cashflow
- —
- DSCR
- —
- Eligible?
- —
Short-term bridge; refi at stabilization.
Rent comps 17 comps
| Address | Beds | Baths | Sqft | Rent | $/sqft | DOM | Units | Dist |
|---|---|---|---|---|---|---|---|---|
| 11008 Panicum Ct Houston, TX | 3.0 | 2.0 | 1238 | $1,488 | $1.20 | 43d | 1 | 0.13mi |
| 3435 Creek Grove Dr Houston, TX | 3.0 | 3.0 | 1492 | $1,725 | $1.16 | 43d | 1 | 0.78mi |
| 132 Seton Lake Dr Houston, TX | 1.0 | 1.0 | 700 | $889 | $1.27 | 43d | 1 | 0.95mi |
| 7703 Seton Lake Dr Houston, TX | 1.0–2.0 | 1.0 | 650 | $1,210 | $1.86 | 2d | 15 | 1.10mi |
| 11201 Veterans Memorial Dr Unit 2174 Houston, TX | 2.0 | 2.0 | 1158 | $1,313 | $1.13 | 2d | 1 | 1.32mi |
| 11201 Veterans Memorial Dr Unit 11258 Houston, TX | 2.0 | 2.0 | 1117 | $1,306 | $1.17 | 43d | 1 | 1.32mi |
| 11201 Veterans Memorial Dr Unit 2162 Houston, TX | 2.0 | 2.0 | 1158 | $1,321 | $1.14 | 7d | 1 | 1.32mi |
| 11201 Veterans Memorial Dr Unit 3174 Houston, TX | 3.0 | 2.0 | 1251 | $1,525 | $1.22 | 2d | 1 | 1.32mi |
| 11201 Veterans Memorial Dr Unit 11234 Houston, TX | 3.0 | 2.0 | 1251 | $1,522 | $1.22 | 43d | 1 | 1.32mi |
| 11207 Veterans Memorial Dr Houston, TX | 2.0 | 2.0 | 1158 | $1,143 | $0.99 | 43d | 1 | 1.35mi |
| 11207 Veterans Memorial Dr Houston, TX | 2.0 | 2.0 | 1158 | $1,143 | $0.99 | 24d | 1 | 1.35mi |
| 11207 Veterans Memorial Dr Houston, TX | 3.0 | 2.0 | 1289 | $1,299 | $1.01 | 20d | 1 | 1.35mi |
| 12752 N Houston Rosslyn Rd Houston, TX | 1.0–3.0 | 1.0–2.0 | 922 | $1,598 | $1.73 | 1d | 13 | 1.42mi |
| 7100 Smiling Woods Ln Houston, TX | 2.0 | 2.0 | 1039 | $1,314 | $1.26 | 17d | 1 | 1.49mi |
| 7100 Smiling Woods Ln Houston, TX | 1.0–2.0 | 1.0–2.0 | 821 | $1,347 | $1.64 | 1d | 25 | 1.49mi |
| 7100 Smiling Woods Ln Houston, TX | 1.0 | 1.0 | 800 | $981 | $1.23 | 19d | 1 | 1.49mi |
| 7150 Smiling Woods Ln Houston, TX | 1.0–2.0 | 1.0–2.0 | 797 | $1,383 | $1.74 | 1d | 13 | 1.49mi |
HOA detail
- Monthly dues
- $15 · $180/yr
Listing history 5 events
-
2026-04-25status Pending
-
2026-04-21status Pending
-
2026-04-09$130,000 Active
-
1999-03-31soldstatus
-
1999-03-30soldstatus
ⓘ Source: listings_history table (triggers on properties + properties_extension) + one-shot
backfill from property_details.listing_events for pre-trigger history.
Tax reassessment forecast TX · Resets to sale price
- Current annual tax
- $2,556 · $213/mo
- Projected year-2 tax
- $2,556 · $213/mo
- Expected delta
- $0/yr ($0/mo · 0.0%)
ⓘ Screening estimate from a state-policy table — verify with the county assessor before closing.
Climate risk First Street
- Flood 1/10 Low FEMA zone X (unshaded) · 0% chance over 30 yrs
- Wildfire 1/10 Low
- Heat 9/10 Extreme 7 d/yr ≥110°F today · 23 d/yr by 30 yrs out
- Wind 8/10 Severe 99% chance of damaging wind over 30 yrs
- Air quality 3/10 Moderate 3 unhealthy d/yr today · 4 by 30 yrs out
Nearby sold comps map
Loading sold comps map…
Walkable amenities ~0.75 mi
Loading nearby amenities…
Taxation est. · year 1
- Rental income
- $16,393
- − Mortgage interest
- −$7,282
- − Property taxes
- −$2,556
- − Insurance
- −$650
- − Repairs & maintenance
- −$1,311
- − Management
- −$1,311
- − HOA
- −$180
- − Depreciation
- −$3,782
- Taxable loss
- −$680
- Est. tax savings @ 24.0%
- +$163
- After-tax cash flow
- $1,546/yr
For passive investors: Depreciation is non-cash, so a rental often shows a tax loss while cash-flowing — sheltering income. Rental losses are passive: they offset passive income freely, and up to $25,000/yr can offset ordinary (W-2) income if you actively participate and your MAGI is under $100k (phasing out to $0 by $150k); unused losses carry forward. On sale, claimed depreciation is recaptured at up to 25%, and gains may owe capital-gains tax (a 1031 exchange can defer both). Figures are a year-1 estimate at your 24.0% rate — not tax advice; consult a CPA.
Schools (NCES district)
- District
- Aldine ISD
- NCES district ID
- 4807710
- Math proficiency
- 16% ▼ -23.00%
- Reading proficiency
- 21% ▼ -11.00%
- Median HH income
- $37,081
- Composite
- 15.42/100
- National rank
- #9317
- State rank
- #790 of 826 in TX
Livability — Houston
- Score
- 74/100
- State rank
- #184
- US rank
- #4771
Category grades
Schools grade is shown separately in the Schools card above.
Census & demographics
- County
- Harris County · 4,702,590 people
- City population
- 3,226,434
- Metro
- Houston-The Woodlands-Sugar Land, TX
- Population (ZIP)
- 28,653
- Household income
- $58,200
- Rent vs Own
- Severe rent burden
- 1323.0
Population outlook (Harris County) Hauer SSP2
- Today (2025)
- 5,571,493 people
- By 2030
- 6,089,821 · +9.3%
- By 2040
- 7,142,806 · +28.2%
- By 2050
- 8,185,864 · +46.9%
- By 2075
- 10,574,329 · +89.8%
- By 2100
- 12,109,958 · +117.4%
Race, ethnicity, and origin ACS 2023
- Neighborhood character
- Diverse neighborhood (Simpson 0.55)
- Race & ethnicity
- Hispanic / Latino 63% Two or more races 26% Black 19% Asian 9% White 7%
- Hispanic origin (detail)
- Mexican 47%
- Common ancestry
- Slovak 1%
- Foreign-born
- 34% · Canada, Vietnam
- Languages at home
- 38% English-only · Spanish 54% Vietnamese 6% Other Asian/Pacific 1%
Political lean MEDSL · Harris
- 2024 margin
- Lean D (+5.5) · D 52.0% · R 46.4% · Other 1.6%
- 2008→2024 swing
- +3.9pp toward D · 2008: 1.6pp · 2024: 5.5pp
- All cycles
- 2024: D+5.5 2020: D+13.3 2016: D+12.4 2012: D+0.1 2008: D+1.6
Not yet ingested
- Civics
- —
Market trends
- HPI YoY
- ▲ 1.60%
- Current HPI
- 281.0065
- Rent YoY
- ▼ -1.19%
- Metro
- Houston-The Woodlands-Sugar Land, TX
- State GDP YoY
- ▲ 3.95%
- F500 in state
- 110
Industry mix (Fortune 500 HQ in TX)
| Industry | F500 HQs | Revenue |
|---|---|---|
| Energy | 16 | $1,198B |
|
||
| Technology | 5 | $198B |
|
||
| Engineering / Construction | 4 | $72B |
|
||
| Energy Services | 3 | $60B |
|
||
| Utilities | 3 | $41B |
|
||
| Healthcare | 2 | $330B |
|
||
Price history
5 events — show timeline
- 2026-04-25 Pending — HARMLS
- 2026-04-21 Pending — HARMLS
- 2026-04-09 Listed $130,000 HARMLS
- 1999-03-31 Sold (Public Records) — Public Records
- 1999-03-30 Sold (Public Records) — Public Records
Property tax history
+6.6%/yrLatest (2025): $2,556 · +21.1% YoY. Source: county tax records.
Cash-flow waterfall
monthlySold comps — $/sqft
last 12 mo · ≤1 miLoading sold comps…