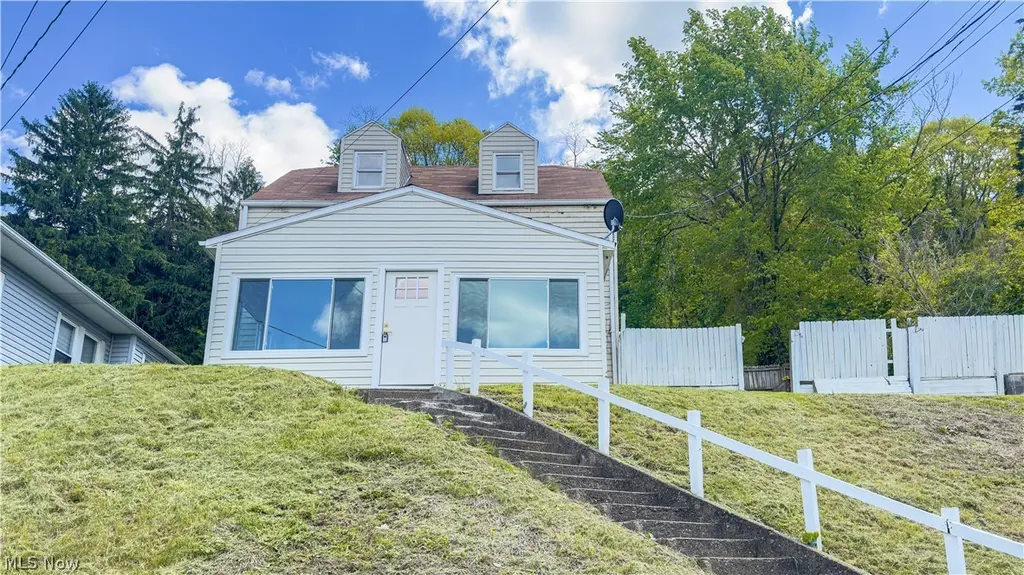
863 Highland St · Follansbee, WV
Flood risk 1/10 · Minimal
- FEMA flood zone
- X (unshaded)
- Chance of flooding over 30 yrs
- 0.0%
- Est. flood insurance / yr
- $473 – $860
Fire risk 1/10 · Minimal
- Est. fire insurance / yr
- $787 – $1,461
Heat risk 3/10 · Minor
- Hot days now (above 97°F)
- 7 days/yr
- Hot days in 30 yrs
- 17 days/yr
Wind risk 1/10 · Minimal
- Chance of severe wind over 30 yrs
- —
Air-quality risk 2/10 · Minimal
- Unhealthy air days now
- 1 days/yr
- Unhealthy air days in 30 yrs
- 2 days/yr
Risk factors via First Street. Map © Google.
Why this score? — see what drove the B- grade
The composite is a weighted blend of 9 inputs, each scored 0–100. Each bar is that input's sub-score; the figure is the points it added to the 100-point composite (weight × sub-score).
- Cash flow +24.2/30.0
- ARV discount +15.0/15.0
- DSCR +7.8/10.0
- 1% rule +5.9/10.0
- Appreciation +4.8/10.0
- Livability +3.6/5.0
- Schools +2.6/10.0
- Rent growth +2.5/5.0
- Condition / age +2.5/5.0
$114,900
🖨 Deal sheet 📄 Offer letter ✓ Due diligence
Listing remarks
Welcome to 863 Highland St in Follansbee — a move-in ready 4-bedroom home with over 1,900 sq. ft. of above-ground living space and a long list of updates already completed for you! Even better, the street itself has also been freshly repaved, giving the home an even more polished first impression. Inside, you’ll find all new flooring and light fixtures throughout, a brand new Concord furnace, new water heater, updated windows, and a beautifully remodeled kitchen featuring new cabinets, countertops, and appliances including the range, dishwasher, and microwave. The oversized eat-in dining area offers plenty of space for everyday living, gatherings, or hosting friends and family.
Key facts
- New furnace
- Updated windows
- New flooring
Tags
Property features AI
Finance
- Other: Above-grade finished area reported as 1,918 (source: assessor)
Exterior
- Parking: No garage; on-street parking
- Utilities: Public water; Public sewer; Gas for heating
- Home design: 3-story home; Faces southwest; Vinyl siding
- Construction: Built (year per assessor); Vinyl siding construction; Asphalt/fiberglass shingle roof
- Exterior features: Deck; Fire pit; Partial wood fencing; Property on a hill with rolling slope; Views; Dead-end street
Interior
- Kitchen: Eat-in kitchen (large; approx. 24.9 x 12.7)
- Bedrooms: Bedroom #1 on first level (approx. 12.1 x 12.9); Bedroom #2 on second level (approx. 18.7 x 12.1); Bedroom #3 on second level (approx. 8.3 x 10.5); Bedroom #4 on third level with walk-in closet (approx. 19.5 x 15.5)
- Flooring: Carpet in at least one bedroom; Concrete in laundry room
- Bathrooms: 1 full bathroom (second level, approx. 13.6 x 4.3)
- Heating & cooling: Forced air heating (gas)
- Interior features: Eat-in kitchen; Recessed lighting
- Laundry & utility: Main level laundry room (concrete flooring)
Neighborhood map
What this means for you Summary
Snapshot
- This is a 3-bed/1.0-bath single-family listed at $115k.
Deal economics
- At list price, monthly cash flow is $230 ($3k/yr) — positive.
- The deal already cash-flows at list — no discount required.
- Meets the 1% rule at list price ($1k rent vs $115k).
- Recommended offer: $111k (3.0% below list) — sets the bar for market timing.
Location & tenants
- Location reads 72/100 on livability (#49 in WV) — a middle-class / working-renter tenant base. Strengths: crime A+, commute A+, cost of living A+; Watch: schools D+, amenities F, employment D-.
- Brooke County Schools (rural): math 26% / reading 35% proficiency, ranked #26 of 55 in WV (top 47%) — families likely to look elsewhere, expect single-tenant / working-renter base with shorter leases.
- Market conditions: 24 active listings in the ZIP; 2 units permitted in Brooke County in 2024 (0 in 5+ unit buildings).
Forward outlook
- In year one you build about $401 of equity ($794 loan paydown + $-393 appreciation (-0.3% local appreciation)).
- Brooke County population projected at -19% by 2050 — secular population decline; favor cash flow + early exit over multi-decade hold.
- At projected returns (-0.3% appreciation + 3.0% rent growth), your $32k cash investment doubles in ~8 years — after that, you're playing with house money.
Negotiation context
- It's been on market 47 days — a 3% lower offer ($111k) is reasonable based on typical stale-listing flexibility.
- 3 sale attempts with the ask held roughly flat each time — persistent listings suggest the price (not the market) is what's stuck; bring a comps-based counter.
- Current owner paid $44k; list at $115k implies a 159% gain — meaningful room to come down on a strong offer.
Risks & watch-outs
- Watch-outs: built in 1940 — expect roof / HVAC / electrical / plumbing capex.
Questions for the listing agent
- It's been on market 47 days. Have you received any prior offers? Is the seller open to a 3% concession, seller financing, or rate buy-down credit?
- Built in 1940 — when were the roof, HVAC, electrical panel, plumbing, and water heater last replaced?
- Is there a deadline driving the sale (1031 exchange, divorce, estate, relocation)? That informs how much negotiation room exists.
- Schools are D-rated, which usually means shorter tenancies and higher turnover. Who's the typical renter profile here, and what's been the actual vacancy rate?
- What's the average days-on-market for RENTAL listings here right now (not sales)? A rising rental-DOM trend means longer vacancies and softer asking-rent achievability than the comps imply.
- What's the recent tenant-quality profile in this submarket — average credit score on applications, eviction rate, late-payment / NSF rate, and stable-employment percentage? A property-management company in the area should have these aggregated.
- How much new for-sale + rental construction is in the pipeline within 1–3 miles? Heavy new supply typically softens prices + rents 12–24 months out; constrained supply supports both.
Investment metrics
- 1% rule
- 1.09% ✓
- Cap rate
- 8.70%
- Cash-on-cash
- 8.58%
- DSCR
- 1.38
- GRM
- 7.7
CMA / ARV
- ARV (on-the-fly)
- $155,358
- Comps found
- 8
Show comp detail 8 sales within ~0.75 mi
| Address | Dist | Beds/Ba | Sqft | Sold | Price | $/sf | Match |
|---|---|---|---|---|---|---|---|
| 304 Overlook Dr | 0.22mi | 3/2.0 | 1,760 (-8%) | 12mo | $139,999 | $80 | 62 |
| 111 4th St | 0.27mi | 3/2.5 | 1,860 (-3%) | 20mo | $205,000 | $110 | 60 |
| 766 Clifton St | 0.11mi | 3/2.0 | 1,736 (-10%) | 22mo | $72,000 | $41 | 57 |
| 1321 Main St | 0.53mi | 3/1.5 | 1,848 (-4%) | 15mo | $150,000 | $81 | 54 |
| ***1608 Allegheny St | 0.43mi | 3/2.0 | 1,776 (-7%) | 19mo | $73,000 | $41 | 48 |
| 232 Vine St | 0.38mi | 4/1.0 (+1) | 1,691 (-12%) | 13mo | $155,500 | $92 | 46 |
| 103 Pine St | 0.71mi | 3/2.0 | 2,095 (+9%) | 7mo | $135,000 | $64 | 42 |
| 826 Gilbert Ave | 0.50mi | 3/2.5 | 1,721 (-10%) | 17mo | $162,000 | $94 | 39 |
Match score weights: distance 35% · size 25% · config 20% · recency 20%. Top-matched comps best support the ARV.
Projected returns pro-forma
-0.34% appreciation · 3.0% rent growth · sell at horizon
- IRR
- 6.3%
- Equity multiple
- 1.29×
- Total profit
- $9,457
- Equity at exit
- $31,410
- IRR
- 11.8%
- Equity multiple
- 2.25×
- Total profit
- $40,123
- Equity at exit
- $36,230
Cash invested: $32,172 (down + closing). Projections, not guarantees.
Landlord ↔ Tenant lean methodology
- Overall (STATE)
- 83 Strongly Landlord-Friendly
- State West Virginia
- 83 Strongly Landlord-Friendly · R+22
- County
- — inherits STATE
- City
- — inherits STATE
ZIP-level market 26037
- Home prices YoY
- -0.2%
- Active inventory
- 24
- Price-to-rent
- 7.7×
Monthly cashflow live
- Estimated rent
- $1,249 medium interval (Pro) →
- Mortgage (P&I)
- −$603
- Tax from tax record
- −$106 /mo · $1,270/yr
- Insurance
- −$48
- HOA
- −$0
- Vacancy / Maint / Mgmt
- −$262
- Net cashflow
- $230
Break-even live
UW: 25.0% down · 7.5% · 30yr · 1.5% tax · 5.0% vac · 8.0% maint · 8.0% mgmt
Financing live
Cash to close
- Down payment
- $28,725
- Closing costs
- $3,447
- Reserves months
- —
- Total cash needed
- —
Loan-product check · same deal, 3 products live
Conventional
25% down · 7.5% · 30yr
- Down + closing
- —
- Monthly P&I
- —
- Monthly cashflow
- —
- DSCR
- —
- Eligible?
- —
Personal DTI + credit; lowest rate.
DSCR
20% down · 8.5% · 30yr
- Down + closing
- —
- Monthly P&I
- —
- Monthly cashflow
- —
- DSCR
- —
- Eligible?
- —
No personal income docs; deal must DSCR.
Hard money
10% down · 12.0% · 12mo
- Down + closing
- —
- Monthly P&I
- —
- Monthly cashflow
- —
- DSCR
- —
- Eligible?
- —
Short-term bridge; refi at stabilization.
Listing history 21 events
-
2026-06-19days on market $114,900 Active 47 DOM
-
2026-06-18days on market $114,900 Active 46 DOM
-
2026-06-17days on market $114,900 Active 45 DOM
-
2026-06-16days on market $114,900 Active 44 DOM
-
2026-06-15days on market $114,900 Active 43 DOM
-
2026-06-14days on market $114,900 Active 41 DOM
-
2026-06-12days on market $114,900 Active 40 DOM
-
2026-06-09days on market $114,900 Active 37 DOM
-
2026-06-08days on market $114,900 Active 36 DOM
-
2026-06-07days on market $114,900 Active 35 DOM
-
2026-06-05days on market $114,900 Active 32 DOM
-
2026-06-02days on market $114,900 Active 30 DOM
-
2026-06-01days on market $114,900 Active 29 DOM
-
2026-05-31days on market $114,900 Active 28 DOM
-
2026-05-30days on market $114,900 Active 27 DOM
-
2026-05-14status Active
-
2026-05-09historical Contingent
-
2026-05-03$114,900 Active
-
2026-04-25historical
-
2026-01-16$125,000 Active
-
2001-11-01soldstatus $44,290
ⓘ Source: listings_history table (triggers on properties + properties_extension) + one-shot
backfill from property_details.listing_events for pre-trigger history.
Tax reassessment forecast WV · Resets to sale price
- Current annual tax
- $1,270 · $106/mo
- Projected year-2 tax
- $1,270 · $106/mo
- Expected delta
- $0/yr ($0/mo · 0.0%)
ⓘ Screening estimate from a state-policy table — verify with the county assessor before closing.
Climate risk First Street
- Flood 1/10 Low FEMA zone X (unshaded) · 0% chance over 30 yrs
- Wildfire 1/10 Low
- Heat 3/10 Moderate 7 d/yr ≥97°F today · 17 d/yr by 30 yrs out
- Wind 1/10 Low
- Air quality 2/10 Low 1 unhealthy d/yr today · 2 by 30 yrs out
Nearby sold comps map
Loading sold comps map…
Walkable amenities ~0.75 mi
Loading nearby amenities…
Taxation est. · year 1
- Rental income
- $14,984
- − Mortgage interest
- −$6,436
- − Property taxes
- −$1,270
- − Insurance
- −$574
- − Repairs & maintenance
- −$1,199
- − Management
- −$1,199
- − Depreciation
- −$3,343
- Taxable income
- $963
- Est. tax owed @ 24.0%
- −$231
- After-tax cash flow
- $2,531/yr
For passive investors: Depreciation is non-cash, so a rental often shows a tax loss while cash-flowing — sheltering income. Rental losses are passive: they offset passive income freely, and up to $25,000/yr can offset ordinary (W-2) income if you actively participate and your MAGI is under $100k (phasing out to $0 by $150k); unused losses carry forward. On sale, claimed depreciation is recaptured at up to 25%, and gains may owe capital-gains tax (a 1031 exchange can defer both). Figures are a year-1 estimate at your 24.0% rate — not tax advice; consult a CPA.
Schools (NCES district)
- District
- Brooke County Schools
- NCES district ID
- 5400150
- Math proficiency
- 26% ▼ -6.00%
- Reading proficiency
- 35% ▲ 1.00%
- Median HH income
- $43,826
- Composite
- 26.0/100
- National rank
- #7319
- State rank
- #26 of 55 in WV
Livability — Follansbee
- Score
- 72/100
- State rank
- #49
- US rank
- #5909
Category grades
Schools grade is shown separately in the Schools card above.
Census & demographics
- Census place
- Follansbee, WV
- City population
- 5,727
- Population (ZIP)
- 5,727
Population outlook (Brooke County) Hauer SSP2
- Today (2025)
- 22,250 people
- By 2030
- 21,459 · -3.6%
- By 2040
- 19,659 · -11.6%
- By 2050
- 18,029 · -19.0%
- By 2075
- 15,076 · -32.2%
- By 2100
- 12,164 · -45.3%
Race, ethnicity, and origin ACS 2023
- Neighborhood character
- Predominantly White (95%)
- Race & ethnicity
- White 95% Two or more races 4% Hispanic / Latino 1%
- Common ancestry
- Romanian 4% Slovak 4% Serbian 3%
- Foreign-born
- 2%
- Languages at home
- 99% English-only · German/W. Germanic 1%
Political lean MEDSL · Brooke
- 2024 margin
- Solid R (+44.6) · D 26.8% · R 71.4% · Other 1.8%
- 2008→2024 swing
- -42.2pp toward R · 2008: -2.5pp · 2024: -44.6pp
- All cycles
- 2024: R+44.6 2020: R+43.1 2016: R+42.2 2012: R+11.2 2008: R+2.5
Not yet ingested
- Civics
- —
Market trends
- HPI YoY
- ▼ -0.34%
- Current HPI
- 219.1118
- Rent YoY
- —
- Metro
- —
- State GDP YoY
- —
- F500 in state
- 0
Price history
+159.4% since first listed6 events — show timeline
- 2026-05-14 Relisted — MLSNOW
- 2026-05-09 Contingent — MLSNOW
- 2026-05-03 Listed $114,900 MLSNOW
- 2026-04-25 Listing Removed — MLSNOW
- 2026-01-16 Listed $125,000 MLSNOW
- 2001-11-01 Sold (Public Records) $44,290 Public Records
Property tax history
+10.5%/yrLatest (2025): $1,270 · +20.2% YoY. Source: county tax records.
Cash-flow waterfall
monthlySold comps — $/sqft
last 12 mo · ≤1 miLoading sold comps…