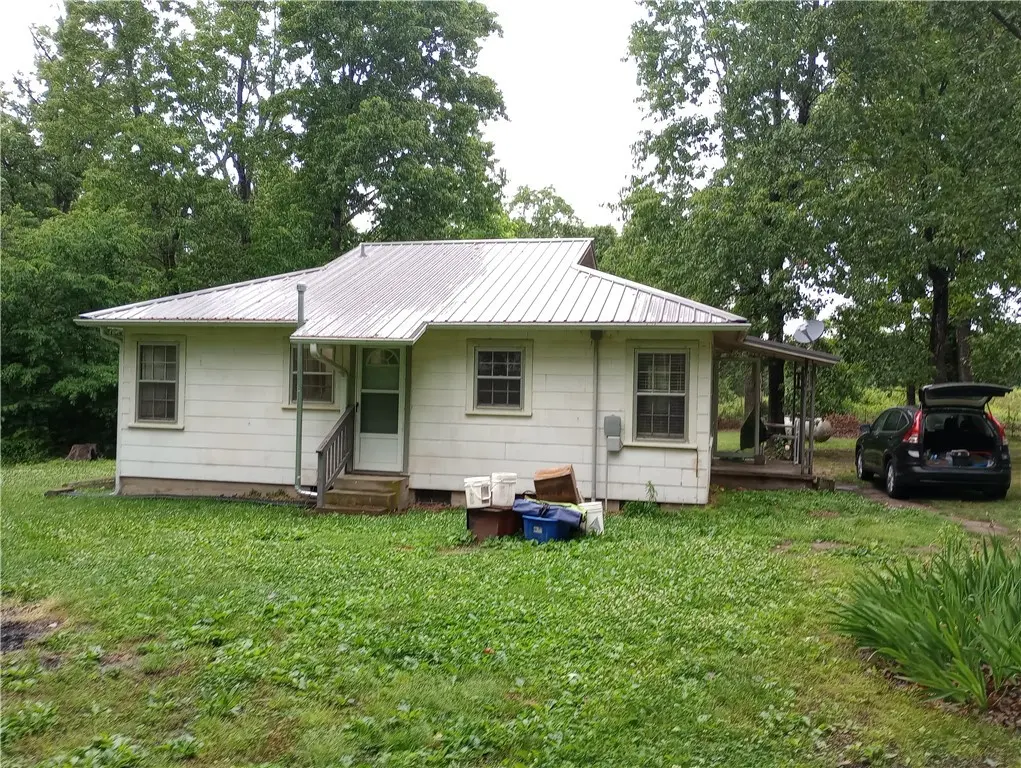
39145 Highway 23 · Huntsville, AR
Flood risk 1/10 · Minimal
- FEMA flood zone
- X
- Chance of flooding over 30 yrs
- 0.0%
- Est. flood insurance / yr
- $473 – $860
Fire risk 5/10 · Moderate
- Est. fire insurance / yr
- $1,499 – $2,785
Heat risk 4/10 · Minor
- Hot days now (above 104°F)
- 7 days/yr
- Hot days in 30 yrs
- 21 days/yr
Wind risk 2/10 · Minimal
- Chance of severe wind over 30 yrs
- 1.0%
Air-quality risk 2/10 · Minimal
- Unhealthy air days now
- 0 days/yr
- Unhealthy air days in 30 yrs
- 1 days/yr
Risk factors via First Street. Map © Google.
Why this score? — see what drove the B- grade
The composite is a weighted blend of 9 inputs, each scored 0–100. Each bar is that input's sub-score; the figure is the points it added to the 100-point composite (weight × sub-score).
- Cash flow +24.8/30.0
- Appreciation +10.0/10.0
- DSCR +8.0/10.0
- ARV discount +7.5/15.0
- 1% rule +5.5/10.0
- Livability +3.7/5.0
- Schools +2.7/10.0
- Rent growth +2.5/5.0
- Condition / age +2.5/5.0
$110,000
🖨 Deal sheet 📄 Offer letter ✓ Due diligence
Listing remarks
Oldie but a goodie!!! This house has a better foundation than most houses now, solid concrete with new piers, some crawl space, and some concrete floor.
Key facts
- Solid concrete
- New piers
- Crawl space
Tags
Property features AI
Finance
- Other: Annual tax amount disclosed
- HOA & community: Monthly association fee
Exterior
- Parking: Gravel driveway parking
- Utilities: Electricity available; Propane available; Septic available (septic tank); Water available (well, rural)
- Home design: 2-story property
- Construction: Masonite siding; Metal roof; Crawlspace/skirt/slab/cellar foundation
- Exterior features: Gravel driveway; Cleared lot; Corner lot; Outside city limits; Highway frontage; Guest house; Outbuilding; Storage building; Well house; 1.5 acres pasture
Interior
- Kitchen: Propane range; Refrigerator
- Flooring: Laminate; Tile; Wood
- Bathrooms: 1 full bathroom
- Heating & cooling: Propane heating; Window air conditioning unit(s)
- Interior features: Ceiling fan(s); Crawl space basement
- Laundry & utility: Washer hookup; Dryer hookup; Propane water heater
Neighborhood map
What this means for you Summary
Snapshot
- This is a 2-bed/1.0-bath single-family listed at $110k.
Deal economics
- At list price, monthly cash flow is $233 ($3k/yr) — positive.
- The deal already cash-flows at list — no discount required.
- Meets the 1% rule at list price ($1k rent vs $110k).
- Recommended offer: $108k (1.5% below list) — sets the bar for market timing.
- Cap rate 8.8% vs local median 2.8% in Huntsville — top-decile yield for the area; either an underpriced asset or a hidden risk that comps aren't pricing in. Stress-test before assuming the spread holds.
Location & tenants
- Location reads 73/100 on livability (#26 in AR) — a middle-class / working-renter tenant base. Strengths: cost of living A+, housing A+, health & safety A+; Watch: schools F, amenities F, commute F.
- Huntsville School District (rural): math 35% / reading 29% proficiency, ranked #141 of 238 in AR (top 59%) — families likely to look elsewhere, expect single-tenant / working-renter base with shorter leases.
- Market conditions: 129 active listings in the ZIP; 29 units permitted in Madison County in 2024 (0 in 5+ unit buildings).
Forward outlook
- In year one you build about $12k of equity ($761 loan paydown + $11k appreciation (10.0% local appreciation)).
- Madison County population projected to shrink 9% by 2050 — rents likely to lag national; underwrite the cash flow, not the appreciation.
- At projected returns (10.0% appreciation + 3.0% rent growth), your $31k cash investment doubles in ~3 years — after that, you're playing with house money.
- By year 4, paydown + projected appreciation supports a ~$42k cash-out refi (75% LTV) — recoverable capital for the next deal without selling this one.
Negotiation context
- It's been on market 27 days — a 2% lower offer ($108k) is reasonable based on typical stale-listing flexibility.
Risks & watch-outs
- Watch-outs: built in 1951 — expect roof / HVAC / electrical / plumbing capex.
- Climate carrying-cost: moderate wildfire risk — expect insurance premiums to compound above CPI over the hold.
Questions for the listing agent
- Built in 1951 — when were the roof, HVAC, electrical panel, plumbing, and water heater last replaced?
- Is there a deadline driving the sale (1031 exchange, divorce, estate, relocation)? That informs how much negotiation room exists.
- Schools are F-rated, which usually means shorter tenancies and higher turnover. Who's the typical renter profile here, and what's been the actual vacancy rate?
- What's the average days-on-market for RENTAL listings here right now (not sales)? A rising rental-DOM trend means longer vacancies and softer asking-rent achievability than the comps imply.
- What's the recent tenant-quality profile in this submarket — average credit score on applications, eviction rate, late-payment / NSF rate, and stable-employment percentage? A property-management company in the area should have these aggregated.
- How much new for-sale + rental construction is in the pipeline within 1–3 miles? Heavy new supply typically softens prices + rents 12–24 months out; constrained supply supports both.
Investment metrics
- 1% rule
- 1.05% ✓
- Cap rate
- 8.84%
- Cash-on-cash
- 9.09%
- DSCR
- 1.40
- GRM
- 8.0
CMA / ARV
No comps found within radius.
Projected returns pro-forma
10.0% appreciation · 3.0% rent growth · sell at horizon
- IRR
- 30.9%
- Equity multiple
- 3.43×
- Total profit
- $74,730
- Equity at exit
- $99,097
- IRR
- 26.7%
- Equity multiple
- 7.76×
- Total profit
- $208,320
- Equity at exit
- $213,706
Cash invested: $30,800 (down + closing). Projections, not guarantees.
Landlord ↔ Tenant lean methodology
- Overall (STATE)
- 92 Strongly Landlord-Friendly
- State Arkansas
- 92 Strongly Landlord-Friendly · R+14
- County
- — inherits STATE
- City
- — inherits STATE
ZIP-level market 72740
- Home prices YoY
- 19.5%
- Active inventory
- 129
- Price-to-rent
- 8.0×
Monthly cashflow live
- Estimated rent
- $1,153 medium interval (Pro) →
- Mortgage (P&I)
- −$577
- Tax from tax record
- −$55 /mo · $658/yr
- Insurance
- −$46
- HOA
- −$0
- Vacancy / Maint / Mgmt
- −$242
- Net cashflow
- $233
Break-even live
UW: 25.0% down · 7.5% · 30yr · 1.5% tax · 5.0% vac · 8.0% maint · 8.0% mgmt
Financing live
Cash to close
- Down payment
- $27,500
- Closing costs
- $3,300
- Reserves months
- —
- Total cash needed
- —
Loan-product check · same deal, 3 products live
Conventional
25% down · 7.5% · 30yr
- Down + closing
- —
- Monthly P&I
- —
- Monthly cashflow
- —
- DSCR
- —
- Eligible?
- —
Personal DTI + credit; lowest rate.
DSCR
20% down · 8.5% · 30yr
- Down + closing
- —
- Monthly P&I
- —
- Monthly cashflow
- —
- DSCR
- —
- Eligible?
- —
No personal income docs; deal must DSCR.
Hard money
10% down · 12.0% · 12mo
- Down + closing
- —
- Monthly P&I
- —
- Monthly cashflow
- —
- DSCR
- —
- Eligible?
- —
Short-term bridge; refi at stabilization.
Listing history 17 events
-
2026-06-18days on market $110,000 Active 27 DOM
-
2026-06-17days on market $110,000 Active 26 DOM
-
2026-06-16pricedays on market $110,000 Active 25 DOM
-
2026-06-15days on market $145,000 Active 24 DOM
-
2026-06-14days on market $145,000 Active 22 DOM
-
2026-06-13days on market $145,000 Active 21 DOM
-
2026-06-10days on market $145,000 Active 19 DOM
-
2026-06-09days on market $145,000 Active 18 DOM
-
2026-06-08days on market $145,000 Active 17 DOM
-
2026-06-07days on market $145,000 Active 16 DOM
-
2026-06-05days on market $145,000 Active 13 DOM
-
2026-06-03days on market $145,000 Active 12 DOM
-
2026-06-02days on market $145,000 Active 11 DOM
-
2026-06-01days on market $145,000 Active 10 DOM
-
2026-05-31days on market $145,000 Active 9 DOM
-
2026-05-31days on market $145,000 Active 8 DOM
-
2026-05-21$145,000 Active
ⓘ Source: listings_history table (triggers on properties + properties_extension) + one-shot
backfill from property_details.listing_events for pre-trigger history.
Tax reassessment forecast AR · Resets to sale price
- Current annual tax
- $658 · $55/mo
- Projected year-2 tax
- $704 · $59/mo
- Expected delta
- +$46/yr (+$4/mo · 7.0%)
ⓘ Screening estimate from a state-policy table — verify with the county assessor before closing.
Climate risk First Street
- Flood 1/10 Low FEMA zone X · 0% chance over 30 yrs
- Wildfire 5/10 Major
- Heat 4/10 Moderate 7 d/yr ≥104°F today · 21 d/yr by 30 yrs out
- Wind 2/10 Low 100% chance of damaging wind over 30 yrs
- Air quality 2/10 Low 0 unhealthy d/yr today · 1 by 30 yrs out
Nearby sold comps map
Loading sold comps map…
Walkable amenities ~0.75 mi
Loading nearby amenities…
Taxation est. · year 1
- Rental income
- $13,834
- − Mortgage interest
- −$6,162
- − Property taxes
- −$658
- − Insurance
- −$550
- − Repairs & maintenance
- −$1,107
- − Management
- −$1,107
- − Depreciation
- −$3,200
- Taxable income
- $1,051
- Est. tax owed @ 24.0%
- −$252
- After-tax cash flow
- $2,547/yr
For passive investors: Depreciation is non-cash, so a rental often shows a tax loss while cash-flowing — sheltering income. Rental losses are passive: they offset passive income freely, and up to $25,000/yr can offset ordinary (W-2) income if you actively participate and your MAGI is under $100k (phasing out to $0 by $150k); unused losses carry forward. On sale, claimed depreciation is recaptured at up to 25%, and gains may owe capital-gains tax (a 1031 exchange can defer both). Figures are a year-1 estimate at your 24.0% rate — not tax advice; consult a CPA.
Schools (NCES district)
- District
- Huntsville School District
- NCES district ID
- 0508130
- Math proficiency
- 35% ▼ -7.00%
- Reading proficiency
- 29% ▼ -7.00%
- Median HH income
- $37,770
- Composite
- 26.72/100
- National rank
- #7146
- State rank
- #141 of 238 in AR
Livability — Huntsville
- Score
- 73/100
- State rank
- #26
- US rank
- #5604
Category grades
Schools grade is shown separately in the Schools card above.
Census & demographics
- Population (ZIP)
- 10,226
Population outlook (Madison County) Hauer SSP2
- Today (2025)
- 15,655 people
- By 2030
- 15,418 · -1.5%
- By 2040
- 14,824 · -5.3%
- By 2050
- 14,198 · -9.3%
- By 2075
- 12,827 · -18.1%
- By 2100
- 10,871 · -30.6%
Race, ethnicity, and origin ACS 2023
- Neighborhood character
- Predominantly White (73%)
- Race & ethnicity
- White 73% Two or more races 22% Hispanic / Latino 4% Pacific Islander 1%
- Common ancestry
- Italian 3% Lithuanian 2% Slovak 2%
- Foreign-born
- 2% · Canada
- Languages at home
- 98% English-only · Spanish 1% Other Asian/Pacific 1%
Political lean MEDSL · Madison
- 2024 margin
- Solid R (+58.6) · D 19.9% · R 78.5% · Other 1.7%
- 2008→2024 swing
- -29.7pp toward R · 2008: -28.9pp · 2024: -58.6pp
- All cycles
- 2024: R+58.6 2020: R+55.7 2016: R+49.1 2012: R+32.9 2008: R+28.9
Not yet ingested
- Civics
- —
Market trends
- HPI YoY
- ▲ 57.73%
- Current HPI
- 353.404
- Rent YoY
- —
- Metro
- —
- State GDP YoY
- ▲ 3.80%
- F500 in state
- 10
Industry mix (Fortune 500 HQ in AR)
| Industry | F500 HQs | Revenue |
|---|---|---|
| Retail | 1 | $681B |
|
||
| Food / Agriculture | 1 | $53B |
|
||
| Retail / Energy | 1 | $22B |
|
||
| Transportation / Logistics | 1 | $12B |
|
||
| Energy | 1 | $4B |
|
||
Price history
1 event — show timeline
- 2026-05-21 Listed $145,000 NWARMLS
Property tax history
+5.5%/yrLatest (2025): $658 · +9.1% YoY. Source: county tax records.
Cash-flow waterfall
monthlySold comps — $/sqft
last 12 mo · ≤1 miLoading sold comps…