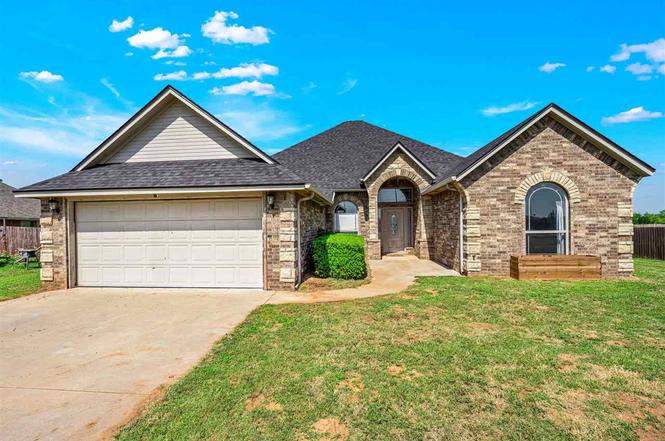
11249 NE Jere Layne · Elgin, OK
Flood risk 1/10 · Minimal
- FEMA flood zone
- X (unshaded)
- Chance of flooding over 30 yrs
- 0.0%
- Est. flood insurance / yr
- $507 – $1,088
Fire risk 8/10 · Major
- Est. fire insurance / yr
- $2,463 – $4,575
Heat risk 6/10 · Moderate
- Hot days now (above 108°F)
- 7 days/yr
- Hot days in 30 yrs
- 19 days/yr
Wind risk 3/10 · Minor
- Chance of severe wind over 30 yrs
- 9.0%
Air-quality risk 1/10 · Minimal
- Unhealthy air days now
- 0 days/yr
- Unhealthy air days in 30 yrs
- 0 days/yr
Risk factors via First Street. Map © Google.
Why this score? — see what drove the D grade
The composite is a weighted blend of 9 inputs, each scored 0–100. Each bar is that input's sub-score; the figure is the points it added to the 100-point composite (weight × sub-score).
- ARV discount +11.4/15.0
- Appreciation +10.0/10.0
- Cash flow +7.7/30.0
- Livability +3.7/5.0
- Schools +3.0/10.0
- Rent growth +2.5/5.0
- Condition / age +2.5/5.0
- 1% rule +1.8/10.0
- DSCR +1.8/10.0
$310,000
🖨 Deal sheet 📄 Offer letter ✓ Due diligence
Listing remarks MLS
This home had been listed recently, but due to tenant's schedule was not able to shown, though he took excellent care of the home. It is now vacant and is the gorgeous house you have been scanning the internet just hoping to find! It's one to be proud of. Go ahead and make out the guest list for your first gathering of family and friends, there is plenty of room and it is gorgeous! 4 bedrooms, 2 baths, 2 car garage, beautiful woodwork throughout, granite countertops, spacious kitchen with an island and a pantry! Stainless steel appliances, open pass-thru window between living room, living room has impressive inset high tray ceiling and fireplace, primary bedroom has huge walk-in closet and primary ensuite bath has big whirlpool tub, shower, separate sinks and vanity storage. This home has a wonderful backyard, plenty of room for family, friends and pets, wooden fence, great front curb appeal and all in the prestigious award- winning Elgin school district.
Key facts
- 0.5 acre lot
- 2 garage spots
- Built 2010
Property features AI
Exterior
- Parking: 2 total parking spaces; 2 covered parking spaces; 2-car garage with garage door opener
- Security: Smoke detectors
- Utilities: Septic tank sewer
- Home design: Single family residence; One level; Residential property
- Construction: Brick veneer construction; Slab foundation; Built with composition roof
- Exterior features: Covered patio; Patio; Wood fencing; Composition roof; Public maintained road frontage on a city street
Interior
- Kitchen: Microwave; Dishwasher; Disposal; Refrigerator; Oven
- Flooring: Ceramic tile; Carpet
- Bathrooms: 2 full bathrooms
- Heating & cooling: Central heating; Fireplace heating; Central air conditioning; Electric cooling
- Interior features: Fireplace; Microwave; Dishwasher; Disposal; Refrigerator; Electric water heater; Oven
- Laundry & utility: Electric water heater
Neighborhood map
What this means for you Summary
Snapshot
- This is a 3-bed/2.0-bath single-family listed at $310k.
Deal economics
- At list price, monthly cash flow is $-352 ($-4k/yr) — negative.
- To cash-flow at today's rent, offer at most $248k (20.1% below list).
- To meet the 1% rule (rent ≥ 1% of price), the offer needs to be $211k (31.8% below list).
- Recommended offer: $211k (31.8% below list) — sets the bar for 1% rule.
Location & tenants
- Location reads 73/100 on livability (#17 in OK) — a middle-class / working-renter tenant base. Strengths: crime A+, housing A+, cost of living A; Watch: amenities F, commute F, health & safety F.
- Elgin (rural): math 29% / reading 36% proficiency, ranked #38 of 270 in OK (top 14%) — families likely to look elsewhere, expect single-tenant / working-renter base with shorter leases.
- Zoned schools: Elgin Es (math 36% / reading 33%, grade F, #168 of 845 statewide, top 24%, 945 students, 0% FRL); Elgin Ms (math 26% / reading 34%, grade F, #49 of 345 statewide, top 15%, 791 students, 0% FRL); Elgin Hs (math 27% / reading 47%, grade F, #42 of 447 statewide, top 10%, 771 students, 0% FRL) — zoned schools average 0% FRL vs 29% district-wide (29 pts lower); this property's tenant base skews higher-income than the district average.
- Market conditions: 95 active listings in the ZIP; 2 comparable units currently listed for rent nearby; solid renter incomes; 133 units permitted in Comanche County in 2024 (0 in 5+ unit buildings).
Forward outlook
- In year one you build about $33k of equity ($2k loan paydown + $31k appreciation (10.0% local appreciation)).
- Comanche County population projected to shrink 3% by 2050 — rents likely to lag national; underwrite the cash flow, not the appreciation.
- By year 2, paydown + projected appreciation supports a ~$53k cash-out refi (75% LTV) — recoverable capital for the next deal without selling this one.
Negotiation context
- Only 4 days on market — expect competitive offers; lowballing is unlikely to land.
- 3 sale attempts since 16y ago with the ask held roughly flat each time — persistent listings suggest the price (not the market) is what's stuck; bring a comps-based counter.
- Current owner paid $257k; 21% above their basis — modest negotiation headroom, anchor on the comps not their cost.
Risks & watch-outs
- Climate carrying-cost: severe wildfire risk; extreme-heat days projected 7→19/yr by 2055 (HVAC capex compounding) — expect insurance premiums to compound above CPI over the hold.
Questions for the listing agent
- What do current leases actually rent for vs. the listed asking? Can we see a recent rent roll and the last 12 months of T-12 income?
- Is there a deadline driving the sale (1031 exchange, divorce, estate, relocation)? That informs how much negotiation room exists.
- The area grade is low — what's the realistic commute time and amenity access for the typical tenant pool here? Any planned neighborhood developments (good or bad) we should know about?
- What's the average days-on-market for RENTAL listings here right now (not sales)? A rising rental-DOM trend means longer vacancies and softer asking-rent achievability than the comps imply.
- What's the recent tenant-quality profile in this submarket — average credit score on applications, eviction rate, late-payment / NSF rate, and stable-employment percentage? A property-management company in the area should have these aggregated.
- How much new for-sale + rental construction is in the pipeline within 1–3 miles? Heavy new supply typically softens prices + rents 12–24 months out; constrained supply supports both.
Investment metrics
- 1% rule
- 0.68% ✗
- Cap rate
- 4.93%
- Cash-on-cash
- -4.87%
- DSCR
- 0.78
- GRM
- 12.2
CMA / ARV
- ARV (on-the-fly)
- $339,783
- Comps found
- 6
Show comp detail 6 sales within ~0.75 mi
| Address | Dist | Beds/Ba | Sqft | Sold | Price | $/sf | Match |
|---|---|---|---|---|---|---|---|
| 11269 NE Jere Layne | 0.09mi | 4/2.5 (+1) | 2,200 (+3%) | 9mo | $350,000 | $159 | 76 |
| 11390 NE Trail Rd | 0.27mi | 4/2.5 (+1) | 2,100 (-2%) | 2mo | $218,000 | $104 | 76 |
| 11246 NE Jere Layne | 0.06mi | 4/2.0 (+1) | 1,900 (-11%) | 9mo | $300,000 | $158 | 67 |
| 11274 NE Jere Layne | 0.10mi | 4/2.5 (+1) | 2,200 (+3%) | 23mo | $340,000 | $155 | 64 |
| 10858 NE Seaside Ln | 0.49mi | 4/2.0 (+1) | 1,950 (-9%) | 12mo | $340,000 | $174 | 48 |
| 10780 NE Seaside Ln | 0.47mi | 4/2.0 (+1) | 1,900 (-11%) | 19mo | $325,000 | $171 | 38 |
Match score weights: distance 35% · size 25% · config 20% · recency 20%. Top-matched comps best support the ARV.
Projected returns pro-forma
10.0% appreciation · 3.0% rent growth · sell at horizon
- IRR
- 20.8%
- Equity multiple
- 2.69×
- Total profit
- $146,371
- Equity at exit
- $279,273
- IRR
- 18.9%
- Equity multiple
- 6.17×
- Total profit
- $448,587
- Equity at exit
- $602,262
Cash invested: $86,800 (down + closing). Projections, not guarantees.
Landlord ↔ Tenant lean methodology
- Overall (STATE)
- 83 Strongly Landlord-Friendly
- State Oklahoma
- 83 Strongly Landlord-Friendly · R+20
- County
- — inherits STATE
- City
- — inherits STATE
ZIP-level market 73538
- Home prices YoY
- 22.9%
- Active inventory
- 95
- Price-to-rent
- 12.2×
Monthly cashflow live
- Estimated rent
- $2,115 medium interval (Pro) →
- Mortgage (P&I)
- −$1,626
- Tax from tax record
- −$268 /mo · $3,214/yr
- Insurance
- −$129
- HOA
- −$0
- Vacancy / Maint / Mgmt
- −$444
- Net cashflow
- $-352
Break-even live
UW: 25.0% down · 7.5% · 30yr · 1.5% tax · 5.0% vac · 8.0% maint · 8.0% mgmt
Financing live
Cash to close
- Down payment
- $77,500
- Closing costs
- $9,300
- Reserves months
- —
- Total cash needed
- —
Loan-product check · same deal, 3 products live
Conventional
25% down · 7.5% · 30yr
- Down + closing
- —
- Monthly P&I
- —
- Monthly cashflow
- —
- DSCR
- —
- Eligible?
- —
Personal DTI + credit; lowest rate.
DSCR
20% down · 8.5% · 30yr
- Down + closing
- —
- Monthly P&I
- —
- Monthly cashflow
- —
- DSCR
- —
- Eligible?
- —
No personal income docs; deal must DSCR.
Hard money
10% down · 12.0% · 12mo
- Down + closing
- —
- Monthly P&I
- —
- Monthly cashflow
- —
- DSCR
- —
- Eligible?
- —
Short-term bridge; refi at stabilization.
Rent comps 2 comps
| Address | Beds | Baths | Sqft | Rent | $/sqft | DOM | Units | Dist |
|---|---|---|---|---|---|---|---|---|
| 1205 Alma Dr Elgin, OK | 4.0 | 2.0 | 1800 | $1,900 | $1.06 | 11d | 1 | 1.30mi |
| 1517 Stonehouse Dr Elgin, OK | 4.0 | 2.0 | 1565 | $1,700 | $1.09 | 21d | 1 | 1.48mi |
Listing history 5 events
-
2026-06-19days on market $310,000 Active 4 DOM
-
2026-06-18days on market $310,000 Active 3 DOM
-
2026-06-17days on market $310,000 Active 2 DOM
-
2026-06-15remarks 479-char remark
-
2026-06-15$310,000 Active 1 DOM
ⓘ Source: listings_history table (triggers on properties + properties_extension) + one-shot
backfill from property_details.listing_events for pre-trigger history.
Tax reassessment forecast OK · Resets to sale price
- Current annual tax
- $3,214 · $268/mo
- Projected year-2 tax
- $3,214 · $268/mo
- Expected delta
- $0/yr ($0/mo · 0.0%)
ⓘ Screening estimate from a state-policy table — verify with the county assessor before closing.
Climate risk First Street
- Flood 1/10 Low FEMA zone X (unshaded) · 0% chance over 30 yrs
- Wildfire 8/10 Severe
- Heat 6/10 Major 7 d/yr ≥108°F today · 19 d/yr by 30 yrs out
- Wind 3/10 Moderate 9% chance of damaging wind over 30 yrs
- Air quality 1/10 Low 0 unhealthy d/yr today · 0 by 30 yrs out
Nearby sold comps map
Loading sold comps map…
Walkable amenities ~0.75 mi
Loading nearby amenities…
Taxation est. · year 1
- Rental income
- $25,377
- − Mortgage interest
- −$17,365
- − Property taxes
- −$3,214
- − Insurance
- −$1,550
- − Repairs & maintenance
- −$2,030
- − Management
- −$2,030
- − Depreciation
- −$9,018
- Taxable loss
- −$9,831
- Est. tax savings @ 24.0%
- +$2,359
- After-tax cash flow
- $-1,865/yr
For passive investors: Depreciation is non-cash, so a rental often shows a tax loss while cash-flowing — sheltering income. Rental losses are passive: they offset passive income freely, and up to $25,000/yr can offset ordinary (W-2) income if you actively participate and your MAGI is under $100k (phasing out to $0 by $150k); unused losses carry forward. On sale, claimed depreciation is recaptured at up to 25%, and gains may owe capital-gains tax (a 1031 exchange can defer both). Figures are a year-1 estimate at your 24.0% rate — not tax advice; consult a CPA.
Schools (NCES district)
- District
- Elgin
- NCES district ID
- 4010710
- Math proficiency
- 29% ▼ -9.00%
- Reading proficiency
- 36% ▼ -5.00%
- Median HH income
- $65,900
- Composite
- 29.77/100
- National rank
- #6432
- State rank
- #38 of 270 in OK
Livability — Elgin
- Score
- 73/100
- State rank
- #17
- US rank
- #5411
Category grades
Schools grade is shown separately in the Schools card above.
Census & demographics
- County
- Comanche County · 96,361 people
- City population
- 7,128
- Metro
- Lawton, OK
- Population (ZIP)
- 7,128
- Household income
- $91,324
- Rent vs Own
- Severe rent burden
- 70.0
Population outlook (Comanche County) Hauer SSP2
- Today (2025)
- 124,518 people
- By 2030
- 124,231 · -0.2%
- By 2040
- 122,193 · -1.9%
- By 2050
- 120,368 · -3.3%
- By 2075
- 120,492 · -3.2%
- By 2100
- 123,113 · -1.1%
Race, ethnicity, and origin ACS 2023
- Neighborhood character
- Predominantly White (71%)
- Race & ethnicity
- White 71% Two or more races 15% Hispanic / Latino 13% Native American 4% Black 2% Asian 1%
- Hispanic origin (detail)
- Mexican 11% Puerto Rican 2%
- Common ancestry
- Slovak 5% Romanian 2% Serbian 1%
- Foreign-born
- 3% · Canada
- Languages at home
- 93% English-only · Spanish 4% German/W. Germanic 1%
Political lean MEDSL · Comanche
- 2024 margin
- Strong R (+23.3) · D 37.4% · R 60.7% · Other 1.9%
- 2008→2024 swing
- -5.8pp toward R · 2008: -17.5pp · 2024: -23.3pp
- All cycles
- 2024: R+23.3 2020: R+20.1 2016: R+23.7 2012: R+17.0 2008: R+17.5
Not yet ingested
- Civics
- —
Market trends
- HPI YoY
- ▲ 45.70%
- Current HPI
- 245.4249
- Rent YoY
- —
- Metro
- Lawton, OK
- State GDP YoY
- ▲ 1.55%
- F500 in state
- 6
Industry mix (Fortune 500 HQ in OK)
| Industry | F500 HQs | Revenue |
|---|---|---|
| Energy | 3 | $48B |
|
||
Price history
+49.1% since first listed7 events — show timeline
- 2026-06-15 Listed $310,000 LBRMLS
- 2021-11-12 Sold (Public Records) $257,000 Public Records
- 2021-11-12 Sold (MLS) $257,000 LBRMLS
- 2021-07-23 Listed $245,000 LBRMLS
- 2011-03-09 Sold (MLS) $208,000 LBRMLS
- 2011-01-23 Sold (Public Records) $208,000 Public Records
- 2010-12-13 Listed $207,950 LBRMLS
Property tax history
+2.9%/yrLatest (2025): $3,214 · +1.1% YoY. Source: county tax records.
Cash-flow waterfall
monthlySold comps — $/sqft
last 12 mo · ≤1 miLoading sold comps…