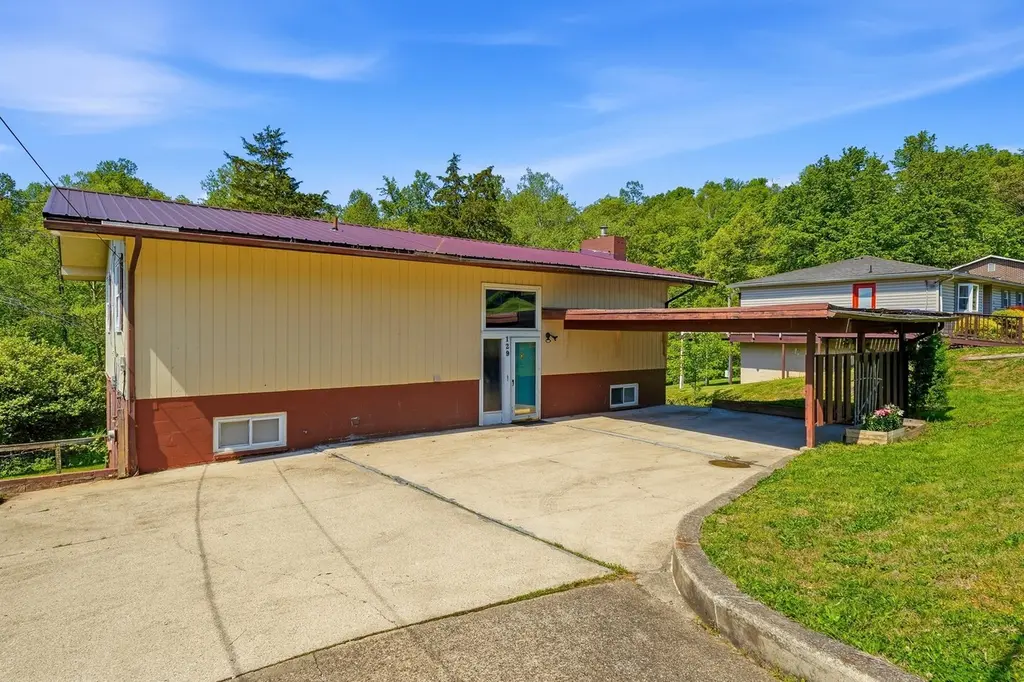
129 Westwood Ln · Ceredo, WV
Flood risk 1/10 · Minimal
- FEMA flood zone
- X (unshaded)
- Chance of flooding over 30 yrs
- 0.0%
- Est. flood insurance / yr
- $507 – $1,088
Fire risk 5/10 · Moderate
- Est. fire insurance / yr
- $787 – $1,461
Heat risk 4/10 · Minor
- Hot days now (above 101°F)
- 7 days/yr
- Hot days in 30 yrs
- 19 days/yr
Wind risk 2/10 · Minimal
- Chance of severe wind over 30 yrs
- 1.0%
Air-quality risk 1/10 · Minimal
- Unhealthy air days now
- 0 days/yr
- Unhealthy air days in 30 yrs
- 0 days/yr
Risk factors via First Street. Map © Google.
Why this score? — see what drove the C grade
The composite is a weighted blend of 9 inputs, each scored 0–100. Each bar is that input's sub-score; the figure is the points it added to the 100-point composite (weight × sub-score).
- Cash flow +20.7/30.0
- ARV discount +15.0/15.0
- DSCR +6.6/10.0
- 1% rule +4.6/10.0
- Livability +4.0/5.0
- Schools +2.6/10.0
- Rent growth +2.5/5.0
- Condition / age +2.5/5.0
- Appreciation +0.0/10.0
$150,000
🖨 Deal sheet 📄 Offer letter ✓ Due diligence
Listing remarks
NEW PRICE!! Fantastic opportunity for buyers looking to build equity and add their own personal touch. A few cosmetic updates will make this property truly shine! Westwood Lane right across from Spring Valley High School. If space is what you have been searching for, this one delivers. This 5 bedroom, 2 bath home offers over 2,200 Sq. Ft. and sits on approximately . 45 acres in a highly convenient Huntington location. Enjoy the large, open living area with vaulted ceilings. Open concept perfect for entertaining. Just steps away from the high school and a short drive to VA Hospital.
Key facts
- Open concept
- Huntington location
- Open living area
Tags
Property features AI
Finance
- Other: Lot approximately 0.41 acres
Exterior
- Utilities: Public water; Public sewer
- Home design: Single-family residence; Residential property; 2 stories
- Construction: Wood siding; Metal roof
- Exterior features: Deck
Interior
- Kitchen: Dishwasher; Range; Oven; Refrigerator
- Bedrooms: 2-story home (bedroom level details not specified)
- Flooring: Laminate
- Bathrooms: 2 full bathrooms
- Heating & cooling: Central heating; Natural gas heating; Wood heating; Central air conditioning
- Interior features: Living room fireplace; Ceiling fan(s)
- Laundry & utility: Washer; Dryer
Neighborhood map
What this means for you Summary
Snapshot
- This is a 4-bed/2.0-bath single-family listed at $150k.
Deal economics
- At list price, monthly cash flow is $204 ($2k/yr) — positive.
- The deal already cash-flows at list — no discount required.
- To meet the 1% rule (rent ≥ 1% of price), the offer needs to be $144k (3.7% below list).
- Recommended offer: $144k (3.7% below list) — sets the bar for 1% rule.
Location & tenants
- Location reads 79/100 on livability (#18 in WV, #2,195 nationally) — a middle-class / working-renter tenant base. Strengths: crime A+, cost of living A+, housing A+; Watch: amenities F, employment F.
- Wayne County Schools (rural): math 25% / reading 38% proficiency, ranked #25 of 55 in WV (top 46%) — families likely to look elsewhere, expect single-tenant / working-renter base with shorter leases.
- Zoned schools: Kellogg Elementary School (math 47% / reading 37%, grade F, #87 of 377 statewide, top 28%, 327 students, 0% FRL); Vinson Middle School (math 19% / reading 53%, grade F, #31 of 109 statewide, top 28%, 197 students, 0% FRL); Spring Valley High School (math 17% / reading 47%, grade F, #55 of 110 statewide, top 59%, 910 students, 0% FRL) — zoned schools average 0% FRL vs 46% district-wide (46 pts lower); this property's tenant base skews higher-income than the district average.
- Market conditions: 76 active listings in the ZIP; 67 units permitted in Wayne County in 2024 (0 in 5+ unit buildings).
Forward outlook
- Local home prices are declining (-3.0%/yr); year-one equity from $1k of loan paydown is wiped out by about $4k of value loss. Plan a longer hold.
- Wayne County population projected at -22% by 2050 — secular population decline; favor cash flow + early exit over multi-decade hold.
Negotiation context
- It's been on market 55 days — a 3% lower offer ($146k) is reasonable based on typical stale-listing flexibility.
- Current owner paid $63k; list at $150k implies a 137% gain — meaningful room to come down on a strong offer.
Risks & watch-outs
- Climate carrying-cost: moderate wildfire risk — expect insurance premiums to compound above CPI over the hold.
Questions for the listing agent
- It's been on market 55 days. Have you received any prior offers? Is the seller open to a 4% concession, seller financing, or rate buy-down credit?
- Built in 1965 — when were the roof, HVAC, electrical panel, plumbing, and water heater last replaced?
- Is there a deadline driving the sale (1031 exchange, divorce, estate, relocation)? That informs how much negotiation room exists.
- Schools are F-rated, which usually means shorter tenancies and higher turnover. Who's the typical renter profile here, and what's been the actual vacancy rate?
- What's the average days-on-market for RENTAL listings here right now (not sales)? A rising rental-DOM trend means longer vacancies and softer asking-rent achievability than the comps imply.
- What's the recent tenant-quality profile in this submarket — average credit score on applications, eviction rate, late-payment / NSF rate, and stable-employment percentage? A property-management company in the area should have these aggregated.
- How much new for-sale + rental construction is in the pipeline within 1–3 miles? Heavy new supply typically softens prices + rents 12–24 months out; constrained supply supports both.
Investment metrics
- 1% rule
- 0.96% ✗
- Cap rate
- 7.92%
- Cash-on-cash
- 5.83%
- DSCR
- 1.26
- GRM
- 8.7
CMA / ARV
- ARV (median comp)
- $229,275
- List price
- $150,000
- Delta
- -34.58%
- Verdict
- UNDERPRICED
- Comps
- 7 within 1.0 mi
Show comp detail 2 sales within ~0.75 mi
| Address | Dist | Beds/Ba | Sqft | Sold | Price | $/sf | Match |
|---|---|---|---|---|---|---|---|
| 1523 Greenbrier Dr | 0.73mi | 4/2.0 | 2,400 (+9%) | 7mo | $199,000 | $83 | 46 |
| 5762 Segar Hill Rd | 0.75mi | 3/2.0 (-1) | 2,380 (+8%) | 14mo | $235,000 | $99 | 36 |
Match score weights: distance 35% · size 25% · config 20% · recency 20%. Top-matched comps best support the ARV.
Projected returns pro-forma
-3.0% appreciation · 3.0% rent growth · sell at horizon
- IRR
- -7.3%
- Equity multiple
- 0.73×
- Total profit
- $-11,354
- Equity at exit
- $22,365
- IRR
- 2.2%
- Equity multiple
- 1.16×
- Total profit
- $6,682
- Equity at exit
- $12,969
Cash invested: $42,000 (down + closing). Projections, not guarantees.
Landlord ↔ Tenant lean methodology
- Overall (STATE)
- 83 Strongly Landlord-Friendly
- State West Virginia
- 83 Strongly Landlord-Friendly · R+22
- County
- — inherits STATE
- City
- — inherits STATE
ZIP-level market 25704
- Home prices YoY
- -13.7%
- Active inventory
- 76
- Price-to-rent
- 8.7×
Monthly cashflow live
- Estimated rent
- $1,444 medium interval (Pro) →
- Mortgage (P&I)
- −$787
- Tax from tax record
- −$87 /mo · $1,050/yr
- Insurance
- −$62
- HOA
- −$0
- Vacancy / Maint / Mgmt
- −$303
- Net cashflow
- $204
Break-even live
UW: 25.0% down · 7.5% · 30yr · 1.5% tax · 5.0% vac · 8.0% maint · 8.0% mgmt
Financing live
Cash to close
- Down payment
- $37,500
- Closing costs
- $4,500
- Reserves months
- —
- Total cash needed
- —
Loan-product check · same deal, 3 products live
Conventional
25% down · 7.5% · 30yr
- Down + closing
- —
- Monthly P&I
- —
- Monthly cashflow
- —
- DSCR
- —
- Eligible?
- —
Personal DTI + credit; lowest rate.
DSCR
20% down · 8.5% · 30yr
- Down + closing
- —
- Monthly P&I
- —
- Monthly cashflow
- —
- DSCR
- —
- Eligible?
- —
No personal income docs; deal must DSCR.
Hard money
10% down · 12.0% · 12mo
- Down + closing
- —
- Monthly P&I
- —
- Monthly cashflow
- —
- DSCR
- —
- Eligible?
- —
Short-term bridge; refi at stabilization.
Listing history 21 events
-
2026-06-19days on market $150,000 Active 55 DOM
-
2026-06-18days on market $150,000 Active 54 DOM
-
2026-06-17days on market $150,000 Active 53 DOM
-
2026-06-16days on market $150,000 Active 52 DOM
-
2026-06-15days on market $150,000 Active 51 DOM
-
2026-06-14days on market $150,000 Active 49 DOM
-
2026-06-12pricedays on market $150,000 Active 48 DOM
-
2026-06-09days on market $185,000 Active 45 DOM
-
2026-06-08days on market $185,000 Active 44 DOM
-
2026-06-07days on market $185,000 Active 43 DOM
-
2026-06-05days on market $185,000 Active 40 DOM
-
2026-06-03days on market $185,000 Active 39 DOM
-
2026-06-02days on market $185,000 Active 38 DOM
-
2026-06-01days on market $185,000 Active 37 DOM
-
2026-05-31days on market $185,000 Active 36 DOM
-
2026-05-30days on market $185,000 Active 35 DOM
-
2026-05-17price $185,000 590-char remark
-
2026-05-06price $199,900 590-char remark
-
2026-04-25$214,999 Active 590-char remark
-
2017-06-16soldstatus $63,183
-
2002-07-30soldstatus $87,500
ⓘ Source: listings_history table (triggers on properties + properties_extension) + one-shot
backfill from property_details.listing_events for pre-trigger history.
Tax reassessment forecast WV · Resets to sale price
- Current annual tax
- $1,050 · $87/mo
- Projected year-2 tax
- $1,050 · $87/mo
- Expected delta
- $0/yr ($0/mo · 0.0%)
ⓘ Screening estimate from a state-policy table — verify with the county assessor before closing.
Climate risk First Street
- Flood 1/10 Low FEMA zone X (unshaded) · 0% chance over 30 yrs
- Wildfire 5/10 Major
- Heat 4/10 Moderate 7 d/yr ≥101°F today · 19 d/yr by 30 yrs out
- Wind 2/10 Low 100% chance of damaging wind over 30 yrs
- Air quality 1/10 Low 0 unhealthy d/yr today · 0 by 30 yrs out
Nearby sold comps map
Loading sold comps map…
Walkable amenities ~0.75 mi
Loading nearby amenities…
Taxation est. · year 1
- Rental income
- $17,325
- − Mortgage interest
- −$8,402
- − Property taxes
- −$1,050
- − Insurance
- −$750
- − Repairs & maintenance
- −$1,386
- − Management
- −$1,386
- − Depreciation
- −$4,364
- Taxable loss
- −$12
- Est. tax savings @ 24.0%
- +$3
- After-tax cash flow
- $2,451/yr
For passive investors: Depreciation is non-cash, so a rental often shows a tax loss while cash-flowing — sheltering income. Rental losses are passive: they offset passive income freely, and up to $25,000/yr can offset ordinary (W-2) income if you actively participate and your MAGI is under $100k (phasing out to $0 by $150k); unused losses carry forward. On sale, claimed depreciation is recaptured at up to 25%, and gains may owe capital-gains tax (a 1031 exchange can defer both). Figures are a year-1 estimate at your 24.0% rate — not tax advice; consult a CPA.
Schools (NCES district)
- District
- Wayne County Schools
- NCES district ID
- 5401500
- Math proficiency
- 25% ▼ -15.00%
- Reading proficiency
- 38% ▼ -10.00%
- Median HH income
- $36,283
- Composite
- 26.08/100
- National rank
- #7297
- State rank
- #25 of 55 in WV
Livability — Ceredo
- Score
- 79/100
- State rank
- #18
- US rank
- #2195
Category grades
Schools grade is shown separately in the Schools card above.
Census & demographics
- City population
- 25,795
- Population (ZIP)
- 14,413
Population outlook (Wayne County) Hauer SSP2
- Today (2025)
- 38,267 people
- By 2030
- 36,578 · -4.4%
- By 2040
- 33,034 · -13.7%
- By 2050
- 29,671 · -22.5%
- By 2075
- 22,901 · -40.2%
- By 2100
- 17,421 · -54.5%
Race, ethnicity, and origin ACS 2023
- Neighborhood character
- Predominantly White (93%)
- Race & ethnicity
- White 93% Two or more races 5% Black 2%
- Common ancestry
- Italian 3% Serbian 2% Slovak 2%
- Foreign-born
- 1% · Canada
- Languages at home
- 99% English-only · French/Haitian/Cajun 1%
Political lean MEDSL · Wayne
- 2024 margin
- Solid R (+53.4) · D 22.4% · R 75.8% · Other 1.8%
- 2008→2024 swing
- -35.1pp toward R · 2008: -18.2pp · 2024: -53.4pp
- All cycles
- 2024: R+53.4 2020: R+50.1 2016: R+51.3 2012: R+27.0 2008: R+18.2
Not yet ingested
- Civics
- —
Market trends
- HPI YoY
- ▼ -32.21%
- Current HPI
- 202.1322
- Rent YoY
- —
- Metro
- —
- State GDP YoY
- —
- F500 in state
- 0
Price history
+71.4% since first listed6 events — show timeline
- 2026-06-10 Price Changed $150,000 HBRMLS
- 2026-05-17 Price Changed $185,000 HBRMLS
- 2026-05-06 Price Changed $199,900 HBRMLS
- 2026-04-25 Listed $214,999 HBRMLS
- 2017-06-16 Sold (Public Records) $63,183 Public Records
- 2002-07-30 Sold (Public Records) $87,500 Public Records
Property tax history
+3.9%/yrLatest (2025): $1,050 · +8.6% YoY. Source: county tax records.
Cash-flow waterfall
monthlySold comps — $/sqft
last 12 mo · ≤1 miLoading sold comps…