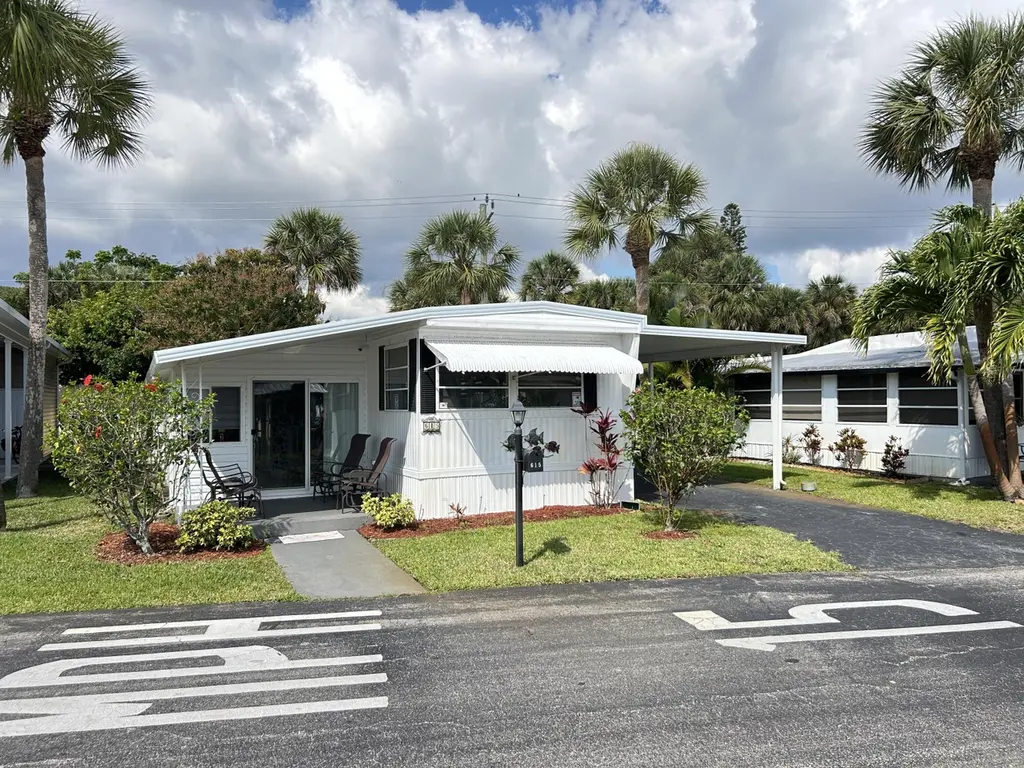
615 Alamanda Ln · Deerfield Beach, FL
Flood risk 3/10 · Minor
- FEMA flood zone
- AH
- Chance of flooding over 30 yrs
- 0.1%
- Est. flood insurance / yr
- $1,142 – $2,507
Fire risk 1/10 · Minimal
- Est. fire insurance / yr
- $947 – $1,759
Heat risk 10/10 · Severe
- Hot days now (above 107°F)
- 7 days/yr
- Hot days in 30 yrs
- 26 days/yr
Wind risk 10/10 · Severe
- Chance of severe wind over 30 yrs
- 99.0%
Air-quality risk 2/10 · Minimal
- Unhealthy air days now
- 1 days/yr
- Unhealthy air days in 30 yrs
- 3 days/yr
Risk factors via First Street. Map © Google.
Why this score? — see what drove the B grade
The composite is a weighted blend of 9 inputs, each scored 0–100. Each bar is that input's sub-score; the figure is the points it added to the 100-point composite (weight × sub-score).
- Cash flow +30.0/30.0
- 1% rule +10.0/10.0
- DSCR +10.0/10.0
- ARV discount +7.5/15.0
- Schools +4.1/10.0
- Livability +3.8/5.0
- Rent growth +2.5/5.0
- Condition / age +2.5/5.0
- Appreciation +0.0/10.0
$59,000
🖨 Deal sheet 📄 Offer letter ✓ Due diligence
Listing remarks
Charming 2-bedroom, 1-bathroom home sold fully furnished, as-is. A great opportunity to own a residence in Florida with a low investment. Located in a beautiful and very quiet community, this home offers a peaceful lifestyle while being conveniently close to all services, shopping, and amenities. New roof. Optional marina access and dock space are available (subject to availability). Enjoy a convenient 10-15 minute walk to the Tri-Rail station, offering easy commuting and connectivity. A perfect blend of comfort, lifestyle, and location.
Key facts
- 2 parking spots
- Built 1971
- Listed 83 days
Property features AI
Finance
- Other: Private maintained paved road; Waterfront: not waterfront (listing notes marina as a waterfront feature nearby)
- Financial info: Monthly land lease of $1,350 (land lease present, expires 2026-12-31)
- HOA & community: Located in a senior community; Pets allowed with breed and size restrictions
Exterior
- Parking: 2 total parking spaces; Attached carport (1 covered/carport space); Driveway; Concrete parking surface; 1 open parking space
- Utilities: Public water; Public sewer; Sewer connected; Water connected
- Home design: Manufactured home; One story; Resale condition; Faces east
- Construction: Metal roof; Other construction materials; Built as or recorded with 700 building area; Single-story structure
- Exterior features: Open patio and open porch; Additional outbuilding/shed/storage
Interior
- Kitchen: Electric Range; Electric Cooktop; Microwave; Refrigerator
- Bedrooms: 2 bedrooms on the main level
- Flooring: Laminate; Tile; Wood
- Bathrooms: 1 full bathroom
- Heating & cooling: Central heating; Central air; Ceiling fan(s); Wall/window unit(s)
- Interior features: No interior-specific built-ins or extras listed; Furnished
- Laundry & utility: In-unit laundry (inside)
Neighborhood map
What this means for you Summary
Snapshot
- This is a 2-bed/1.0-bath land listed at $59k.
Deal economics
- At list price, monthly cash flow is $1k ($12k/yr) — positive.
- The deal already cash-flows at list — no discount required.
- Meets the 1% rule at list price ($2k rent vs $59k).
- Recommended offer: $55k (6.0% below list) — sets the bar for market timing.
- Cap rate 30.4% vs local median 4.2% in Deerfield Beach — top-decile yield for the area; either an underpriced asset or a hidden risk that comps aren't pricing in. Stress-test before assuming the spread holds.
Location & tenants
- Location reads 75/100 on livability (#250 in FL, #3,970 nationally) — a middle-class / working-renter tenant base. Strengths: housing A+, health & safety A+, cost of living A; Watch: amenities D-, employment D-.
- Broward (suburban): math 42% / reading 53% proficiency, ranked #46 of 73 in FL (top 63%) — families likely to look elsewhere, expect single-tenant / working-renter base with shorter leases.
- Zoned schools: Quiet Waters Elementary School (math 40% / reading 48%, grade F, #1,330 of 2,144 statewide, top 63%, 1,128 students, 62% FRL); Lyons Creek Middle School (math 49% / reading 53%, grade C, #237 of 571 statewide, top 43%, 1,757 students, 60% FRL); Deerfield Beach High School (math 12% / reading 37%, grade F, #505 of 667 statewide, top 79%, 2,251 students, 69% FRL).
- Market conditions: Rents flat; 586 active listings in the ZIP; 19 comparable units currently listed for rent nearby; rentals at typical pace (median 25d on market — plan ~3-4 weeks tenant-placement turnaround); 2,111 units permitted in Broward County in 2024 (1,265 in 5+ unit buildings).
- At $2,082/mo this rent would consume 47% of the median local household income ($53k/yr) (locally 2169% of renters already pay >50% of income on rent) — very limited rent-growth headroom before tenants either downsize or default.
Forward outlook
- Local home prices are declining (-3.0%/yr); year-one equity from $408 of loan paydown is wiped out by about $2k of value loss. Plan a longer hold.
- Broward County population projected at +34% by 2050 — long-run rental-demand tailwind backs the buy-and-hold thesis.
- At projected returns (-3.0% appreciation + 0.1% rent growth), your $17k cash investment doubles in ~2 years — after that, you're playing with house money.
Negotiation context
- It's been on market 84 days — a 6% lower offer ($55k) is reasonable based on typical stale-listing flexibility.
Risks & watch-outs
- Watch-outs: property tax is 2.6% of price; flood insurance adds $152/mo.
- Climate carrying-cost: in FEMA flood zone AH (mandatory federal flood insurance); severe wind risk, 99% chance of damaging wind over 30y; extreme-heat days projected 7→26/yr by 2055 (HVAC capex compounding) — expect insurance premiums to compound above CPI over the hold.
Questions for the listing agent
- It's been on market 84 days. Have you received any prior offers? Is the seller open to a 6% concession, seller financing, or rate buy-down credit?
- Built in 1971 — when were the roof, HVAC, electrical panel, plumbing, and water heater last replaced?
- Property tax is high relative to price — has the assessment been appealed recently, and will the sale trigger a re-assessment?
- What's the actual annual flood-insurance premium (NFIP or private), and is the property in a SFHA with mandatory coverage?
- Why hasn't it sold? Are there any deal-killer items the seller is aware of (foundation, flood, title, zoning, code violations)?
- Is there a deadline driving the sale (1031 exchange, divorce, estate, relocation)? That informs how much negotiation room exists.
- Schools are D-rated, which usually means shorter tenancies and higher turnover. Who's the typical renter profile here, and what's been the actual vacancy rate?
- What's the average days-on-market for RENTAL listings here right now (not sales)? A rising rental-DOM trend means longer vacancies and softer asking-rent achievability than the comps imply.
- What's the recent tenant-quality profile in this submarket — average credit score on applications, eviction rate, late-payment / NSF rate, and stable-employment percentage? A property-management company in the area should have these aggregated.
- How much new for-sale + rental construction is in the pipeline within 1–3 miles? Heavy new supply typically softens prices + rents 12–24 months out; constrained supply supports both.
Investment metrics
- 1% rule
- 3.53% ✓
- Cap rate
- 30.37%
- Cash-on-cash
- 85.97%
- DSCR
- 4.83
- GRM
- 2.4
CMA / ARV
No comps found within radius.
Projected returns pro-forma
-3.0% appreciation · 0.1% rent growth · sell at horizon
- IRR
- 71.1%
- Equity multiple
- 4.05×
- Total profit
- $50,392
- Equity at exit
- $8,797
- IRR
- 74.1%
- Equity multiple
- 7.43×
- Total profit
- $106,256
- Equity at exit
- $5,101
Cash invested: $16,520 (down + closing). Projections, not guarantees.
Landlord ↔ Tenant lean methodology
- Overall (STATE)
- 87 Strongly Landlord-Friendly
- State Florida
- 87 Strongly Landlord-Friendly · R+3
- County
- — inherits STATE
- City
- — inherits STATE
ZIP-level market 33442
- Rents YoY
- 0.1%
- Active inventory
- 586
- Price-to-rent
- 2.4×
Monthly cashflow live
- Estimated rent
- $2,082 high interval (Pro) →
- Mortgage (P&I)
- −$309
- Tax from tax record
- −$127 /mo · $1,528/yr
- Insurance
- −$25
- Flood insurance flood zone
- −$152 /mo · $1,824/yr
- HOA
- −$0
- Vacancy / Maint / Mgmt
- −$437
- Net cashflow
- $1,032
Break-even live
UW: 25.0% down · 7.5% · 30yr · 1.5% tax · 5.0% vac · 8.0% maint · 8.0% mgmt
Financing live
Cash to close
- Down payment
- $14,750
- Closing costs
- $1,770
- Reserves months
- —
- Total cash needed
- —
Loan-product check · same deal, 3 products live
Conventional
25% down · 7.5% · 30yr
- Down + closing
- —
- Monthly P&I
- —
- Monthly cashflow
- —
- DSCR
- —
- Eligible?
- —
Personal DTI + credit; lowest rate.
DSCR
20% down · 8.5% · 30yr
- Down + closing
- —
- Monthly P&I
- —
- Monthly cashflow
- —
- DSCR
- —
- Eligible?
- —
No personal income docs; deal must DSCR.
Hard money
10% down · 12.0% · 12mo
- Down + closing
- —
- Monthly P&I
- —
- Monthly cashflow
- —
- DSCR
- —
- Eligible?
- —
Short-term bridge; refi at stabilization.
Rent comps 19 comps
| Address | Beds | Baths | Sqft | Rent | $/sqft | DOM | Units | Dist |
|---|---|---|---|---|---|---|---|---|
| 425 E Bougainvillea Dr Deerfield Beach, FL | 2.0 | 1.5 | 600 | $2,500 | $4.17 | 24d | 1 | 0.18mi |
| 23126 Post Gardens Way Boca Raton, FL | 1.0–2.0 | 1.0 | 851 | $2,120 | $2.49 | 2d | 8 | 0.75mi |
| 149 Westbury I #149 Deerfield Beach, FL | 1.0 | 1.0 | 585 | $1,700 | $2.91 | 24d | 1 | 0.86mi |
| 125 Westbury E Deerfield Beach, FL | 1.0 | 1.0 | 585 | $1,600 | $2.74 | 24d | 1 | 0.90mi |
| 566401 Arbor Club Way Boca Raton, FL | 1.0–2.0 | 1.0–2.0 | 917 | $3,033 | $3.31 | 5d | 21 | 0.91mi |
| 127 Westbury Cir Deerfield Beach, FL | 1.0 | 1.0 | 585 | $1,425 | $2.44 | 24d | 1 | 0.91mi |
| 102 Westbury E #102 Deerfield Beach, FL | 1.0 | 1.0 | 585 | $1,900 | $3.25 | 8d | 1 | 0.91mi |
| 98 Westbury E #98 Deerfield Beach, FL | 1.0 | 1.0 | 585 | $1,600 | $2.74 | 24d | 1 | 0.91mi |
| 3016 Cambridge A Unit A Deerfield Beach, FL | 1.0 | 1.5 | 700 | $1,350 | $1.93 | 24d | 1 | 0.99mi |
| 178 Durham E Unit 178 Deerfield Beach, FL | 1.0 | 1.0 | 593 | $1,350 | $2.28 | 11d | 1 | 1.02mi |
| 178 Durham E Unit 178 Deerfield Beach, FL | 1.0 | 1.0 | 593 | $1,350 | $2.28 | 3d | 1 | 1.02mi |
| 384 Durham Cir Unit 384 Deerfield Beach, FL | 1.0 | 1.0 | 593 | $1,400 | $2.36 | 24d | 1 | 1.04mi |
| 5500 Pacific Blvd Boca Raton, FL | 1.0–2.0 | 1.0–2.0 | 1063 | $2,625 | $2.47 | 2d | 17 | 1.09mi |
| 5515 Pacific Blvd Boca Raton, FL | 1.0–2.0 | 1.0–2.0 | 910 | $2,608 | $2.87 | 2d | 22 | 1.15mi |
| 6 Ventnor a Deerfield Beach, FL | 1.0 | 1.0 | 600 | $1,429 | $2.38 | 24d | 1 | 1.41mi |
| 137 Farnham F Deerfield Beach, FL | 1.0 | 1.5 | 708 | $2,000 | $2.82 | 24d | 1 | 1.45mi |
| 329 Farnham P #329 Deerfield Beach, FL | 1.0 | 1.5 | 700 | $1,450 | $2.07 | 24d | 1 | 1.46mi |
| 6324 La Costa Dr Unit C Boca Raton, FL | 1.0 | 1.0 | 700 | $1,900 | $2.71 | 15d | 1 | 1.48mi |
| 137 Farnham F #137 Deerfield Beach, FL | 1.0 | 1.5 | 700 | $2,500 | $3.57 | 24d | 1 | 1.48mi |
Listing history 14 events
-
2026-06-18days on market $59,000 Active 84 DOM
-
2026-06-17days on market $59,000 Active 83 DOM
-
2026-06-16days on market $59,000 Active 82 DOM
-
2026-06-15days on market $59,000 Active 81 DOM
-
2026-06-13days on market $59,000 Active 79 DOM
-
2026-06-09days on market $59,000 Active 75 DOM
-
2026-06-08days on market $59,000 Active 74 DOM
-
2026-06-07days on market $59,000 Active 73 DOM
-
2026-06-04days on market $59,000 Active 70 DOM
-
2026-06-03days on market $59,000 Active 69 DOM
-
2026-06-02days on market $59,000 Active 68 DOM
-
2026-06-01days on market $59,000 Active 67 DOM
-
2026-05-31days on market $59,000 Active 66 DOM
-
2026-03-26$59,000 Active
ⓘ Source: listings_history table (triggers on properties + properties_extension) + one-shot
backfill from property_details.listing_events for pre-trigger history.
Tax reassessment forecast FL · Resets to sale price
- Current annual tax
- $1,528 · $127/mo
- Projected year-2 tax
- $1,528 · $127/mo
- Expected delta
- $0/yr ($0/mo · 0.0%)
ⓘ Screening estimate from a state-policy table — verify with the county assessor before closing.
Climate risk First Street
- Flood 3/10 Moderate FEMA zone AH · 10% chance over 30 yrs
- Wildfire 1/10 Low
- Heat 10/10 Extreme 7 d/yr ≥107°F today · 26 d/yr by 30 yrs out
- Wind 10/10 Extreme 99% chance of damaging wind over 30 yrs
- Air quality 2/10 Low 1 unhealthy d/yr today · 3 by 30 yrs out
Nearby sold comps map
Loading sold comps map…
Walkable amenities ~0.75 mi
Loading nearby amenities…
Taxation est. · year 1
- Rental income
- $24,985
- − Mortgage interest
- −$3,305
- − Property taxes
- −$1,528
- − Insurance
- −$2,120
- − Repairs & maintenance
- −$1,999
- − Management
- −$1,999
- − Depreciation
- −$1,716
- Taxable income
- $12,319
- Est. tax owed @ 24.0%
- −$2,957
- After-tax cash flow
- $9,422/yr
For passive investors: Depreciation is non-cash, so a rental often shows a tax loss while cash-flowing — sheltering income. Rental losses are passive: they offset passive income freely, and up to $25,000/yr can offset ordinary (W-2) income if you actively participate and your MAGI is under $100k (phasing out to $0 by $150k); unused losses carry forward. On sale, claimed depreciation is recaptured at up to 25%, and gains may owe capital-gains tax (a 1031 exchange can defer both). Figures are a year-1 estimate at your 24.0% rate — not tax advice; consult a CPA.
Schools (NCES district)
- District
- Broward
- NCES district ID
- 1200180
- Math proficiency
- 42% ▼ -18.00%
- Reading proficiency
- 53% ▼ -5.00%
- Median HH income
- $52,139
- Composite
- 40.88/100
- National rank
- #3621
- State rank
- #46 of 73 in FL
Livability — Deerfield Beach
- Score
- 75/100
- State rank
- #250
- US rank
- #3970
Category grades
Schools grade is shown separately in the Schools card above.
Census & demographics
- Census place
- Deerfield Beach, FL
- County
- Broward County · 1,963,430 people
- City population
- 61,449
- Metro
- Miami-Fort Lauderdale-Pompano Beach, FL
- Population (ZIP)
- 31,296
- Household income
- $53,254
- Rent vs Own
- Severe rent burden
- 2169.0
Population outlook (Broward County) Hauer SSP2
- Today (2025)
- 2,207,033 people
- By 2030
- 2,360,704 · +7.0%
- By 2040
- 2,661,208 · +20.6%
- By 2050
- 2,946,698 · +33.5%
- By 2075
- 3,602,273 · +63.2%
- By 2100
- 3,970,984 · +79.9%
Race, ethnicity, and origin ACS 2023
- Neighborhood character
- Diverse neighborhood (Simpson 0.61)
- Race & ethnicity
- White 57% Hispanic / Latino 23% Two or more races 19% Black 10% Asian 2%
- Hispanic origin (detail)
- Mexican 1% Puerto Rican 4% Cuban 3%
- Common ancestry
- Estonian 7% Romanian 4% Hispanic 3%
- Foreign-born
- 34% · Canada, Jamaica, Dominican Republic
- Languages at home
- 59% English-only · Spanish 20% Other Indo-European 13% French/Haitian/Cajun 4%
Political lean MEDSL · Broward
- 2024 margin
- D (+17.0) · D 58.0% · R 41.0%
- 2008→2024 swing
- -17.8pp toward R · 2008: 34.7pp · 2024: 17.0pp
- All cycles
- 2024: D+17.0 2020: D+29.8 2016: D+35.0 2012: D+34.9 2008: D+34.7
Not yet ingested
- Civics
- —
Market trends
- HPI YoY
- ▼ -280.44%
- Current HPI
- 323.0166
- Rent YoY
- ▲ 0.10%
- Metro
- Miami-Fort Lauderdale-Pompano Beach, FL
- State GDP YoY
- ▲ 3.28%
- F500 in state
- 36
Industry mix (Fortune 500 HQ in FL)
| Industry | F500 HQs | Revenue |
|---|---|---|
| Industrial Technology | 2 | $29B |
|
||
| Insurance | 2 | $17B |
|
||
| Retail | 1 | $60B |
|
||
| Technology Distribution | 1 | $58B |
|
||
| Homebuilding | 1 | $35B |
|
||
| Technology Manufacturing | 1 | $35B |
|
||
Price history
1 event — show timeline
- 2026-03-26 Listed $59,000 Beaches MLS
Property tax history
+1.8%/yrLatest (2025): $1,528 · +39.3% YoY. Source: county tax records.
Cash-flow waterfall
monthlySold comps — $/sqft
last 12 mo · ≤1 miLoading sold comps…