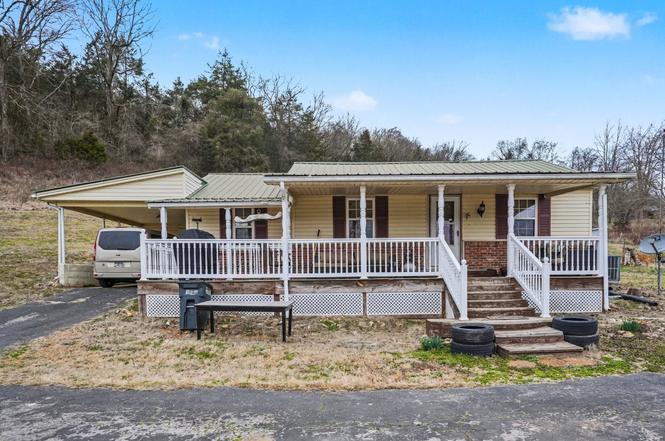
6185 Old Highway 31 East · Bransford, TN
Flood risk 1/10 · Minimal
- FEMA flood zone
- X (unshaded)
- Chance of flooding over 30 yrs
- 0.0%
- Est. flood insurance / yr
- $507 – $1,088
Fire risk 2/10 · Minimal
- Est. fire insurance / yr
- $949 – $1,763
Heat risk 6/10 · Moderate
- Hot days now (above 107°F)
- 7 days/yr
- Hot days in 30 yrs
- 21 days/yr
Wind risk 3/10 · Minor
- Chance of severe wind over 30 yrs
- 7.0%
Air-quality risk 2/10 · Minimal
- Unhealthy air days now
- 1 days/yr
- Unhealthy air days in 30 yrs
- 3 days/yr
Risk factors via First Street. Map © Google.
Why this score? — see what drove the F grade
The composite is a weighted blend of 9 inputs, each scored 0–100. Each bar is that input's sub-score; the figure is the points it added to the 100-point composite (weight × sub-score).
- Cash flow +15.7/30.0
- DSCR +4.8/10.0
- Schools +3.6/10.0
- 1% rule +3.2/10.0
- Rent growth +2.5/5.0
- Condition / age +2.5/5.0
- Livability +1.8/5.0
- ARV discount +0.0/15.0
- Appreciation +0.0/10.0
$240,000
🖨 Deal sheet 📄 Offer letter ✓ Due diligence
Listing remarks MLS
Have a wonderful homstead in Bethpage while being within 15 minutes to Gallatin and Westmoreland. This property is just over 2 acres with Plenty of outbuilding storage space and room for all the animals.
Key facts
- Private acres
- Functional kitchen
- Serene lot
Tags
Neighborhood map
What this means for you Summary
Snapshot
- This is a 3-bed/1.0-bath single-family listed at $240k.
Deal economics
- At list price, monthly cash flow is $104 ($1k/yr) — positive.
- The deal already cash-flows at list — no discount required.
- To meet the 1% rule (rent ≥ 1% of price), the offer needs to be $196k (18.4% below list).
- Recommended offer: $196k (18.4% below list) — sets the bar for 1% rule.
Location & tenants
- Location reads 35/100 on livability (#428 in TN) — a limited-amenity area; tenant pool skews transient or value-seeking. Strengths: cost of living A+, crime A; Watch: amenities F, commute F, employment F.
- Sumner County (suburban): math 44% / reading 39% proficiency, ranked #12 of 139 in TN (top 9%) — families likely to look elsewhere, expect single-tenant / working-renter base with shorter leases.
- Zoned schools: Bethpage Elementary (math 52% / reading 22%, grade F, #272 of 952 statewide, top 31%, 278 students, 0% FRL); Westmoreland High School (math 27% / reading 37%, grade F, #56 of 332 statewide, top 20%, 526 students, 0% FRL) — zoned schools average 0% FRL vs 34% district-wide (34 pts lower); this property's tenant base skews higher-income than the district average.
- Market conditions: 82 active listings in the ZIP; 1,748 units permitted in Sumner County in 2024 (124 in 5+ unit buildings).
Forward outlook
- Local home prices are declining (-3.0%/yr); year-one equity from $2k of loan paydown is wiped out by about $7k of value loss. Plan a longer hold.
- Sumner County population projected at +35% by 2050 — long-run rental-demand tailwind backs the buy-and-hold thesis.
Negotiation context
- It's been on market 47 days — a 3% lower offer ($233k) is reasonable based on typical stale-listing flexibility.
- 9 sale attempts since 10y ago with the ask held roughly flat each time — persistent listings suggest the price (not the market) is what's stuck; bring a comps-based counter.
Risks & watch-outs
- Climate carrying-cost: extreme-heat days projected 7→21/yr by 2055 (HVAC capex compounding) — expect insurance premiums to compound above CPI over the hold.
Questions for the listing agent
- It's been on market 47 days. Have you received any prior offers? Is the seller open to a 18% concession, seller financing, or rate buy-down credit?
- Built in 1960 — when were the roof, HVAC, electrical panel, plumbing, and water heater last replaced?
- Is there a deadline driving the sale (1031 exchange, divorce, estate, relocation)? That informs how much negotiation room exists.
- Schools are F-rated, which usually means shorter tenancies and higher turnover. Who's the typical renter profile here, and what's been the actual vacancy rate?
- The area grade is low — what's the realistic commute time and amenity access for the typical tenant pool here? Any planned neighborhood developments (good or bad) we should know about?
- What's the average days-on-market for RENTAL listings here right now (not sales)? A rising rental-DOM trend means longer vacancies and softer asking-rent achievability than the comps imply.
- What's the recent tenant-quality profile in this submarket — average credit score on applications, eviction rate, late-payment / NSF rate, and stable-employment percentage? A property-management company in the area should have these aggregated.
- How much new for-sale + rental construction is in the pipeline within 1–3 miles? Heavy new supply typically softens prices + rents 12–24 months out; constrained supply supports both.
Investment metrics
- 1% rule
- 0.82% ✗
- Cap rate
- 6.81%
- Cash-on-cash
- 1.85%
- DSCR
- 1.08
- GRM
- 10.2
CMA / ARV
- ARV (on-the-fly)
- $195,156
- Comps found
- 1
Show comp detail 1 sale within ~0.75 mi
| Address | Dist | Beds/Ba | Sqft | Sold | Price | $/sf | Match |
|---|---|---|---|---|---|---|---|
| 175 Haze Hyde Hollow Rd | 0.48mi | 2/1.5 (-1) | 1,292 (-8%) | 19mo | $180,000 | $139 | 41 |
Match score weights: distance 35% · size 25% · config 20% · recency 20%. Top-matched comps best support the ARV.
Projected returns pro-forma
-3.0% appreciation · 3.0% rent growth · sell at horizon
- IRR
- -13.4%
- Equity multiple
- 0.52×
- Total profit
- $-32,382
- Equity at exit
- $35,785
- IRR
- -4.6%
- Equity multiple
- 0.70×
- Total profit
- $-20,104
- Equity at exit
- $20,751
Cash invested: $67,200 (down + closing). Projections, not guarantees.
Landlord ↔ Tenant lean methodology
- Overall (STATE)
- 87 Strongly Landlord-Friendly
- State Tennessee
- 87 Strongly Landlord-Friendly · R+13
- County
- — inherits STATE
- City
- — inherits STATE
ZIP-level market 37022
- Home prices YoY
- -5.4%
- Active inventory
- 82
- Price-to-rent
- 10.2×
Monthly cashflow live
- Estimated rent
- $1,957 medium interval (Pro) →
- Mortgage (P&I)
- −$1,259
- Tax from tax record
- −$84 /mo · $1,006/yr
- Insurance
- −$100
- HOA
- −$0
- Vacancy / Maint / Mgmt
- −$411
- Net cashflow
- $104
Break-even live
UW: 25.0% down · 7.5% · 30yr · 1.5% tax · 5.0% vac · 8.0% maint · 8.0% mgmt
Financing live
Cash to close
- Down payment
- $60,000
- Closing costs
- $7,200
- Reserves months
- —
- Total cash needed
- —
Loan-product check · same deal, 3 products live
Conventional
25% down · 7.5% · 30yr
- Down + closing
- —
- Monthly P&I
- —
- Monthly cashflow
- —
- DSCR
- —
- Eligible?
- —
Personal DTI + credit; lowest rate.
DSCR
20% down · 8.5% · 30yr
- Down + closing
- —
- Monthly P&I
- —
- Monthly cashflow
- —
- DSCR
- —
- Eligible?
- —
No personal income docs; deal must DSCR.
Hard money
10% down · 12.0% · 12mo
- Down + closing
- —
- Monthly P&I
- —
- Monthly cashflow
- —
- DSCR
- —
- Eligible?
- —
Short-term bridge; refi at stabilization.
Listing history 28 events
-
2026-04-14status Pending
-
2026-03-08price $240,000
-
2026-02-26$250,000 Active
-
2022-01-10soldstatus $215,000
-
2021-12-29soldstatus $215,000 Closed 203-char remark
Show marketing remark (203 chars)
Have a wonderful homstead in Bethpage while being within 15 minutes to Gallatin and Westmoreland. This property is just over 2 acres with Plenty of outbuilding storage space and room for all the animals.
-
2021-11-18status Pending 203-char remark
Show marketing remark (203 chars)
Have a wonderful homstead in Bethpage while being within 15 minutes to Gallatin and Westmoreland. This property is just over 2 acres with Plenty of outbuilding storage space and room for all the animals.
-
2021-11-18historical
Show marketing remark (203 chars)
Have a wonderful homstead in Bethpage while being within 15 minutes to Gallatin and Westmoreland. This property is just over 2 acres with Plenty of outbuilding storage space and room for all the animals.
-
2021-11-16$219,000 Active 203-char remark
Show marketing remark (203 chars)
Have a wonderful homstead in Bethpage while being within 15 minutes to Gallatin and Westmoreland. This property is just over 2 acres with Plenty of outbuilding storage space and room for all the animals.
-
2021-10-30price $219,000
-
2021-10-07$239,900 Active
-
2019-04-29soldstatus $167,500
-
2019-03-25historical
-
2019-02-15status Active
-
2019-02-04status Pending
-
2019-01-25$174,900 Active
-
2017-04-12soldstatus $124,500
-
2017-04-10soldstatus $124,500 Closed
-
2017-02-16historical Contingent - Financing
-
2017-01-24price $124,500
-
2017-01-24status Active
-
2017-01-17historical Contingent - Inspection
-
2016-12-08status Active
-
2016-11-08historical Contingent - Financing
-
2016-09-26status Active
-
2016-09-08historical Contingent - Financing
-
2016-08-30$129,500 Active
-
2002-11-08soldstatus $89,900
-
1997-06-20soldstatus $64,750
ⓘ Source: listings_history table (triggers on properties + properties_extension) + one-shot
backfill from property_details.listing_events for pre-trigger history.
Tax reassessment forecast TN · Resets to sale price
- Current annual tax
- $1,006 · $84/mo
- Projected year-2 tax
- $1,704 · $142/mo
- Expected delta
- +$698/yr (+$58/mo · 69.4%)
ⓘ Screening estimate from a state-policy table — verify with the county assessor before closing.
Climate risk First Street
- Flood 1/10 Low FEMA zone X (unshaded) · 0% chance over 30 yrs
- Wildfire 2/10 Low
- Heat 6/10 Major 7 d/yr ≥107°F today · 21 d/yr by 30 yrs out
- Wind 3/10 Moderate 7% chance of damaging wind over 30 yrs
- Air quality 2/10 Low 1 unhealthy d/yr today · 3 by 30 yrs out
Nearby sold comps map
Loading sold comps map…
Walkable amenities ~0.75 mi
Loading nearby amenities…
Taxation est. · year 1
- Rental income
- $23,487
- − Mortgage interest
- −$13,444
- − Property taxes
- −$1,006
- − Insurance
- −$1,200
- − Repairs & maintenance
- −$1,879
- − Management
- −$1,879
- − Depreciation
- −$6,982
- Taxable loss
- −$2,902
- Est. tax savings @ 24.0%
- +$697
- After-tax cash flow
- $1,942/yr
For passive investors: Depreciation is non-cash, so a rental often shows a tax loss while cash-flowing — sheltering income. Rental losses are passive: they offset passive income freely, and up to $25,000/yr can offset ordinary (W-2) income if you actively participate and your MAGI is under $100k (phasing out to $0 by $150k); unused losses carry forward. On sale, claimed depreciation is recaptured at up to 25%, and gains may owe capital-gains tax (a 1031 exchange can defer both). Figures are a year-1 estimate at your 24.0% rate — not tax advice; consult a CPA.
Schools (NCES district)
- District
- Sumner County
- NCES district ID
- 4704020
- Math proficiency
- 44% ▼ -11.00%
- Reading proficiency
- 39% ▼ -5.00%
- Median HH income
- $56,998
- Composite
- 36.44/100
- National rank
- #4667
- State rank
- #12 of 139 in TN
Livability — Bransford
- Score
- 35/100
- State rank
- #428
- US rank
- #27740
Category grades
Schools grade is shown separately in the Schools card above.
Census & demographics
- Census place
- Bransford, TN
- Population (ZIP)
- 6,036
Population outlook (Sumner County) Hauer SSP2
- Today (2025)
- 208,284 people
- By 2030
- 223,902 · +7.5%
- By 2040
- 253,892 · +21.9%
- By 2050
- 281,199 · +35.0%
- By 2075
- 344,866 · +65.6%
- By 2100
- 384,369 · +84.5%
Race, ethnicity, and origin ACS 2023
- Neighborhood character
- Predominantly White (93%)
- Race & ethnicity
- White 93% Hispanic / Latino 4% Black 1%
- Common ancestry
- Lithuanian 2% Slovak 2% Portuguese 1%
- Foreign-born
- 2% · Canada
- Languages at home
- 96% English-only · Spanish 3% French/Haitian/Cajun 1%
Political lean MEDSL · Sumner
- 2024 margin
- Solid R (+41.8) · D 28.5% · R 70.3% · Other 1.1%
- 2008→2024 swing
- -6.9pp toward R · 2008: -34.9pp · 2024: -41.8pp
- All cycles
- 2024: R+41.8 2020: R+38.6 2016: R+45.0 2012: R+42.0 2008: R+34.9
Not yet ingested
- Civics
- —
Market trends
- HPI YoY
- ▼ -18.28%
- Current HPI
- 319.7626
- Rent YoY
- —
- Metro
- —
- State GDP YoY
- ▲ 2.78%
- F500 in state
- 22
Industry mix (Fortune 500 HQ in TN)
| Industry | F500 HQs | Revenue |
|---|---|---|
| Healthcare | 3 | $91B |
|
||
| Retail | 3 | $72B |
|
||
| Transportation / Logistics | 1 | $88B |
|
||
| Paper / Packaging | 1 | $19B |
|
||
| Insurance | 1 | $13B |
|
||
| Energy | 1 | $12B |
|
||
Price history
+270.7% since first listed28 events — show timeline
- 2026-04-14 Pending — REALTRACS as Distributed by MLS Grid
- 2026-03-08 Price Changed $240,000 REALTRACS as Distributed by MLS Grid
- 2026-02-26 Listed $250,000 REALTRACS as Distributed by MLS Grid
- 2022-01-10 Sold (Public Records) $215,000 Public Records
- 2021-12-29 Sold (MLS) $215,000 REALTRACS as Distributed by MLS Grid
- 2021-11-18 Pending — REALTRACS as Distributed by MLS Grid
- 2021-11-18 Listing Removed — REALTRACS as Distributed by MLS Grid
- 2021-11-16 Listed $219,000 REALTRACS as Distributed by MLS Grid
- 2021-10-30 Price Changed $219,000 REALTRACS as Distributed by MLS Grid
- 2021-10-07 Listed $239,900 REALTRACS as Distributed by MLS Grid
- 2019-04-29 Sold (Public Records) $167,500 Public Records
- 2019-03-25 Listing Removed — REALTRACS as Distributed by MLS Grid
- 2019-02-15 Relisted — REALTRACS as Distributed by MLS Grid
- 2019-02-04 Pending — REALTRACS as Distributed by MLS Grid
- 2019-01-25 Listed $174,900 REALTRACS as Distributed by MLS Grid
- 2017-04-12 Sold (Public Records) $124,500 Public Records
- 2017-04-10 Sold (MLS) $124,500 REALTRACS as Distributed by MLS Grid
- 2017-02-16 Contingent — REALTRACS as Distributed by MLS Grid
- 2017-01-24 Price Changed $124,500 REALTRACS as Distributed by MLS Grid
- 2017-01-24 Relisted — REALTRACS as Distributed by MLS Grid
- 2017-01-17 Contingent — REALTRACS as Distributed by MLS Grid
- 2016-12-08 Relisted — REALTRACS as Distributed by MLS Grid
- 2016-11-08 Contingent — REALTRACS as Distributed by MLS Grid
- 2016-09-26 Relisted — REALTRACS as Distributed by MLS Grid
- 2016-09-08 Contingent — REALTRACS as Distributed by MLS Grid
- 2016-08-30 Listed $129,500 REALTRACS as Distributed by MLS Grid
- 2002-11-08 Sold (Public Records) $89,900 Public Records
- 1997-06-20 Sold (Public Records) $64,750 Public Records
Property tax history
+4.5%/yrLatest (2025): $1,006 · +0.0% YoY. Source: county tax records.
Cash-flow waterfall
monthlySold comps — $/sqft
last 12 mo · ≤1 miLoading sold comps…