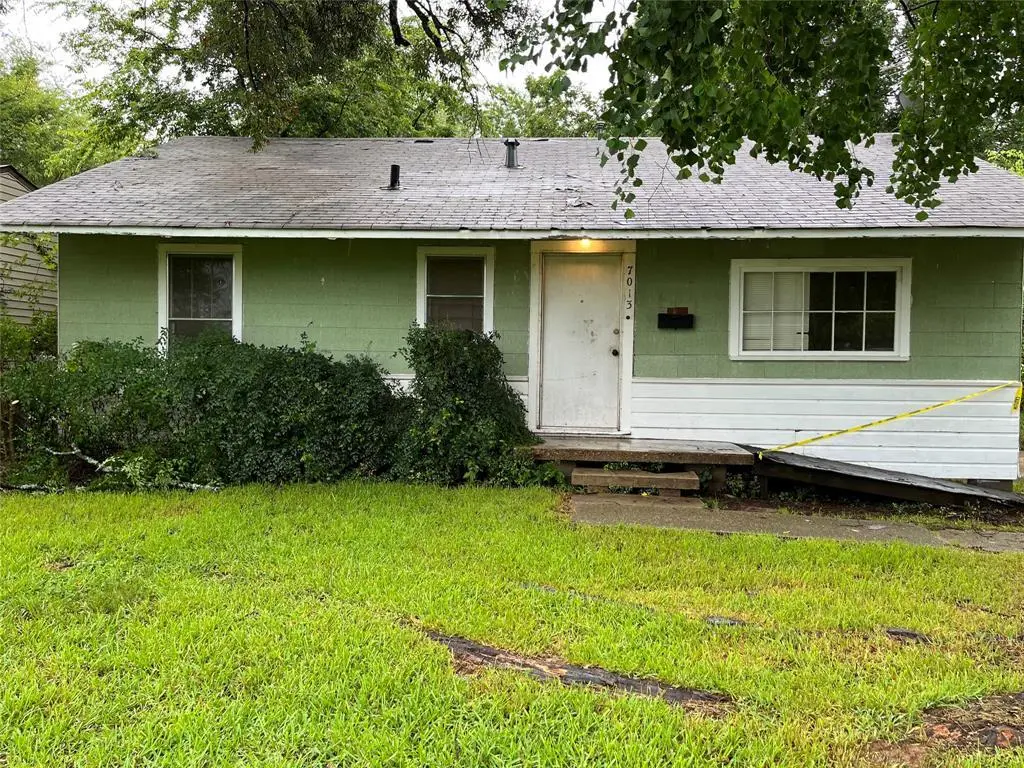
7013 Janey St · Shreveport, LA
Flood risk 1/10 · Minimal
- FEMA flood zone
- X (unshaded)
- Chance of flooding over 30 yrs
- 0.0%
- Est. flood insurance / yr
- $507 – $1,088
Fire risk 1/10 · Minimal
- Est. fire insurance / yr
- $1,269 – $2,357
Heat risk 7/10 · Major
- Hot days now (above 110°F)
- 7 days/yr
- Hot days in 30 yrs
- 21 days/yr
Wind risk 6/10 · Moderate
- Chance of severe wind over 30 yrs
- 68.0%
Air-quality risk 2/10 · Minimal
- Unhealthy air days now
- 1 days/yr
- Unhealthy air days in 30 yrs
- 1 days/yr
Risk factors via First Street. Map © Google.
Why this score? — see what drove the B+ grade
The composite is a weighted blend of 9 inputs, each scored 0–100. Each bar is that input's sub-score; the figure is the points it added to the 100-point composite (weight × sub-score).
- Cash flow +30.0/30.0
- ARV discount +15.0/15.0
- 1% rule +10.0/10.0
- DSCR +10.0/10.0
- Rent growth +3.1/5.0
- Livability +3.0/5.0
- Condition / age +2.5/5.0
- Schools +2.2/10.0
- Appreciation +0.0/10.0
$47,500
🖨 Deal sheet 📄 Offer letter ✓ Due diligence
Listing remarks MLS
Perfect home for Investor!!! Add this one to your Real Estate Portfolio. Can be sold individually or part of a package. Call for details!!
Key facts
- 7,623 sq ft lot
- Built 1950
- Listed 875 days
Neighborhood map
What this means for you Summary
Snapshot
- This is a 2-bed/1.0-bath single-family listed at $48k.
Deal economics
- At list price, monthly cash flow is $336 ($4k/yr) — positive.
- The deal already cash-flows at list — no discount required.
- Meets the 1% rule at list price ($805 rent vs $48k).
- Recommended offer: $42k (12.0% below list) — sets the bar for market timing.
- Cap rate 14.8% vs local median 5.7% in Shreveport — top-decile yield for the area; either an underpriced asset or a hidden risk that comps aren't pricing in. Stress-test before assuming the spread holds.
Location & tenants
- Location reads 59/100 on livability (#270 in LA) — a working-class tenant base; expect higher turnover. Strengths: cost of living A+, housing A; Watch: schools D+, crime F, amenities F.
- Caddo Parish (urban): math 21% / reading 32% proficiency, ranked #53 of 98 in LA (top 54%) — low school quality limits family demand, transient renter base, plan for 1-2y turnover; 64% free/reduced lunch — lower-income household profile, screen leases tightly.
- Market conditions: Rents rising (+2.4%/yr); 138 active listings in the ZIP; 7 comparable units currently listed for rent nearby; rentals at typical pace (median 21d on market — plan ~3-4 weeks tenant-placement turnaround); 43% of comp listings sitting > 30 days — soft ceiling on asking rent; lower-income renter base — watch delinquency; 221 units permitted in Caddo Parish in 2024 (0 in 5+ unit buildings).
- This rent runs 30% of the median local income ($32k/yr) — at the standard rent-burdened threshold; future hikes will face affordability resistance.
Forward outlook
- Local home prices are declining (-3.0%/yr); year-one equity from $328 of loan paydown is wiped out by about $1k of value loss. Plan a longer hold.
- Caddo County population projected at -15% by 2050 — secular population decline; favor cash flow + early exit over multi-decade hold.
- At projected returns (-3.0% appreciation + 2.4% rent growth), your $13k cash investment doubles in ~5 years — after that, you're playing with house money.
Negotiation context
- It's been on market 875 days — a 12% lower offer ($42k) is reasonable based on typical stale-listing flexibility.
- 5 sale attempts since 4y ago; this cycle's ask has dropped $8k (14%) from the opening price — seller is motivated, your offer sets the floor, not the list.
Risks & watch-outs
- Watch-outs: built in 1950 — expect roof / HVAC / electrical / plumbing capex.
- Climate carrying-cost: major wind risk, 68% chance of damaging wind over 30y; extreme-heat days projected 7→21/yr by 2055 (HVAC capex compounding) — expect insurance premiums to compound above CPI over the hold.
Questions for the listing agent
- It's been on market 875 days. Have you received any prior offers? Is the seller open to a 12% concession, seller financing, or rate buy-down credit?
- Built in 1950 — when were the roof, HVAC, electrical panel, plumbing, and water heater last replaced?
- Why hasn't it sold? Are there any deal-killer items the seller is aware of (foundation, flood, title, zoning, code violations)?
- Is there a deadline driving the sale (1031 exchange, divorce, estate, relocation)? That informs how much negotiation room exists.
- Schools are D-rated, which usually means shorter tenancies and higher turnover. Who's the typical renter profile here, and what's been the actual vacancy rate?
- Crime grade is F in this area — have there been break-ins, vandalism, or insurance claims at this property in the last 3 years? What carrier currently insures it and at what premium?
- What's the average days-on-market for RENTAL listings here right now (not sales)? A rising rental-DOM trend means longer vacancies and softer asking-rent achievability than the comps imply.
- What's the recent tenant-quality profile in this submarket — average credit score on applications, eviction rate, late-payment / NSF rate, and stable-employment percentage? A property-management company in the area should have these aggregated.
- How much new for-sale + rental construction is in the pipeline within 1–3 miles? Heavy new supply typically softens prices + rents 12–24 months out; constrained supply supports both.
Investment metrics
- 1% rule
- 1.69% ✓
- Cap rate
- 14.78%
- Cash-on-cash
- 30.32%
- DSCR
- 2.35
- GRM
- 4.9
CMA / ARV
- ARV (median comp)
- $62,729
- List price
- $47,500
- Delta
- -24.28%
- Verdict
- UNDERPRICED
- Comps
- 20 within 1.0 mi
Show comp detail 10 sales within ~0.75 mi
| Address | Dist | Beds/Ba | Sqft | Sold | Price | $/sf | Match |
|---|---|---|---|---|---|---|---|
| 7024 Penny St | 0.18mi | 2/2.0 | 985 (+5%) | 23mo | $48,000 | $49 | 60 |
| 7141 Janey St | 0.18mi | 3/1.0 (+1) | 1,050 (+12%) | 11mo | $70,000 | $67 | 57 |
| 3012 Ivy Ln | 0.62mi | 3/1.0 (+1) | 983 (+5%) | 6mo | $125,000 | $127 | 52 |
| 3027 Manson St | 0.41mi | 3/1.0 (+1) | 987 (+5%) | 19mo | $19,900 | $20 | 51 |
| 6525 Quilen Blvd | 0.51mi | 3/1.0 (+1) | 912 (-3%) | 19mo | $39,900 | $44 | 51 |
| 6809 Broadway Ave | 0.73mi | 3/1.0 (+1) | 987 (+5%) | 2mo | $75,000 | $76 | 50 |
| 7703 Lotus Ln | 0.72mi | 2/1.0 | 884 (-6%) | 15mo | $65,000 | $74 | 45 |
| 7028 Gregory St | 0.40mi | 3/1.0 (+1) | 1,042 (+11%) | 23mo | $70,000 | $67 | 39 |
| 6526 Quilen Blvd | 0.52mi | 3/1.0 (+1) | 1,049 (+12%) | 22mo | $49,500 | $47 | 32 |
| 3938 Pixley Dr | 0.74mi | 3/1.0 (+1) | 1,047 (+12%) | 14mo | $70,000 | $67 | 29 |
Match score weights: distance 35% · size 25% · config 20% · recency 20%. Top-matched comps best support the ARV.
Projected returns pro-forma
-3.0% appreciation · 2.37% rent growth · sell at horizon
- IRR
- 24.3%
- Equity multiple
- 1.99×
- Total profit
- $13,190
- Equity at exit
- $7,082
- IRR
- 31.7%
- Equity multiple
- 3.78×
- Total profit
- $36,966
- Equity at exit
- $4,107
Cash invested: $13,300 (down + closing). Projections, not guarantees.
Landlord ↔ Tenant lean methodology
- Overall (STATE)
- 90 Strongly Landlord-Friendly
- State Louisiana
- 90 Strongly Landlord-Friendly · R+12
- County
- — inherits STATE
- City
- — inherits STATE
ZIP-level market 71108
- Rents YoY
- 2.4%
- Active inventory
- 138
- Price-to-rent
- 4.9×
Monthly cashflow live
- Estimated rent
- $805 high interval (Pro) →
- Mortgage (P&I)
- −$249
- Tax from tax record
- −$31 /mo · $370/yr
- Insurance
- −$20
- HOA
- −$0
- Vacancy / Maint / Mgmt
- −$169
- Net cashflow
- $336
Break-even live
UW: 25.0% down · 7.5% · 30yr · 1.5% tax · 5.0% vac · 8.0% maint · 8.0% mgmt
Financing live
Cash to close
- Down payment
- $11,875
- Closing costs
- $1,425
- Reserves months
- —
- Total cash needed
- —
Loan-product check · same deal, 3 products live
Conventional
25% down · 7.5% · 30yr
- Down + closing
- —
- Monthly P&I
- —
- Monthly cashflow
- —
- DSCR
- —
- Eligible?
- —
Personal DTI + credit; lowest rate.
DSCR
20% down · 8.5% · 30yr
- Down + closing
- —
- Monthly P&I
- —
- Monthly cashflow
- —
- DSCR
- —
- Eligible?
- —
No personal income docs; deal must DSCR.
Hard money
10% down · 12.0% · 12mo
- Down + closing
- —
- Monthly P&I
- —
- Monthly cashflow
- —
- DSCR
- —
- Eligible?
- —
Short-term bridge; refi at stabilization.
Rent comps 7 comps
| Address | Beds | Baths | Sqft | Rent | $/sqft | DOM | Units | Dist |
|---|---|---|---|---|---|---|---|---|
| 3051 Amherst St Shreveport, LA | 3.0 | 1.0 | 994 | $595 | $0.60 | 43d | 1 | 0.45mi |
| 2762 Marquette St Shreveport, LA | 3.0 | 1.0 | 1054 | $1,000 | $0.95 | 21d | 1 | 0.79mi |
| 2721 Sunnybrook St Shreveport, LA | 3.0 | 1.0 | 913 | $1,000 | $1.10 | 43d | 1 | 0.94mi |
| 2401 1/2 Amelia Ave Shreveport, LA | 1.0 | 1.0 | 700 | $1,000 | $1.43 | 13d | 1 | 0.99mi |
| 3530 Pleasant Dr Shreveport, LA | 2.0 | 1.0 | 750 | $725 | $0.97 | 21d | 1 | 1.31mi |
| 7137 Burlingame Blvd Shreveport, LA | 3.0 | 1.5 | 1100 | $700 | $0.64 | 43d | 1 | 1.38mi |
| 7224 Union Ave Shreveport, LA | 2.0 | 1.0 | 735 | $625 | $0.85 | 13d | 1 | 1.42mi |
Listing history 33 events
-
2026-06-18days on market $47,500 Active 875 DOM
-
2026-06-17days on market $47,500 Active 874 DOM
-
2026-06-16days on market $47,500 Active 873 DOM
-
2026-06-15days on market $47,500 Active 872 DOM
-
2026-06-14days on market $47,500 Active 870 DOM
-
2026-06-13days on market $47,500 Active 869 DOM
-
2026-06-10days on market $47,500 Active 867 DOM
-
2026-06-09days on market $47,500 Active 866 DOM
-
2026-06-08days on market $47,500 Active 865 DOM
-
2026-06-07days on market $47,500 Active 864 DOM
-
2026-06-05days on market $47,500 Active 861 DOM
-
2026-06-03days on market $47,500 Active 860 DOM
-
2026-06-02days on market $47,500 Active 859 DOM
-
2026-06-01days on market $47,500 Active 858 DOM
-
2026-05-31days on market $47,500 Active 857 DOM
-
2026-05-30days on market $47,500 Active 856 DOM
-
2026-02-18soldstatus $121,157
-
2025-07-19price $47,500 138-char remark
Show marketing remark (138 chars)
Perfect home for Investor!!! Add this one to your Real Estate Portfolio. Can be sold individually or part of a package. Call for details!!
-
2025-02-28status Active 138-char remark
Show marketing remark (138 chars)
Perfect home for Investor!!! Add this one to your Real Estate Portfolio. Can be sold individually or part of a package. Call for details!!
-
2025-02-25status Pending 138-char remark
Show marketing remark (138 chars)
Perfect home for Investor!!! Add this one to your Real Estate Portfolio. Can be sold individually or part of a package. Call for details!!
-
2025-02-07price $50,000 138-char remark
Show marketing remark (138 chars)
Perfect home for Investor!!! Add this one to your Real Estate Portfolio. Can be sold individually or part of a package. Call for details!!
-
2024-01-22$55,000 Active 138-char remark
Show marketing remark (138 chars)
Perfect home for Investor!!! Add this one to your Real Estate Portfolio. Can be sold individually or part of a package. Call for details!!
-
2024-01-17historical
-
2023-08-23price $50,000
-
2023-07-19historical
-
2023-07-19status Active
-
2023-07-17$55,000
-
2023-01-25soldstatus $157,372
-
2022-09-20soldstatus Closed
-
2022-09-02status Pending
-
2022-08-11$43,990 Active
-
2008-10-08soldstatus $15,500
-
1997-08-20soldstatus
ⓘ Source: listings_history table (triggers on properties + properties_extension) + one-shot
backfill from property_details.listing_events for pre-trigger history.
Tax reassessment forecast LA · Resets to sale price
- Current annual tax
- $370 · $31/mo
- Projected year-2 tax
- $370 · $31/mo
- Expected delta
- $0/yr ($0/mo · 0.0%)
ⓘ Screening estimate from a state-policy table — verify with the county assessor before closing.
Climate risk First Street
- Flood 1/10 Low FEMA zone X (unshaded) · 0% chance over 30 yrs
- Wildfire 1/10 Low
- Heat 7/10 Severe 7 d/yr ≥110°F today · 21 d/yr by 30 yrs out
- Wind 6/10 Major 68% chance of damaging wind over 30 yrs
- Air quality 2/10 Low 1 unhealthy d/yr today · 1 by 30 yrs out
Nearby sold comps map
Loading sold comps map…
Walkable amenities ~0.75 mi
Loading nearby amenities…
Taxation est. · year 1
- Rental income
- $9,656
- − Mortgage interest
- −$2,661
- − Property taxes
- −$370
- − Insurance
- −$238
- − Repairs & maintenance
- −$772
- − Management
- −$772
- − Depreciation
- −$1,382
- Taxable income
- $3,461
- Est. tax owed @ 24.0%
- −$831
- After-tax cash flow
- $3,201/yr
For passive investors: Depreciation is non-cash, so a rental often shows a tax loss while cash-flowing — sheltering income. Rental losses are passive: they offset passive income freely, and up to $25,000/yr can offset ordinary (W-2) income if you actively participate and your MAGI is under $100k (phasing out to $0 by $150k); unused losses carry forward. On sale, claimed depreciation is recaptured at up to 25%, and gains may owe capital-gains tax (a 1031 exchange can defer both). Figures are a year-1 estimate at your 24.0% rate — not tax advice; consult a CPA.
Schools (NCES district)
- District
- Caddo Parish
- NCES district ID
- 2200300
- Math proficiency
- 21% ▼ -33.00%
- Reading proficiency
- 32% ▼ -30.00%
- Median HH income
- $39,227
- Composite
- 22.23/100
- National rank
- #8148
- State rank
- #53 of 98 in LA
Livability — Shreveport
- Score
- 59/100
- State rank
- #270
- US rank
- #19730
Category grades
Schools grade is shown separately in the Schools card above.
Census & demographics
- Census place
- Shreveport, LA
- County
- Caddo Parish · 178,536 people
- City population
- 164,123
- Metro
- Shreveport-Bossier City, LA
- Population (ZIP)
- 18,072
- Household income
- $32,055
- Rent vs Own
- Severe rent burden
- 1526.0
Population outlook (Caddo County) Hauer SSP2
- Today (2025)
- 243,190 people
- By 2030
- 237,231 · -2.5%
- By 2040
- 222,502 · -8.5%
- By 2050
- 206,516 · -15.1%
- By 2075
- 165,706 · -31.9%
- By 2100
- 122,262 · -49.7%
Race, ethnicity, and origin ACS 2023
- Neighborhood character
- Predominantly Black (83%)
- Race & ethnicity
- Black 83% White 11% Hispanic / Latino 4% Two or more races 2%
- Foreign-born
- 2% · Canada
- Languages at home
- 96% English-only · Spanish 3%
Political lean MEDSL · Caddo
- 2024 margin
- Toss-up / Even · D 51.6% · R 47.0% · Other 1.4%
- 2008→2024 swing
- +1.6pp toward D · 2008: 3.0pp · 2024: 4.6pp
- All cycles
- 2024: D+4.6 2020: D+6.8 2016: D+4.2 2012: D+4.9 2008: D+3.0
Not yet ingested
- Civics
- —
Market trends
- HPI YoY
- ▼ -58.98%
- Current HPI
- 58.1377
- Rent YoY
- ▲ 2.37%
- Metro
- Shreveport-Bossier City, LA
- State GDP YoY
- ▲ 3.29%
- F500 in state
- 10
Industry mix (Fortune 500 HQ in LA)
| Industry | F500 HQs | Revenue |
|---|---|---|
| Telecommunications | 2 | $23B |
|
||
| Utilities | 1 | $12B |
|
||
| Wholesale / Distribution | 1 | $5B |
|
||
| Advertising | 1 | $2B |
|
||
Price history
+681.7% since first listed17 events — show timeline
- 2026-02-18 Sold (Public Records) $121,157 Public Records
- 2025-07-19 Price Changed $47,500 NTREIS
- 2025-02-28 Relisted — NTREIS
- 2025-02-25 Pending — NTREIS
- 2025-02-07 Price Changed $50,000 NTREIS
- 2024-01-22 Listed $55,000 NTREIS
- 2024-01-17 Listing Removed — NTREIS
- 2023-08-23 Price Changed $50,000 NTREIS
- 2023-07-19 Listing Removed — NTREIS
- 2023-07-19 Relisted — NTREIS
- 2023-07-17 Listed $55,000 NTREIS
- 2023-01-25 Sold (Public Records) $157,372 Public Records
- 2022-09-20 Sold (MLS) — NTREIS
- 2022-09-02 Pending — NTREIS
- 2022-08-11 Listed $43,990 NTREIS
- 2008-10-08 Sold (Public Records) $15,500 Public Records
- 1997-08-20 Sold (Public Records) — Public Records
Property tax history
-2.4%/yrLatest (2025): $370 · +0.4% YoY. Source: county tax records.
Cash-flow waterfall
monthlySold comps — $/sqft
last 12 mo · ≤1 miLoading sold comps…