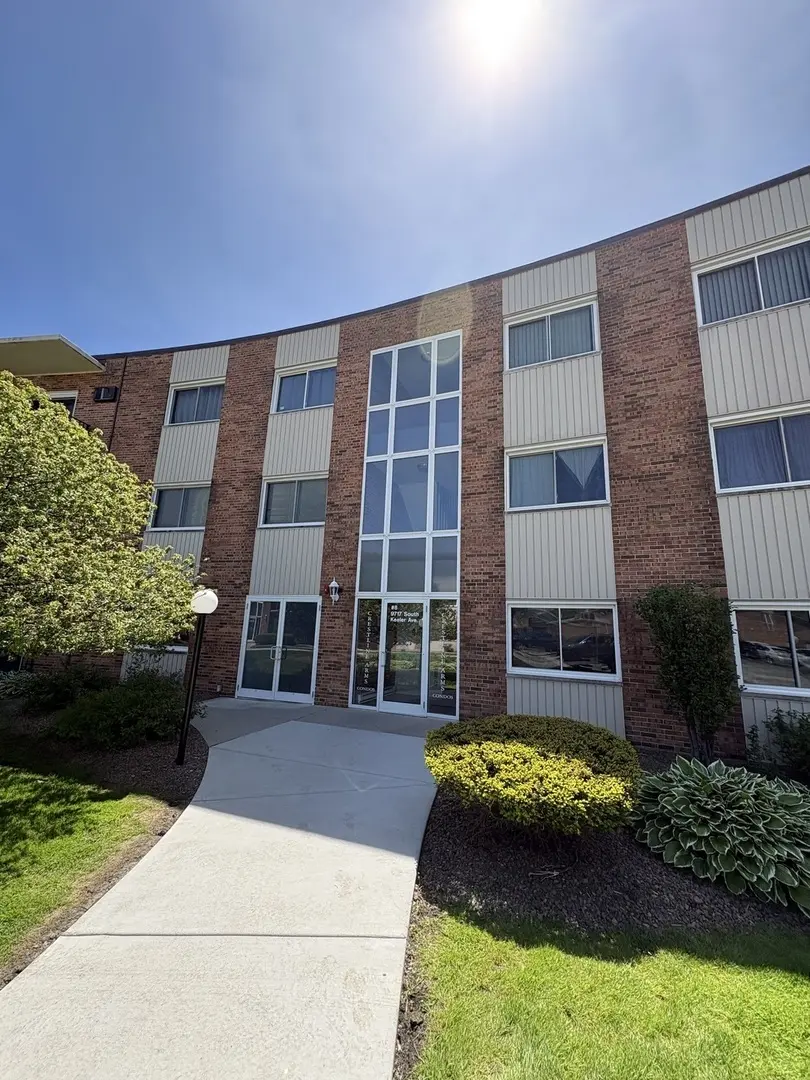
9717 S Keeler Ave #110 · Oak Lawn, IL
Flood risk 1/10 · Minimal
- FEMA flood zone
- X (unshaded)
- Chance of flooding over 30 yrs
- 0.0%
- Est. flood insurance / yr
- $507 – $1,088
Fire risk 1/10 · Minimal
- Est. fire insurance / yr
- $804 – $1,492
Heat risk 3/10 · Minor
- Hot days now (above 102°F)
- 7 days/yr
- Hot days in 30 yrs
- 15 days/yr
Wind risk 2/10 · Minimal
- Chance of severe wind over 30 yrs
- —
Air-quality risk 4/10 · Minor
- Unhealthy air days now
- 4 days/yr
- Unhealthy air days in 30 yrs
- 6 days/yr
Risk factors via First Street. Map © Google.
Why this score? — see what drove the D grade
The composite is a weighted blend of 9 inputs, each scored 0–100. Each bar is that input's sub-score; the figure is the points it added to the 100-point composite (weight × sub-score).
- Cash flow +12.8/30.0
- ARV discount +7.5/15.0
- 1% rule +5.1/10.0
- Rent growth +4.6/5.0
- Livability +4.0/5.0
- DSCR +3.8/10.0
- Condition / age +2.5/5.0
- Schools +1.9/10.0
- Appreciation +0.0/10.0
$179,000
🖨 Deal sheet (PDF) 📄 Offer letter ✓ Due diligence
Listing remarks
Ground-level corner 2 bed, 2 bath condo offering great value and strong investment potential. Unit features low taxes, low monthly HOA of $252, and no upcoming special assessments. Enjoy convenient unassigned parking, peaceful courtyard views, electric baseboard heat, and wall-unit A/C. Easy to show - text or email for the video tour link. For the Ultimate Southside commuter: Convenient access to major roadways including I-294 and nearby public transportation, with Metra service just minutes away for an easy downtown commute. Shopping: Close to everyday conveniences including Amazon Fresh, Jewels, Target, Pete's Fresh Market, and multiple shopping centers along 95th Street. Entertainment: M
Key facts
- Convenient access
- Ground-level corner
- $252 HOA
Tags
Neighborhood map
What this means for you Summary
Snapshot
- This is a 2-bed/2.0-bath condo listed at $179k.
Deal economics
- At list price, monthly cash flow is $-15 ($-184/yr) — negative.
- To cash-flow at today's rent, offer at most $176k (1.5% below list).
- Meets the 1% rule at list price ($2k rent vs $179k).
- Recommended offer: $174k (3.0% below list) — sets the bar for market timing.
- Cap rate 6.2% vs local median 4.4% in Oak Lawn — top-decile yield for the area; either an underpriced asset or a hidden risk that comps aren't pricing in. Stress-test before assuming the spread holds.
Location & tenants
- Location reads 80/100 on livability (#102 in IL, #1,614 nationally) — a professional / high-income tenant draw. Strengths: commute A+, housing A+, employment A-.
- Oak Lawn Chsd 229 (suburban): math 22% / reading 21% proficiency, ranked #384 of 620 in IL (top 62%) — low school quality limits family demand, transient renter base, plan for 1-2y turnover.
- Zoned schools: J M Hannum Elem School (math 17% / reading 27%, grade F, #940 of 2,056 statewide, top 49%, 416 students, 0% FRL); Oak Lawn-Hometown Middle Sch (math 20% / reading 21%, grade F, #410 of 665 statewide, top 62%, 1,121 students, 0% FRL); Oak Lawn Comm High School (math 22% / reading 21%, grade F, #345 of 693 statewide, top 50%, 1,834 students, 0% FRL).
- Market conditions: Rents rising fast (+8.2%/yr); 189 active listings in the ZIP; 16 comparable units currently listed for rent nearby; rentals leasing fast (median 12d on market — plan ~1-2 weeks tenant-placement turnaround); solid renter incomes; 6,272 units permitted in Cook County in 2024 (4,658 in 5+ unit buildings).
Forward outlook
- Local home prices are declining (-3.0%/yr); year-one equity from $1k of loan paydown is wiped out by about $5k of value loss. Plan a longer hold.
Negotiation context
- It's been on market 38 days — a 3% lower offer ($174k) is reasonable based on typical stale-listing flexibility.
Questions for the listing agent
- What do current leases actually rent for vs. the listed asking? Can we see a recent rent roll and the last 12 months of T-12 income?
- It's been on market 38 days. Have you received any prior offers? Is the seller open to a 3% concession, seller financing, or rate buy-down credit?
- Built in 1969 — when were the roof, HVAC, electrical panel, plumbing, and water heater last replaced?
- What does the HOA fee cover, when was the last increase, and are there any pending special assessments or reserve-fund shortfalls?
- Any open or pending special assessments — roof, HVAC, plumbing, elevator, façade? What's the per-unit balance and payoff schedule, and is the seller paying it off at close or rolling it to the buyer?
- Is there a deadline driving the sale (1031 exchange, divorce, estate, relocation)? That informs how much negotiation room exists.
- The area grade is low — what's the realistic commute time and amenity access for the typical tenant pool here? Any planned neighborhood developments (good or bad) we should know about?
- What's the average days-on-market for RENTAL listings here right now (not sales)? A rising rental-DOM trend means longer vacancies and softer asking-rent achievability than the comps imply.
- What's the recent tenant-quality profile in this submarket — average credit score on applications, eviction rate, late-payment / NSF rate, and stable-employment percentage? A property-management company in the area should have these aggregated.
- How much new apartment / multifamily construction is in the pipeline within 1–3 miles? Heavy new supply (>2% of stock underway) typically softens rents 12–24 months out; light construction supports rent growth.
Investment metrics
- 1% rule
- 1.01% ✓
- Cap rate
- 6.19%
- Cash-on-cash
- -0.37%
- DSCR
- 0.98
- GRM
- 8.3
CMA / ARV
No comps found within radius.
Projected returns pro-forma
-3.0% appreciation · 8.0% rent growth · sell at horizon
- IRR
- -10.5%
- Equity multiple
- 0.59×
- Total profit
- $-20,306
- Equity at exit
- $26,689
- IRR
- 5.4%
- Equity multiple
- 1.50×
- Total profit
- $25,024
- Equity at exit
- $15,477
Cash invested: $50,120 (down + closing). Projections, not guarantees.
Landlord ↔ Tenant lean methodology
- Overall (STATE)
- 43 Moderately Tenant-Leaning
- State Illinois
- 43 Moderately Tenant-Leaning · D+7
- County
- — inherits STATE
- City
- — inherits STATE
ZIP-level market 60453
- Rents YoY
- 8.2%
- Active inventory
- 189
- Price-to-rent
- 8.3×
Monthly cashflow live
- Estimated rent
- $1,802 high interval (Pro) →
- Mortgage (P&I)
- −$939
- Tax from tax record
- −$174 /mo · $2,084/yr
- Insurance
- −$75
- HOA
- −$252
- Vacancy / Maint / Mgmt
- −$378
- Net cashflow
- $-15
Break-even live
Sensitivity live
| Price | -10% $86 | -5% $35 | +0% $-15 | +5% $-66 | +10% $-117 |
|---|---|---|---|---|---|
| Rent | -10% $-158 | -5% $-86 | +0% $-15 | +5% $56 | +10% $127 |
| Rate | -1.0pp $75 | -0.5pp $30 | base $-15 | +0.5pp $-62 | +1.0pp $-109 |
UW: 25.0% down · 7.5% · 30yr · 1.5% tax · 5.0% vac · 8.0% maint · 8.0% mgmt
Financing live
Cash to close
- Down payment
- $44,750
- Closing costs
- $5,370
- Reserves months
- —
- Total cash needed
- —
Loan-product check · same deal, 3 products live
Conventional
25% down · 7.5% · 30yr
- Down + closing
- —
- Monthly P&I
- —
- Monthly cashflow
- —
- DSCR
- —
- Eligible?
- —
Personal DTI + credit; lowest rate.
DSCR
20% down · 8.5% · 30yr
- Down + closing
- —
- Monthly P&I
- —
- Monthly cashflow
- —
- DSCR
- —
- Eligible?
- —
No personal income docs; deal must DSCR.
Hard money
10% down · 12.0% · 12mo
- Down + closing
- —
- Monthly P&I
- —
- Monthly cashflow
- —
- DSCR
- —
- Eligible?
- —
Short-term bridge; refi at stabilization.
Rent comps 16 comps
| Address | Beds | Baths | Sqft | Rent | $/sqft | DOM | Units | Dist |
|---|---|---|---|---|---|---|---|---|
| 9600 S Komensky Ave Oak Lawn, IL | 2.0 | 2.0 | 900 | $1,800 | $2.00 | 26d | 1 | 0.20mi |
| 9515 S Kildare Ave Oak Lawn, IL | 1.0 | 1.0 | 950 | $1,275 | $1.34 | 26d | 1 | 0.30mi |
| 9957 S Cicero Ave Unit 308 Oak Lawn, IL | 2.0 | 1.0 | 1000 | $1,799 | $1.80 | 3d | 1 | 0.82mi |
| 9955 S Cicero Ave Oak Lawn, IL | 2.0 | 1.0 | 1000 | $1,799 | $1.80 | 3d | 1 | 0.84mi |
| 4134 W 90th St Hometown, IL | 2.0 | 1.0 | 740 | $1,500 | $2.03 | 22d | 1 | 0.91mi |
| 9305 S Homan Ave Unit 1 Evergreen Park, IL | 3.0 | 1.0 | 893 | $2,195 | $2.46 | 18d | 1 | 1.11mi |
| 10435 S Keating Ave Apt 3N Oak Lawn, IL | 2.0 | 1.0 | 1080 | $1,650 | $1.53 | 3d | 1 | 1.18mi |
| 10439 S Drake Ave Chicago, IL | 3.0 | 1.5 | 1165 | $3,000 | $2.58 | 0d | 1 | 1.20mi |
| 5100 W 96th St Oak Lawn, IL | 2.0 | 2.0 | 1380 | $2,350 | $1.70 | 5d | 1 | 1.23mi |
| 9739 S Kedzie Ave Evergreen Park, IL | 1.0–2.0 | 1.0 | 825 | $1,700 | $2.06 | 1d | 1 | 1.23mi |
| 10701 S Keating Ave Unit 3D Oak Lawn, IL | 2.0 | 1.0 | 800 | $1,700 | $2.12 | 0d | 1 | 1.42mi |
| 10716 Kilpatrick Ave Unit 2SW Oak Lawn, IL | 2.0 | 1.0 | 1150 | $1,650 | $1.43 | 21d | 1 | 1.43mi |
| 4116 W 109th St Oak Lawn, IL | 3.0 | 1.5 | 1200 | $2,650 | $2.21 | 0d | 1 | 1.43mi |
| 9522 S 53rd Ave Unit 1N Oak Lawn, IL | 2.0 | 1.0 | 900 | $2,150 | $2.39 | 12d | 1 | 1.48mi |
| 9522 S 53rd Ave Unit 1S Oak Lawn, IL | 1.0 | 1.0 | 800 | $1,900 | $2.38 | 26d | 1 | 1.48mi |
| 9522 S 53rd Ave Unit 3S Oak Lawn, IL | 2.0 | 1.0 | 900 | $2,150 | $2.39 | 26d | 1 | 1.48mi |
HOA detail condo
- Monthly dues
- $252 · $3,024/yr
- Likely covers
- electricparking
- Assessments
- None detected in remarks — confirm with the listing agent.
Listing history 16 events
-
2026-06-21days on market $179,000 Active 38 DOM
-
2026-06-18days on market $179,000 Active 35 DOM
-
2026-06-17days on market $179,000 Active 34 DOM
-
2026-06-16days on market $179,000 Active 33 DOM
-
2026-06-15days on market $179,000 Active 32 DOM
-
2026-06-13days on market $179,000 Active 30 DOM
-
2026-06-13days on market $179,000 Active 29 DOM
-
2026-06-09days on market $179,000 Active 26 DOM
-
2026-06-08days on market $179,000 Active 25 DOM
-
2026-06-07days on market $179,000 Active 24 DOM
-
2026-06-04days on market $179,000 Active 21 DOM
-
2026-06-03days on market $179,000 Active 20 DOM
-
2026-06-02days on market $179,000 Active 19 DOM
-
2026-06-01days on market $179,000 Active 18 DOM
-
2026-05-31days on market $179,000 Active 17 DOM
-
2026-05-14$179,000 Active
ⓘ Source: listings_history table (triggers on properties + properties_extension) + one-shot
backfill from property_details.listing_events for pre-trigger history.
Tax reassessment forecast IL · Partial reset (capped growth)
- Current annual tax
- $2,084 · $174/mo
- Projected year-2 tax
- $3,074 · $256/mo
- Expected delta
- +$989/yr (+$82/mo · 47.5%)
ⓘ Screening estimate from a state-policy table — verify with the county assessor before closing.
Climate risk First Street
- Flood 1/10 Low FEMA zone X (unshaded) · 0% chance over 30 yrs
- Wildfire 1/10 Low
- Heat 3/10 Moderate 7 d/yr ≥102°F today · 15 d/yr by 30 yrs out
- Wind 2/10 Low
- Air quality 4/10 Moderate 4 unhealthy d/yr today · 6 by 30 yrs out
Nearby sold comps map
Loading sold comps map…
Walkable amenities ~0.75 mi
Loading nearby amenities…
Taxation est. · year 1
- Rental income
- $21,625
- − Mortgage interest
- −$10,027
- − Property taxes
- −$2,084
- − Insurance
- −$895
- − Repairs & maintenance
- −$1,730
- − Management
- −$1,730
- − HOA
- −$3,024
- − Depreciation
- −$5,207
- Taxable loss
- −$3,072
- Est. tax savings @ 24.0%
- +$737
- After-tax cash flow
- $554/yr
For passive investors: Depreciation is non-cash, so a rental often shows a tax loss while cash-flowing — sheltering income. Rental losses are passive: they offset passive income freely, and up to $25,000/yr can offset ordinary (W-2) income if you actively participate and your MAGI is under $100k (phasing out to $0 by $150k); unused losses carry forward. On sale, claimed depreciation is recaptured at up to 25%, and gains may owe capital-gains tax (a 1031 exchange can defer both). Figures are a year-1 estimate at your 24.0% rate — not tax advice; consult a CPA.
Schools (NCES district)
- District
- Oak Lawn Chsd 229
- NCES district ID
- 1729220
- Math proficiency
- 22% ▼ -4.00%
- Reading proficiency
- 21% ▼ -4.00%
- Median HH income
- $52,505
- Composite
- 19.41/100
- National rank
- #8777
- State rank
- #384 of 620 in IL
Livability — Oak Lawn
- Score
- 80/100
- State rank
- #102
- US rank
- #1614
Category grades
Schools grade is shown separately in the Schools card above.
Census & demographics
- Census place
- Oak Lawn, IL
- County
- Cook County · 4,486,803 people
- City population
- 56,861
- Metro
- Chicago-Naperville-Elgin, IL-IN-WI
- Population (ZIP)
- 56,861
- Household income
- $83,911
- Rent vs Own
- Severe rent burden
- 827.0
Population outlook (Cook County) Hauer SSP2
- Today (2025)
- 5,347,519 people
- By 2030
- 5,357,703 · +0.2%
- By 2040
- 5,324,924 · -0.4%
- By 2050
- 5,230,762 · -2.2%
- By 2075
- 4,785,735 · -10.5%
- By 2100
- 4,188,836 · -21.7%
Race, ethnicity, and origin ACS 2023
- Neighborhood character
- Majority White (64%)
- Race & ethnicity
- White 64% Hispanic / Latino 24% Two or more races 9% Black 8% Asian 2%
- Hispanic origin (detail)
- Mexican 21%
- Common ancestry
- Romanian 16% Iranian 1% Armenian 1%
- Foreign-born
- 16% · Canada, Vietnam
- Languages at home
- 70% English-only · Spanish 17% Russian/Polish/Slavic 5% Arabic 4%
Political lean MEDSL · Cook
- 2024 margin
- Solid D (+42.0) · D 70.4% · R 28.4% · Other 1.2%
- 2008→2024 swing
- -11.4pp toward R · 2008: 53.4pp · 2024: 42.0pp
- All cycles
- 2024: D+42.0 2020: D+50.3 2016: D+53.0 2012: D+49.4 2008: D+53.4
Not yet ingested
- Civics
- —
Market trends
- HPI YoY
- ▼ -259.83%
- Current HPI
- 214.6977
- Rent YoY
- ▲ 8.23%
- Metro
- Chicago-Naperville-Elgin, IL-IN-WI
- State GDP YoY
- ▲ 1.59%
- F500 in state
- 60
Industry mix (Fortune 500 HQ in IL)
| Industry | F500 HQs | Revenue |
|---|---|---|
| Insurance | 4 | $201B |
|
||
| Consumer Goods | 4 | $87B |
|
||
| Industrial Machinery | 3 | $64B |
|
||
| Healthcare | 2 | $55B |
|
||
| Retail / Pharmacy | 1 | $148B |
|
||
| Agriculture / Food | 1 | $86B |
|
||
Price history
1 event — show timeline
- 2026-05-14 Listed $179,000 MRED as Distributed by MLS Grid
Property tax history
+4.4%/yrLatest (2023): $2,084 · +129.8% YoY. Source: county tax records.
Cash-flow waterfall
monthlySold comps — $/sqft
last 12 mo · ≤1 miLoading sold comps…