 🏗️ New Construction
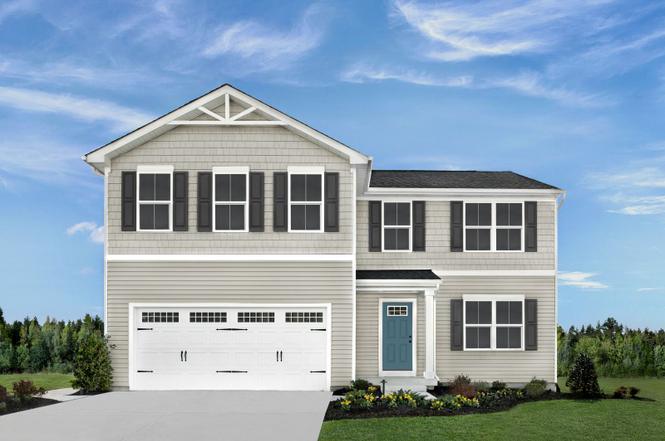
Elder Plan · Barboursville, VA
Flood risk No data
- FEMA flood zone
- —
- Chance of flooding over 30 yrs
- —
- Est. flood insurance / yr
- —
Fire risk No data
- Est. fire insurance / yr
- —
Heat risk No data
- Hot days now (above threshold)
- —
- Hot days in 30 yrs
- —
Wind risk No data
- Chance of severe wind over 30 yrs
- —
Air-quality risk No data
- Unhealthy air days now
- —
- Unhealthy air days in 30 yrs
- —
Risk factors via First Street. Map © Google.
Why this score? — see what drove the F grade
The composite is a weighted blend of 9 inputs, each scored 0–100. Each bar is that input's sub-score; the figure is the points it added to the 100-point composite (weight × sub-score).
- Cash flow +7.9/30.0
- ARV discount +7.5/15.0
- Schools +4.5/10.0
- Rent growth +2.5/5.0
- Livability +2.5/5.0
- Condition / age +2.5/5.0
- 1% rule +2.4/10.0
- DSCR +2.0/10.0
- Appreciation +0.0/10.0
$419,990
🖨 Deal sheet (PDF) 📄 Offer letter ✓ Due diligence
Listing remarks
Creekside 2-Story: resort-style, amenity-filled community of two-story single-family homes with 2-car garages, less than 10 minutes from Charlottesville. The Elder has it all. Step inside this 2-car garage single-family home, where a sprawling great room adjoins a gourmet kitchen with a large island that overlooks the dining area. A versatile flex room is ideal for a home office, hobby area or play space. Upstairs, two guest bedrooms each feature a walk-in closet and share a hall bath with a third guest bedroom. Inside your owner's suite, you'll find a luxurious dual-vanity bath and two walk-in closets. Entertain family and guests in the 2nd floor loft, or choose to convert the space to a f
Key facts
- Walk-in closet
- Gourmet kitchen
- Dual-vanity bath
Tags
Neighborhood map
What this means for you Summary
Snapshot
- This is a 5-bed/2.5-bath single-family listed at $420k.
Deal economics
- At list price, monthly cash flow is $-496 ($-6k/yr) — negative.
- To cash-flow at today's rent, offer at most $393k (6.5% below list).
- To meet the 1% rule (rent ≥ 1% of price), the offer needs to be $343k (18.2% below list).
- Recommended offer: $343k (18.2% below list) — sets the bar for 1% rule.
Location & tenants
- Location reads: area grade F — affects rentability + tenant quality, not the cash-flow math above.
- Greene County Public School District (town): math 40% / reading 64% proficiency, ranked #88 of 131 in VA (top 67%) — acceptable for families but not a draw, mixed tenant base, ~2y average lease.
- Zoned schools: Ruckersville Elementary (math 54% / reading 62%, grade C+, #583 of 1,108 statewide, top 53%, 506 students, 68% FRL); William Monroe Middle (math 36% / reading 65%, grade C, #226 of 342 statewide, top 67%, 675 students, 67% FRL); William Monroe High (math 40% / reading 78%, grade C+, #256 of 319 statewide, top 81%, 957 students, 67% FRL) — zoned schools average 68% FRL vs 32% district-wide (36 pts higher); higher-poverty schools than district average — tighter screening recommended.
- Market conditions: 185 active listings in the ZIP; 3 comparable units currently listed for rent nearby; rentals at typical pace (median 15d on market — plan ~3-4 weeks tenant-placement turnaround); high-income renter base; 204 units permitted in Greene County in 2024 (34 in 5+ unit buildings).
- This rent runs 35% of the median local income ($118k/yr) — at the standard rent-burdened threshold; future hikes will face affordability resistance.
Forward outlook
- Local home prices are declining (-3.0%/yr); year-one equity from $3k of loan paydown is wiped out by about $14k of value loss. Plan a longer hold.
- Greene County population projected at +6% by 2050 — modest demand growth; plan on rents tracking national, not racing it.
Negotiation context
- It's been on market 336 days — a 12% lower offer ($370k) is reasonable based on typical stale-listing flexibility.
Questions for the listing agent
- What do current leases actually rent for vs. the listed asking? Can we see a recent rent roll and the last 12 months of T-12 income?
- It's been on market 336 days. Have you received any prior offers? Is the seller open to a 18% concession, seller financing, or rate buy-down credit?
- Why hasn't it sold? Are there any deal-killer items the seller is aware of (foundation, flood, title, zoning, code violations)?
- Is there a deadline driving the sale (1031 exchange, divorce, estate, relocation)? That informs how much negotiation room exists.
- The area grade is low — what's the realistic commute time and amenity access for the typical tenant pool here? Any planned neighborhood developments (good or bad) we should know about?
- What's the average days-on-market for RENTAL listings here right now (not sales)? A rising rental-DOM trend means longer vacancies and softer asking-rent achievability than the comps imply.
- What's the recent tenant-quality profile in this submarket — average credit score on applications, eviction rate, late-payment / NSF rate, and stable-employment percentage? A property-management company in the area should have these aggregated.
- How much new for-sale + rental construction is in the pipeline within 1–3 miles? Heavy new supply typically softens prices + rents 12–24 months out; constrained supply supports both.
Investment metrics
- 1% rule
- 0.74% ✗
- Cap rate
- 5.01%
- Cash-on-cash
- -4.58%
- DSCR
- 0.80
- GRM
- 11.3
CMA / ARV
- ARV (median comp)
- $464,466
- List price
- $419,990
- Delta
- -9.58%
- Verdict
- FAIR
- Comps
- 20 within 1.0 mi
Show comp detail 12 sales within ~0.75 mi
| Address | Dist | Beds/Ba | Sqft | Sold | Price | $/sf | Match |
|---|---|---|---|---|---|---|---|
| 57 Everglades Rd | 0.26mi | 4/2.5 (-1) | 2,203 (0%) | 6mo | $480,320 | $218 | 78 |
| 94 Everglades Rd | 0.11mi | 4/2.5 (-1) | 1,903 (-14%) | 4mo | $424,760 | $223 | 64 |
| 140 Gunnison Dr | 0.16mi | 4/3.0 (-1) | 1,925 (-13%) | 2mo | $465,000 | $242 | 63 |
| 56 Everglades Rd | 0.15mi | 4/2.5 (-1) | 1,903 (-14%) | 6mo | $445,065 | $234 | 60 |
| 77 Everglades Rd | 0.16mi | 4/2.5 (-1) | 1,903 (-14%) | 6mo | $451,130 | $237 | 60 |
| 195 Arches Ln | 0.16mi | 4/2.5 (-1) | 1,903 (-14%) | 6mo | $411,325 | $216 | 60 |
| 27 Everglades Rd | 0.28mi | 4/2.5 (-1) | 1,903 (-14%) | 2mo | $416,980 | $219 | 58 |
| 47 Everglades Rd | 0.30mi | 4/2.5 (-1) | 1,903 (-14%) | 2mo | $421,480 | $221 | 57 |
| 107 Everglades Rd | 0.30mi | 4/2.5 (-1) | 1,903 (-14%) | 3mo | $435,310 | $229 | 56 |
| 92 Everglades Rd | 0.31mi | 4/2.5 (-1) | 1,903 (-14%) | 3mo | $419,990 | $221 | 55 |
| 82 Everglades Rd | 0.31mi | 4/2.5 (-1) | 1,903 (-14%) | 4mo | $451,815 | $237 | 54 |
| 87 Everglades Rd | 0.35mi | 4/2.5 (-1) | 1,903 (-14%) | 4mo | $438,055 | $230 | 52 |
Match score weights: distance 35% · size 25% · config 20% · recency 20%. Top-matched comps best support the ARV.
Projected returns pro-forma
-3.0% appreciation · 3.0% rent growth · sell at horizon
- IRR
- -24.0%
- Equity multiple
- 0.18×
- Total profit
- $-106,814
- Equity at exit
- $69,253
- IRR
- -19.2%
- Equity multiple
- -0.03×
- Total profit
- $-133,494
- Equity at exit
- $40,159
Cash invested: $130,050 (down + closing). Projections, not guarantees.
Landlord ↔ Tenant lean methodology
- Overall (STATE)
- 55 Moderately Landlord-Leaning
- State Virginia
- 55 Moderately Landlord-Leaning · D+2
- County
- — inherits STATE
- City
- — inherits STATE
ZIP-level market 22923
- Home prices YoY
- -3.6%
- Active inventory
- 185
- Price-to-rent
- 10.2×
Monthly cashflow live
- Estimated rent
- $3,435 medium interval (Pro) →
- Mortgage (P&I)
- −$2,436
- Tax est. 1.5%
- −$581 /mo · $6,967/yr
- Insurance
- −$194
- HOA
- −$0
- Vacancy / Maint / Mgmt
- −$721
- Net cashflow
- $-496
Break-even live
Sensitivity live
| Price | -10% $-175 | -5% $-336 | +0% $-496 | +5% $-657 | +10% $-817 |
|---|---|---|---|---|---|
| Rent | -10% $-768 | -5% $-632 | +0% $-496 | +5% $-361 | +10% $-225 |
| Rate | -1.0pp $-262 | -0.5pp $-378 | base $-496 | +0.5pp $-617 | +1.0pp $-739 |
UW: 25.0% down · 7.5% · 30yr · 1.5% tax · 5.0% vac · 8.0% maint · 8.0% mgmt
Financing live
Cash to close
- Down payment
- $116,116
- Closing costs
- $13,934
- Reserves months
- —
- Total cash needed
- —
Loan-product check · same deal, 3 products live
Conventional
25% down · 7.5% · 30yr
- Down + closing
- —
- Monthly P&I
- —
- Monthly cashflow
- —
- DSCR
- —
- Eligible?
- —
Personal DTI + credit; lowest rate.
DSCR
20% down · 8.5% · 30yr
- Down + closing
- —
- Monthly P&I
- —
- Monthly cashflow
- —
- DSCR
- —
- Eligible?
- —
No personal income docs; deal must DSCR.
Hard money
10% down · 12.0% · 12mo
- Down + closing
- —
- Monthly P&I
- —
- Monthly cashflow
- —
- DSCR
- —
- Eligible?
- —
Short-term bridge; refi at stabilization.
Rent comps 3 comps
| Address | Beds | Baths | Sqft | Rent | $/sqft | DOM | Units | Dist |
|---|---|---|---|---|---|---|---|---|
| 92 Everglades RD Barboursville, VA | 4.0 | 2.5 | 1903 | $2,795 | $1.47 | 14d | 1 | 0.31mi |
| 54 Mannie Ct Barboursville, VA | 4.0 | 2.0 | 1680 | $2,600 | $1.55 | 14d | 1 | 0.76mi |
| 100 Fir Tree Ln Barboursville, VA | 4.0 | 2.5 | 2802 | $3,100 | $1.11 | 7d | 1 | 1.22mi |
Listing history 18 events
-
2026-06-22days on market $419,990 Active 336 DOM
-
2026-06-19days on market $419,990 Active 334 DOM
-
2026-06-18days on market $419,990 Active 333 DOM
-
2026-06-17days on market $419,990 Active 332 DOM
-
2026-06-16days on market $419,990 Active 331 DOM
-
2026-06-15pricedays on market $419,990 Active 330 DOM
-
2026-06-14days on market $414,990 Active 328 DOM
-
2026-06-13days on market $414,990 Active 327 DOM
-
2026-06-10days on market $414,990 Active 325 DOM
-
2026-06-09days on market $414,990 Active 324 DOM
-
2026-06-08days on market $414,990 Active 323 DOM
-
2026-06-07days on market $414,990 Active 322 DOM
-
2026-06-05days on market $414,990 Active 319 DOM
-
2026-06-03days on market $414,990 Active 318 DOM
-
2026-06-02days on market $414,990 Active 317 DOM
-
2026-06-01days on market $414,990 Active 316 DOM
-
2026-05-31pricedays on market $414,990 Active 315 DOM
-
2026-05-30days on market $399,990 Active 314 DOM
ⓘ Source: listings_history table (triggers on properties + properties_extension) + one-shot
backfill from property_details.listing_events for pre-trigger history.
Nearby sold comps map
Loading sold comps map…
Walkable amenities ~0.75 mi
Loading nearby amenities…
Taxation est. · year 1
- Rental income
- $41,220
- − Mortgage interest
- −$26,017
- − Property taxes
- −$6,967
- − Insurance
- −$2,322
- − Repairs & maintenance
- −$3,298
- − Management
- −$3,298
- − Depreciation
- −$13,512
- Taxable loss
- −$14,194
- Est. tax savings @ 24.0%
- +$3,407
- After-tax cash flow
- $-2,548/yr
For passive investors: Depreciation is non-cash, so a rental often shows a tax loss while cash-flowing — sheltering income. Rental losses are passive: they offset passive income freely, and up to $25,000/yr can offset ordinary (W-2) income if you actively participate and your MAGI is under $100k (phasing out to $0 by $150k); unused losses carry forward. On sale, claimed depreciation is recaptured at up to 25%, and gains may owe capital-gains tax (a 1031 exchange can defer both). Figures are a year-1 estimate at your 24.0% rate — not tax advice; consult a CPA.
Schools (NCES district)
- District
- Greene County Public School District
- NCES district ID
- 5101710
- Math proficiency
- 40% ▼ -37.00%
- Reading proficiency
- 64% ▼ -7.00%
- Median HH income
- $59,129
- Composite
- 45.22/100
- National rank
- #2668
- State rank
- #88 of 131 in VA
Livability — Barboursville
No livability data for this city. (Only ~50 U.S. cities are tracked.)
Census & demographics
- County
- Orange County · 21,992 people
- City population
- 6,435
- Metro
- Charlottesville, VA
- Population (ZIP)
- 6,435
- Household income
- $118,125
- Rent vs Own
- Severe rent burden
- 42.0
Population outlook (Greene County) Hauer SSP2
- Today (2025)
- 20,465 people
- By 2030
- 20,958 · +2.4%
- By 2040
- 21,619 · +5.6%
- By 2050
- 21,699 · +6.0%
- By 2075
- 21,656 · +5.8%
- By 2100
- 20,156 · -1.5%
Race, ethnicity, and origin ACS 2023
- Neighborhood character
- Predominantly White (89%)
- Race & ethnicity
- White 89% Black 5% Two or more races 5% Asian 1%
- Common ancestry
- Slovak 5% Portuguese 3% Italian 3%
- Foreign-born
- 3%
- Languages at home
- 97% English-only · Other Asian/Pacific 1% French/Haitian/Cajun 1% German/W. Germanic 1%
Political lean MEDSL · Greene
- 2024 margin
- Strong R (+24.7) · D 37.0% · R 61.7% · Other 1.2%
- 2008→2024 swing
- -2.9pp toward R · 2008: -21.9pp · 2024: -24.7pp
- All cycles
- 2024: R+24.7 2020: R+23.9 2016: R+31.8 2012: R+25.3 2008: R+21.9
Not yet ingested
- Civics
- —
Market trends
- HPI YoY
- ▼ -11.41%
- Current HPI
- 303.0348
- Rent YoY
- —
- Metro
- Charlottesville, VA
- State GDP YoY
- ▲ 2.40%
- F500 in state
- 50
Industry mix (Fortune 500 HQ in VA)
| Industry | F500 HQs | Revenue |
|---|---|---|
| Aerospace / Defense | 4 | $236B |
|
||
| Technology / Defense | 3 | $32B |
|
||
| Financial Services | 2 | $176B |
|
||
| Utilities | 2 | $27B |
|
||
| Insurance | 2 | $25B |
|
||
| Technology | 2 | $15B |
|
||
Cash-flow waterfall
monthlySold comps — $/sqft
last 12 mo · ≤1 miLoading sold comps…