9616 Verite St · Saginaw, TX
Flood risk No data
- FEMA flood zone
- —
- Chance of flooding over 30 yrs
- —
- Est. flood insurance / yr
- —
Fire risk No data
- Est. fire insurance / yr
- —
Heat risk No data
- Hot days now (above threshold)
- —
- Hot days in 30 yrs
- —
Wind risk No data
- Chance of severe wind over 30 yrs
- —
Air-quality risk No data
- Unhealthy air days now
- —
- Unhealthy air days in 30 yrs
- —
Risk factors via First Street. Map © Google.
Why this score? — see what drove the D grade
The composite is a weighted blend of 9 inputs, each scored 0–100. Each bar is that input's sub-score; the figure is the points it added to the 100-point composite (weight × sub-score).
- Cash flow +12.3/30.0
- ARV discount +9.4/15.0
- Condition / age +4.8/5.0
- Livability +3.8/5.0
- 1% rule +3.7/10.0
- DSCR +3.7/10.0
- Schools +3.5/10.0
- Rent growth +2.9/5.0
- Appreciation +0.0/10.0
$253,999
🖨 Deal sheet (PDF) 📄 Offer letter ✓ Due diligence
Listing remarks
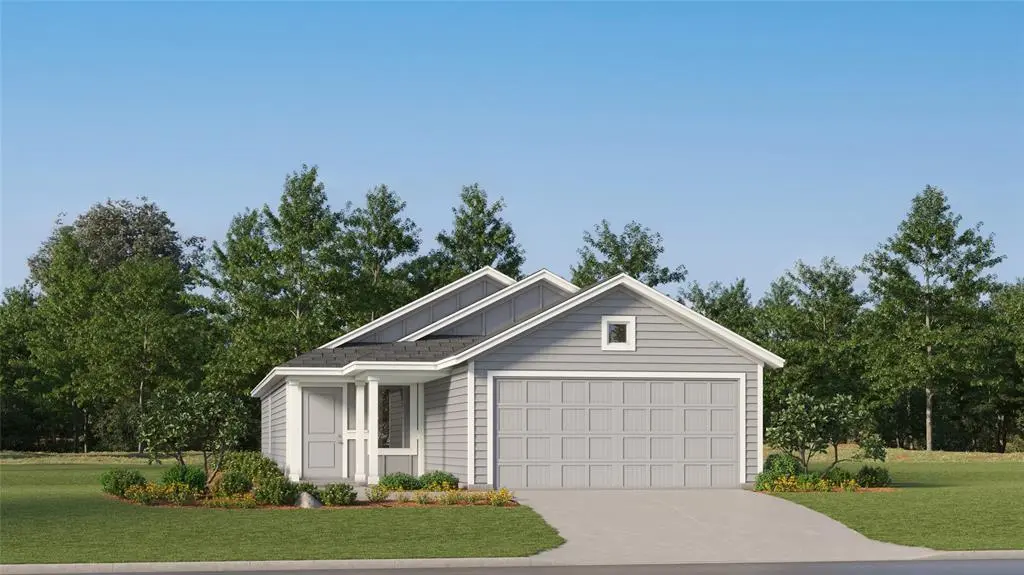
Introducing the Kitson
Key facts
- 4,792 sq ft lot
- 2 garage spots
- Built 2025
Property features AI
Finance
- Other: Subdivision: Northpointe; Directions: Coming north on Business 287 - Saginaw - Main, left on Heritage Trace Pkwy, keep straight on Heritage Trace Pkwy
- Financial info: Listing accepts Cash, Conventional, FHA, and VA financing; No second mortgage reported
- HOA & community: Mandatory association; Annual association fee assessed (fee reported); Association provides full use of facilities, grounds maintenance, and management services
Exterior
- Parking: Attached 2-car garage (garage faces rear, 2-car single door; approximate width 20', length 18'); 2 covered parking spaces
- Security: Burglar alarm; Carbon monoxide detector(s); Fire alarm; Prewired security; Smoke detector(s)
- Utilities: City water; City sewer; Concrete curbs and sidewalks; Not in a municipal utility district
- Home design: Single-family residence; One story; New construction (incomplete, 2025); Not attached to another property; Deed restrictions
- Construction: Brick and fiber cement exterior; Composition roof; Slab foundation; Year built 2025 (new construction - incomplete)
- Exterior features: Covered porch(es); Wood fencing; Landscaped interior lot; Lot dimensions approximately 40 x 120
Interior
- Kitchen: Built-in cabinets; Eat-in kitchen with island; Natural stone/granite countertops; Walk-in pantry; Water line to refrigerator; Dishwasher; Disposal; Electric oven; Gas cooktop; Microwave
- Bedrooms: Primary bedroom on level 1 with dual sinks, linen closet, and walk-in closet; Three additional bedrooms on level 1
- Flooring: Carpet; Luxury vinyl plank
- Bathrooms: 2 full bathrooms
- Heating & cooling: Central heating (natural gas); Central air conditioning
- Interior features: High-speed internet available; Walk-in closet(s); Other
- Laundry & utility: No specific laundry equipment listed
Neighborhood map
What this means for you Summary
Snapshot
- This is a 3-bed/2.0-bath single-family listed at $254k. Condition is rated excellent.
Deal economics
- At list price, monthly cash flow is $-45 ($-540/yr) — negative.
- To cash-flow at today's rent, offer at most $247k (2.6% below list).
- To meet the 1% rule (rent ≥ 1% of price), the offer needs to be $222k (12.7% below list).
- Recommended offer: $222k (12.7% below list) — sets the bar for 1% rule.
- Cap rate 6.1% vs local median 4.2% in Saginaw — top-decile yield for the area; either an underpriced asset or a hidden risk that comps aren't pricing in. Stress-test before assuming the spread holds.
Location & tenants
- Location reads 76/100 on livability (#112 in TX, #3,623 nationally) — a middle-class / working-renter tenant base. Strengths: employment A+, cost of living A+, housing A+; Watch: amenities F, commute F.
- Eagle Mt-Saginaw ISD (urban): math 35% / reading 42% proficiency, ranked #361 of 826 in TX (top 44%) — families likely to look elsewhere, expect single-tenant / working-renter base with shorter leases.
- Zoned schools: Eagle Mountain El (math 40% / reading 42%, grade F, #1,462 of 4,322 statewide, top 34%, 507 students, 19% FRL); Prairie Vista (math 33% / reading 40%, grade F, #786 of 1,662 statewide, top 48%, 923 students, 52% FRL); Chisholm Trail H S (math 27% / reading 55%, grade F, #774 of 1,632 statewide, top 49%, 2,493 students, 48% FRL) — zoned schools at 40% FRL track the district average.
- Market conditions: Rents rising (+1.5%/yr); 1074 active listings in the ZIP; 40 comparable units currently listed for rent nearby; rentals leasing fast (median 9d on market — plan ~1-2 weeks tenant-placement turnaround); solid renter incomes; 18,938 units permitted in Tarrant County in 2024 (8,336 in 5+ unit buildings).
Forward outlook
- Local home prices are declining (-3.0%/yr); year-one equity from $2k of loan paydown is wiped out by about $8k of value loss. Plan a longer hold.
- Tarrant County population projected at +41% by 2050 — long-run rental-demand tailwind backs the buy-and-hold thesis.
Negotiation context
- It's been on market 37 days — a 3% lower offer ($246k) is reasonable based on typical stale-listing flexibility.
Questions for the listing agent
- What do current leases actually rent for vs. the listed asking? Can we see a recent rent roll and the last 12 months of T-12 income?
- It's been on market 37 days. Have you received any prior offers? Is the seller open to a 13% concession, seller financing, or rate buy-down credit?
- What does the HOA fee cover, when was the last increase, and are there any pending special assessments or reserve-fund shortfalls?
- Is there a deadline driving the sale (1031 exchange, divorce, estate, relocation)? That informs how much negotiation room exists.
- Schools are D-rated, which usually means shorter tenancies and higher turnover. Who's the typical renter profile here, and what's been the actual vacancy rate?
- The area grade is low — what's the realistic commute time and amenity access for the typical tenant pool here? Any planned neighborhood developments (good or bad) we should know about?
- What's the average days-on-market for RENTAL listings here right now (not sales)? A rising rental-DOM trend means longer vacancies and softer asking-rent achievability than the comps imply.
- What's the recent tenant-quality profile in this submarket — average credit score on applications, eviction rate, late-payment / NSF rate, and stable-employment percentage? A property-management company in the area should have these aggregated.
- How much new for-sale + rental construction is in the pipeline within 1–3 miles? Heavy new supply typically softens prices + rents 12–24 months out; constrained supply supports both.
Investment metrics
- 1% rule
- 0.87% ✗
- Cap rate
- 6.08%
- Cash-on-cash
- -0.76%
- DSCR
- 0.97
- GRM
- 9.5
CMA / ARV
- ARV (on-the-fly)
- $264,978
- Comps found
- 12
Show comp detail 12 sales within ~0.75 mi
| Address | Dist | Beds/Ba | Sqft | Sold | Price | $/sf | Match |
|---|---|---|---|---|---|---|---|
| 310 S Hampshire St | 0.25mi | 4/2.0 (+1) | 1,376 (-2%) | 2mo | $290,000 | $211 | 79 |
| 400 Blue Ridge Trl | 0.53mi | 3/2.0 | 1,335 (-5%) | 3mo | $268,000 | $201 | 65 |
| 425 Ridgecrest Dr | 0.66mi | 3/2.0 | 1,388 (-1%) | 5mo | $265,000 | $191 | 64 |
| 221 Asbury Dr | 0.66mi | 3/2.0 | 1,367 (-2%) | 3mo | $274,900 | $201 | 62 |
| 604 Pinto Ln | 0.60mi | 4/2.0 (+1) | 1,468 (+5%) | 0mo | $249,900 | $170 | 59 |
| 516 Bailey St | 0.50mi | 3/2.0 | 1,524 (+9%) | 8mo | $265,000 | $174 | 55 |
| 404 Southern Ct | 0.40mi | 3/1.5 | 1,193 (-15%) | 1mo | $225,000 | $189 | 54 |
| 308 Thompson Ct | 0.54mi | 3/2.0 | 1,217 (-13%) | 2mo | $264,900 | $218 | 51 |
| 501 Nathan St | 0.57mi | 3/2.0 | 1,584 (+13%) | 3mo | $265,000 | $167 | 49 |
| 221 Spring Hollow Dr | 0.41mi | 4/2.0 (+1) | 1,609 (+15%) | 8mo | $299,999 | $186 | 45 |
| 363 Mustang Dr | 0.73mi | 3/2.0 | 1,246 (-11%) | 4mo | $225,000 | $181 | 44 |
| 137 Blue Wood Dr | 0.72mi | 3/2.0 | 1,566 (+12%) | 9mo | $290,000 | $185 | 40 |
Match score weights: distance 35% · size 25% · config 20% · recency 20%. Top-matched comps best support the ARV.
Projected returns pro-forma
-3.0% appreciation · 1.51% rent growth · sell at horizon
- IRR
- -19.2%
- Equity multiple
- 0.34×
- Total profit
- $-47,245
- Equity at exit
- $37,872
- IRR
- -15.3%
- Equity multiple
- 0.19×
- Total profit
- $-57,642
- Equity at exit
- $21,961
Cash invested: $71,120 (down + closing). Projections, not guarantees.
Landlord ↔ Tenant lean methodology
- Overall (STATE)
- 87 Strongly Landlord-Friendly
- State Texas
- 87 Strongly Landlord-Friendly · R+5
- County
- — inherits STATE
- City
- — inherits STATE
ZIP-level market 76179
- Rents YoY
- 1.5%
- Active inventory
- 1074
- Price-to-rent
- 9.5×
Monthly cashflow live
- Estimated rent
- $2,218 high interval (Pro) →
- Mortgage (P&I)
- −$1,332
- Tax est. 1.5%
- −$317 /mo · $3,810/yr
- Insurance
- −$106
- HOA
- −$42
- Vacancy / Maint / Mgmt
- −$466
- Net cashflow
- $-45
Break-even live
Sensitivity live
| Price | -10% $130 | -5% $43 | +0% $-45 | +5% $-133 | +10% $-221 |
|---|---|---|---|---|---|
| Rent | -10% $-220 | -5% $-133 | +0% $-45 | +5% $43 | +10% $130 |
| Rate | -1.0pp $83 | -0.5pp $20 | base $-45 | +0.5pp $-111 | +1.0pp $-178 |
UW: 25.0% down · 7.5% · 30yr · 1.5% tax · 5.0% vac · 8.0% maint · 8.0% mgmt
Financing live
Cash to close
- Down payment
- $63,500
- Closing costs
- $7,620
- Reserves months
- —
- Total cash needed
- —
Loan-product check · same deal, 3 products live
Conventional
25% down · 7.5% · 30yr
- Down + closing
- —
- Monthly P&I
- —
- Monthly cashflow
- —
- DSCR
- —
- Eligible?
- —
Personal DTI + credit; lowest rate.
DSCR
20% down · 8.5% · 30yr
- Down + closing
- —
- Monthly P&I
- —
- Monthly cashflow
- —
- DSCR
- —
- Eligible?
- —
No personal income docs; deal must DSCR.
Hard money
10% down · 12.0% · 12mo
- Down + closing
- —
- Monthly P&I
- —
- Monthly cashflow
- —
- DSCR
- —
- Eligible?
- —
Short-term bridge; refi at stabilization.
Rent comps 40 comps
| Address | Beds | Baths | Sqft | Rent | $/sqft | DOM | Units | Dist |
|---|---|---|---|---|---|---|---|---|
| 317 Worthy St Saginaw, TX | 3.0 | 1.0 | 1648 | $1,810 | $1.10 | 1d | 1 | 0.33mi |
| 157 Spring Hollow Dr Fort Worth, TX | 4.0 | 2.0 | 1737 | $2,249 | $1.29 | 4d | 1 | 0.37mi |
| 217 Palomino Dr Saginaw, TX | 4.0 | 2.0 | 1795 | $2,000 | $1.11 | 20d | 1 | 0.50mi |
| 508 Alex St Saginaw, TX | 3.0 | 2.0 | 1496 | $1,900 | $1.27 | 1d | 1 | 0.51mi |
| 508 Alex St Saginaw, TX | 3.0 | 2.0 | 1496 | $1,900 | $1.27 | 9d | 1 | 0.51mi |
| 520 Bailey St Saginaw, TX | 4.0 | 2.0 | 1867 | $2,045 | $1.10 | 1d | 1 | 0.53mi |
| 100 Creek Terrace Dr Fort Worth, TX | 3.0 | 2.0 | 1814 | $2,280 | $1.26 | 26d | 1 | 0.55mi |
| 144 Creek Terrace Dr Saginaw, TX | 3.0 | 2.0 | 1813 | $2,195 | $1.21 | 13d | 1 | 0.58mi |
| 125 Cambridge Dr Unit 4 Saginaw, TX | 3.0 | 2.0 | 1044 | $1,495 | $1.43 | 26d | 1 | 0.58mi |
| 317 Taylor St Saginaw, TX | 3.0 | 2.0 | 1632 | $1,985 | $1.22 | 4d | 1 | 0.60mi |
| 820 W McLeroy Blvd Unit 2020 Saginaw, TX | 2.0 | 1.0 | 1048 | $3,495 | $3.33 | 3d | 1 | 0.74mi |
| 404 Asbury Dr Saginaw, TX | 3.0 | 2.0 | 1166 | $1,545 | $1.33 | 26d | 1 | 0.77mi |
| 701 N Saginaw Blvd Saginaw, TX | 1.0–2.0 | 1.0–2.0 | 1024 | $2,326 | $2.27 | 1d | 21 | 0.80mi |
| 804 Willow Wood Dr Saginaw, TX | 3.0 | 2.0 | 1745 | $2,399 | $1.37 | 1d | 1 | 0.85mi |
| 512 Stallion Ln Saginaw, TX | 4.0 | 2.0 | 1538 | $2,050 | $1.33 | 20d | 1 | 0.89mi |
| 524 Buckstone Dr Saginaw, TX | 3.0 | 2.0 | 1355 | $1,975 | $1.46 | 7d | 1 | 0.99mi |
| 632 Condor Trl Fort Worth, TX | 3.0 | 2.0 | 1658 | $2,095 | $1.26 | 9d | 1 | 1.03mi |
| 915 Santa Fe Dr Saginaw, TX | 4.0 | 2.0 | 1744 | $8,950 | $5.13 | 26d | 1 | 1.14mi |
| 206 Hucknall Ct Saginaw, TX | 3.0 | 2.5 | 1667 | $2,529 | $1.52 | 1d | 1 | 1.18mi |
| 912 Fenway Ln Saginaw, TX | 3.0 | 2.0 | 1627 | $2,000 | $1.23 | 19d | 1 | 1.19mi |
| 912 Fenway Ln Saginaw, TX | 3.0 | 2.0 | 1627 | $2,000 | $1.23 | 26d | 1 | 1.19mi |
| 218 Potsgrove Rd Saginaw, TX | 3.0 | 2.5 | 1490 | $2,319 | $1.56 | 1d | 1 | 1.21mi |
| 853 Atchison Dr Saginaw, TX | 4.0 | 2.0 | 1748 | $2,100 | $1.20 | 26d | 1 | 1.22mi |
| 102 Rutland Ct Saginaw, TX | 3.0 | 2.5 | 1490 | $2,319 | $1.56 | 19d | 1 | 1.22mi |
| 1024 Green Ridge Ter Saginaw, TX | 3.0 | 2.0 | 1588 | $2,025 | $1.28 | 1d | 1 | 1.22mi |
| 101 Rutland Ct Saginaw, TX | 3.0 | 2.5 | 1490 | $2,299 | $1.54 | 8d | 1 | 1.23mi |
| 1040 Hillwood Dr Saginaw, TX | 3.0 | 2.0 | 1853 | $1,995 | $1.08 | 8d | 1 | 1.24mi |
| 206 Wingfield Rd Saginaw, TX | 4.0 | 3.0 | 1865 | $2,639 | $1.42 | 1d | 1 | 1.24mi |
| 106 Cherwell Ct Saginaw, TX | 3.0 | 2.5 | 1667 | $2,489 | $1.49 | 8d | 1 | 1.24mi |
| 110 Cherwell Ct Saginaw, TX | 4.0 | 3.0 | 1865 | $2,599 | $1.39 | 14d | 1 | 1.24mi |
| 948 Fenway Ln Saginaw, TX | 3.0 | 2.0 | 1563 | $2,025 | $1.30 | 26d | 1 | 1.25mi |
| 101 Canterbury Dr Saginaw, TX | 4.0 | 2.0 | 1866 | $2,191 | $1.17 | 14d | 1 | 1.25mi |
| 209 Wingfield Rd Saginaw, TX | 4.0 | 3.0 | 1865 | $2,639 | $1.42 | 1d | 1 | 1.26mi |
| 109 Cherwell Ct Saginaw, TX | 4.0 | 3.0 | 1865 | $2,599 | $1.39 | 14d | 1 | 1.26mi |
| 202 Hockliffe Ct Saginaw, TX | 4.0 | 3.0 | 1865 | $2,559 | $1.37 | 14d | 1 | 1.27mi |
| 110 Kimberly Ct Saginaw, TX | 4.0 | 3.0 | 1865 | $2,549 | $1.37 | 24d | 1 | 1.27mi |
| 205 Hockliffe Ct Saginaw, TX | 3.0 | 2.5 | 1667 | $2,439 | $1.46 | 1d | 1 | 1.29mi |
| 421 Commonwealth Dr Fort Worth, TX | 3.0 | 2.0 | 1699 | $2,250 | $1.32 | 7d | 1 | 1.29mi |
| 109 Kimberly Ct Saginaw, TX | 4.0 | 3.0 | 1865 | $2,579 | $1.38 | 24d | 1 | 1.29mi |
| 206 Hardwick Dr Saginaw, TX | 3.0–4.0 | 2.5–3.0 | 1747 | $2,299 | $1.32 | 1d | 1 | 1.29mi |
HOA detail
- Monthly dues
- $42 · $504/yr
Listing history 5 events
-
2026-05-14price $253,999
-
2026-05-14status Pending
-
2026-04-23price $255,999
-
2026-04-08price $259,999
-
2026-04-07$263,999 Active
ⓘ Source: listings_history table (triggers on properties + properties_extension) + one-shot
backfill from property_details.listing_events for pre-trigger history.
Nearby sold comps map
Loading sold comps map…
Walkable amenities ~0.75 mi
Loading nearby amenities…
Taxation est. · year 1
- Rental income
- $26,617
- − Mortgage interest
- −$14,228
- − Property taxes
- −$3,810
- − Insurance
- −$1,270
- − Repairs & maintenance
- −$2,129
- − Management
- −$2,129
- − HOA
- −$504
- − Depreciation
- −$7,389
- Taxable loss
- −$4,843
- Est. tax savings @ 24.0%
- +$1,162
- After-tax cash flow
- $622/yr
For passive investors: Depreciation is non-cash, so a rental often shows a tax loss while cash-flowing — sheltering income. Rental losses are passive: they offset passive income freely, and up to $25,000/yr can offset ordinary (W-2) income if you actively participate and your MAGI is under $100k (phasing out to $0 by $150k); unused losses carry forward. On sale, claimed depreciation is recaptured at up to 25%, and gains may owe capital-gains tax (a 1031 exchange can defer both). Figures are a year-1 estimate at your 24.0% rate — not tax advice; consult a CPA.
Condition & rehab AI · 1 photo
This single-family home is in excellent condition with no visible repairs or maintenance needed. It is move-in ready and would benefit from a fresh coat of paint and some landscaping to further enhance its curb appeal.
Value-add opportunities
- Both Painting — Fresh paint can enhance curb appeal and interior aesthetics
- Both Landscaping — Enhanced landscaping can improve curb appeal and property value
- Both Interior cleaning — A clean interior can make the home more appealing to potential buyers or renters
Renovation cost estimate screening
Value-add ROI direction
- Both Painting — Fresh paint can enhance curb appeal and interior aesthetics ↑
- Both Landscaping — Enhanced landscaping can improve curb appeal and property value ↑
- Both Interior cleaning — A clean interior can make the home more appealing to potential buyers or renters ↑
ⓘ Cost ranges are severity-bucket heuristics (US national rule-of-thumb). Get contractor quotes + a written scope before underwriting a rehab budget.
Schools (NCES district)
- District
- Eagle Mt-Saginaw ISD
- NCES district ID
- 4817700
- Math proficiency
- 35% ▼ -16.00%
- Reading proficiency
- 42% ▼ -9.00%
- Median HH income
- $72,781
- Composite
- 35.41/100
- National rank
- #4945
- State rank
- #361 of 826 in TX
Livability — Saginaw
- Score
- 76/100
- State rank
- #112
- US rank
- #3623
Category grades
Schools grade is shown separately in the Schools card above.
Census & demographics
- Census place
- Saginaw, TX
- County
- Tarrant County · 2,033,669 people
- City population
- 56,322
- Metro
- Dallas-Fort Worth-Arlington, TX
- Population (ZIP)
- 80,090
- Household income
- $107,428
- Rent vs Own
- Severe rent burden
- 1494.0
Population outlook (Tarrant County) Hauer SSP2
- Today (2025)
- 2,380,417 people
- By 2030
- 2,578,900 · +8.3%
- By 2040
- 2,974,995 · +25.0%
- By 2050
- 3,350,489 · +40.8%
- By 2075
- 4,216,909 · +77.2%
- By 2100
- 4,741,527 · +99.2%
Race, ethnicity, and origin ACS 2023
- Neighborhood character
- Diverse neighborhood (Simpson 0.63)
- Race & ethnicity
- White 53% Hispanic / Latino 28% Two or more races 14% Black 12% Asian 4%
- Hispanic origin (detail)
- Mexican 22% Puerto Rican 2%
- Common ancestry
- Slovak 2% Lithuanian 2% Italian 1%
- Foreign-born
- 8% · Canada, Jamaica
- Languages at home
- 81% English-only · Spanish 15% Other Asian/Pacific 2% Other Indo-European 1%
Political lean MEDSL · Tarrant
- 2024 margin
- Lean R (+5.1) · D 46.7% · R 51.9% · Other 1.4%
- 2008→2024 swing
- +6.6pp toward D · 2008: -11.7pp · 2024: -5.1pp
- All cycles
- 2024: R+5.1 2020: D+0.2 2016: R+8.7 2012: R+15.7 2008: R+11.7
Not yet ingested
- Civics
- —
Market trends
- HPI YoY
- ▼ -137.12%
- Current HPI
- 237.6676
- Rent YoY
- ▲ 1.51%
- Metro
- Dallas-Fort Worth-Arlington, TX
- State GDP YoY
- ▲ 3.95%
- F500 in state
- 110
Industry mix (Fortune 500 HQ in TX)
| Industry | F500 HQs | Revenue |
|---|---|---|
| Energy | 16 | $1,198B |
|
||
| Technology | 5 | $198B |
|
||
| Engineering / Construction | 4 | $72B |
|
||
| Energy Services | 3 | $60B |
|
||
| Utilities | 3 | $41B |
|
||
| Healthcare | 2 | $330B |
|
||
Price history
-3.8% since first listed5 events — show timeline
- 2026-05-14 Price Changed $253,999 NTREIS
- 2026-05-14 Pending — NTREIS
- 2026-04-23 Price Changed $255,999 NTREIS
- 2026-04-08 Price Changed $259,999 NTREIS
- 2026-04-07 Listed $263,999 NTREIS
Cash-flow waterfall
monthlySold comps — $/sqft
last 12 mo · ≤1 miLoading sold comps…