 7-Plex
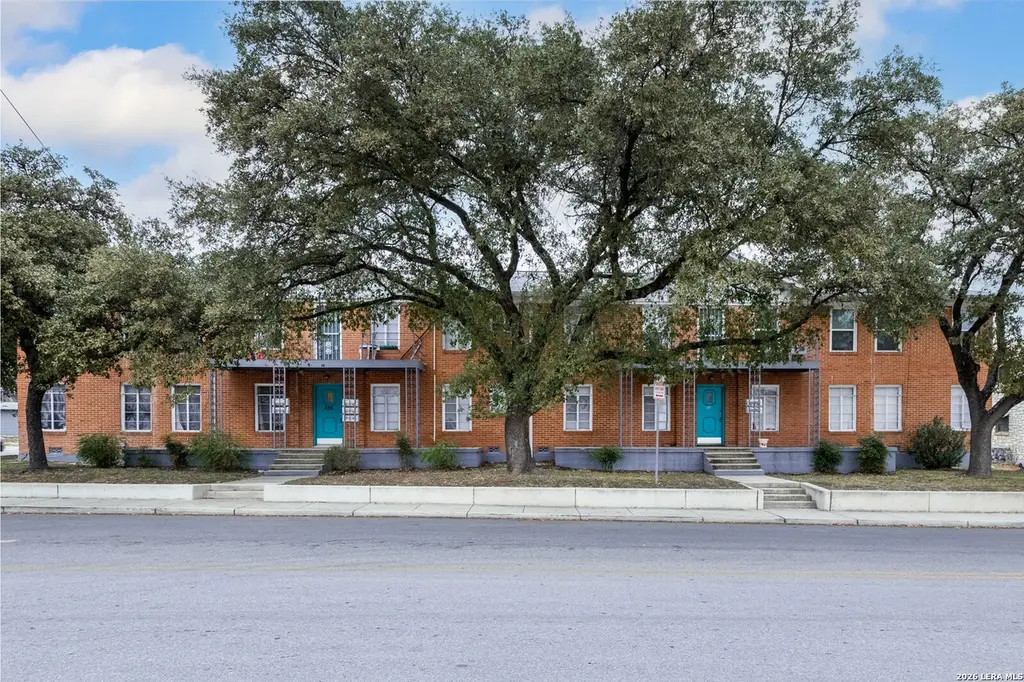
553 Club · San Antonio, TX
Flood risk 1/10 · Minimal
- FEMA flood zone
- X (unshaded)
- Chance of flooding over 30 yrs
- 0.0%
- Est. flood insurance / yr
- $507 – $1,088
Fire risk 1/10 · Minimal
- Est. fire insurance / yr
- $1,222 – $2,270
Heat risk 8/10 · Major
- Hot days now (above 108°F)
- 7 days/yr
- Hot days in 30 yrs
- 22 days/yr
Wind risk 6/10 · Moderate
- Chance of severe wind over 30 yrs
- 77.0%
Air-quality risk 2/10 · Minimal
- Unhealthy air days now
- 1 days/yr
- Unhealthy air days in 30 yrs
- 1 days/yr
Risk factors via First Street. Map © Google.
Why this score? — see what drove the D grade
The composite is a weighted blend of 9 inputs, each scored 0–100. Each bar is that input's sub-score; the figure is the points it added to the 100-point composite (weight × sub-score).
- Cash flow +15.5/30.0
- ARV discount +5.5/15.0
- DSCR +4.8/10.0
- 1% rule +4.4/10.0
- Livability +4.0/5.0
- Rent growth +3.2/5.0
- Condition / age +2.5/5.0
- Schools +1.4/10.0
- Appreciation +0.0/10.0
$820,000
🖨 Deal sheet (PDF) 📄 Offer letter ✓ Due diligence
Multi-family units
County records classify this as Multi-Family (5+ Unit). Listing-text estimate: 7 units. confirmed
5+ unit building — per-unit beds/baths from public records are typically unavailable; the breakdown below (if shown) is an estimate from the listing text.
Listing remarks MLS
Excellent Value-Add Opportunity in Monticello Park. Welcome to 553 Club Dr, a 7-unit multifamily property located in the historic and highly desirable Monticello Park neighborhood, directly across from Jefferson High School. This well-maintained asset features six spacious 2-bedroom, 1-bath units and one efficiency unit, offering a versatile unit mix with strong income potential. Interior photos of Units 3 and 4 are included in the listing to provide insight into the layout and overall condition of the property. With current rents presenting upside potential, investors have a clear opportunity to increase revenue over time. Ideally situated just minutes from major thoroughfares, dining, and shopping, the property benefits from a location that supports consistent tenant demand. Whether you're expanding your portfolio or entering the multifamily space in one of San Antonio's most established neighborhoods, 553 Club Dr offers both stability and long-term upside.
Key facts
- Dining and shopping
- Versatile unit mix
- 0.31 acre lot
Tags
Neighborhood map
What this means for you Summary
Snapshot
- This is a 6×2bd/1ba + 1×1bd/1ba units multifamily listed at $820k.
Deal economics
- At list price, monthly cash flow is $334 ($4k/yr) — positive. Per door: $48/mo.
- The deal already cash-flows at list — no discount required.
- To meet the 1% rule (rent ≥ 1% of price), the offer needs to be $772k (5.9% below list).
- Recommended offer: $746k (9.0% below list) — sets the bar for market timing.
- Cap rate 6.8% vs local median 3.8% in San Antonio — top-decile yield for the area; either an underpriced asset or a hidden risk that comps aren't pricing in. Stress-test before assuming the spread holds.
Location & tenants
- Location reads 80/100 on livability (#31 in TX, #1,616 nationally) — a professional / high-income tenant draw. Strengths: amenities A+, commute A+, cost of living A+; Watch: crime F.
- San Antonio ISD (urban): math 12% / reading 22% proficiency, ranked #805 of 826 in TX (top 98%) — low school quality limits family demand, transient renter base, plan for 1-2y turnover; 80% free/reduced lunch — lower-income household profile, screen leases tightly.
- Zoned schools: Woodlawn Academy (math 7% / reading 26%, grade F, #3,946 of 4,322 statewide, top 92%, 506 students, 84% FRL, charter); Longfellow Middle (math 7% / reading 15%, grade F, #1,634 of 1,662 statewide, top 99%, 646 students, 92% FRL); Jefferson H S (math 28% / reading 30%, grade F, #1,147 of 1,632 statewide, top 71%, 1,686 students, 87% FRL, charter).
- Market conditions: Rents rising (+2.8%/yr); 181 active listings in the ZIP; 8,308 units permitted in Bexar County in 2024 (2,506 in 5+ unit buildings).
- At $7,715/mo this rent would consume 196% of the median local household income ($47k/yr) (locally 2332% of renters already pay >50% of income on rent) — very limited rent-growth headroom before tenants either downsize or default.
Forward outlook
- Local home prices are declining (-3.0%/yr); year-one equity from $6k of loan paydown is wiped out by about $25k of value loss. Plan a longer hold.
- Bexar County population projected at +50% by 2050 — long-run rental-demand tailwind backs the buy-and-hold thesis.
Negotiation context
- It's been on market 94 days — a 9% lower offer ($746k) is reasonable based on typical stale-listing flexibility.
- 9 sale attempts since 13y ago with the ask held roughly flat each time — persistent listings suggest the price (not the market) is what's stuck; bring a comps-based counter.
Risks & watch-outs
- Watch-outs: built in 1950 — expect roof / HVAC / electrical / plumbing capex.
- Climate carrying-cost: major wind risk, 77% chance of damaging wind over 30y; extreme-heat days projected 7→22/yr by 2055 (HVAC capex compounding) — expect insurance premiums to compound above CPI over the hold.
Questions for the listing agent
- It's been on market 94 days. Have you received any prior offers? Is the seller open to a 9% concession, seller financing, or rate buy-down credit?
- Can we see the unit-by-unit rent roll, current vacancy, and any below-market leases? What's the average tenancy length?
- What capital expenditures (roof, boiler, parking lot, exteriors) have been made in the last 5 years, and what's planned in the next 2?
- Built in 1950 — when were the roof, HVAC, electrical panel, plumbing, and water heater last replaced?
- Why hasn't it sold? Are there any deal-killer items the seller is aware of (foundation, flood, title, zoning, code violations)?
- Is there a deadline driving the sale (1031 exchange, divorce, estate, relocation)? That informs how much negotiation room exists.
- Crime grade is F in this area — have there been break-ins, vandalism, or insurance claims at this property in the last 3 years? What carrier currently insures it and at what premium?
- The area grade is low — what's the realistic commute time and amenity access for the typical tenant pool here? Any planned neighborhood developments (good or bad) we should know about?
- What's the average days-on-market for RENTAL listings here right now (not sales)? A rising rental-DOM trend means longer vacancies and softer asking-rent achievability than the comps imply.
- What's the recent tenant-quality profile in this submarket — average credit score on applications, eviction rate, late-payment / NSF rate, and stable-employment percentage? A property-management company in the area should have these aggregated.
- How much new apartment / multifamily construction is in the pipeline within 1–3 miles? Heavy new supply (>2% of stock underway) typically softens rents 12–24 months out; light construction supports rent growth.
Investment metrics
- 1% rule
- 0.94% ✗
- Cap rate
- 6.78%
- Cash-on-cash
- 1.75%
- DSCR
- 1.08
- GRM
- 8.9
CMA / ARV
- ARV (median comp)
- $785,542
- List price
- $820,000
- Delta
- 4.39%
- Verdict
- FAIR
- Comps
- 1 within 2.0 mi
Projected returns pro-forma
-3.0% appreciation · 2.82% rent growth · sell at horizon
- IRR
- -13.7%
- Equity multiple
- 0.51×
- Total profit
- $-112,794
- Equity at exit
- $122,265
- IRR
- -5.1%
- Equity multiple
- 0.67×
- Total profit
- $-75,785
- Equity at exit
- $70,899
Cash invested: $229,600 (down + closing). Projections, not guarantees.
Landlord ↔ Tenant lean methodology
- Overall (STATE)
- 87 Strongly Landlord-Friendly
- State Texas
- 87 Strongly Landlord-Friendly · R+5
- County
- — inherits STATE
- City
- — inherits STATE
ZIP-level market 78201
- Home prices YoY
- -28.4%
- Rents YoY
- 2.8%
- Active inventory
- 181
- Price-to-rent
- 61.5×
Monthly cashflow live
- Estimated rent
- $7,715 high interval (Pro) →
- Mortgage (P&I)
- −$4,300
- Tax from tax record
- −$1,119 /mo · $13,423/yr
- Insurance
- −$342
- HOA
- −$0
- Vacancy / Maint / Mgmt
- −$1,620
- Net cashflow
- $334
Break-even live
Sensitivity live
| Price | -10% $799 | -5% $567 | +0% $334 | +5% $102 | +10% $-130 |
|---|---|---|---|---|---|
| Rent | -10% $-275 | -5% $30 | +0% $334 | +5% $639 | +10% $944 |
| Rate | -1.0pp $747 | -0.5pp $543 | base $334 | +0.5pp $122 | +1.0pp $-94 |
7-unit breakdown (identical units grouped — click to expand)
| Units | Beds | Baths | Est. rent |
|---|---|---|---|
| 6× units | 2 | 1 | $6,666 |
| #1 | 2 | 1 | $1,111 |
| #2 | 2 | 1 | $1,111 |
| #3 | 2 | 1 | $1,111 |
| #4 | 2 | 1 | $1,111 |
| #5 | 2 | 1 | $1,111 |
| #6 | 2 | 1 | $1,111 |
| 1× unit | 1 | 1 | $1,049 |
| Total (7 units) | $7,715 | ||
UW: 25.0% down · 7.5% · 30yr · 1.5% tax · 5.0% vac · 8.0% maint · 8.0% mgmt
Financing live
Cash to close
- Down payment
- $205,000
- Closing costs
- $24,600
- Reserves months
- —
- Total cash needed
- —
Loan-product check · same deal, 3 products live
Conventional
25% down · 7.5% · 30yr
- Down + closing
- —
- Monthly P&I
- —
- Monthly cashflow
- —
- DSCR
- —
- Eligible?
- —
Personal DTI + credit; lowest rate.
DSCR
20% down · 8.5% · 30yr
- Down + closing
- —
- Monthly P&I
- —
- Monthly cashflow
- —
- DSCR
- —
- Eligible?
- —
No personal income docs; deal must DSCR.
Hard money
10% down · 12.0% · 12mo
- Down + closing
- —
- Monthly P&I
- —
- Monthly cashflow
- —
- DSCR
- —
- Eligible?
- —
Short-term bridge; refi at stabilization.
Listing history 43 events
-
2026-06-21days on market $820,000 Active 94 DOM
-
2026-06-18days on market $820,000 Active 91 DOM
-
2026-06-17days on market $820,000 Active 90 DOM
-
2026-06-16days on market $820,000 Active 89 DOM
-
2026-06-15days on market $820,000 Active 88 DOM
-
2026-06-13days on market $820,000 Active 86 DOM
-
2026-06-09days on market $820,000 Active 82 DOM
-
2026-06-08days on market $820,000 Active 81 DOM
-
2026-06-07days on market $820,000 Active 80 DOM
-
2026-06-04days on market $820,000 Active 77 DOM
-
2026-06-03days on market $820,000 Active 76 DOM
-
2026-06-02days on market $820,000 Active 75 DOM
-
2026-06-01days on market $820,000 Active 74 DOM
-
2026-05-31days on market $820,000 Active 73 DOM
-
2026-04-03status Back on Market 979-char remark
Show marketing remark (979 chars)
Excellent Value-Add Opportunity in Monticello Park. Welcome to 553 Club Dr, a 7-unit multifamily property located in the historic and highly desirable Monticello Park neighborhood, directly across from Jefferson High School. This well-maintained asset features six spacious 2-bedroom, 1-bath units and one efficiency unit, offering a versatile unit mix with strong income potential. Interior photos of Units 3 and 4 are included in the listing to provide insight into the layout and overall condition of the property. With current rents presenting upside potential, investors have a clear opportunity to increase revenue over time. Ideally situated just minutes from major thoroughfares, dining, and shopping, the property benefits from a location that supports consistent tenant demand. Whether you're expanding your portfolio or entering the multifamily space in one of San Antonio's most established neighborhoods, 553 Club Dr offers both stability and long-term upside.
-
2026-03-30historical Active Option 979-char remark
Show marketing remark (979 chars)
Excellent Value-Add Opportunity in Monticello Park. Welcome to 553 Club Dr, a 7-unit multifamily property located in the historic and highly desirable Monticello Park neighborhood, directly across from Jefferson High School. This well-maintained asset features six spacious 2-bedroom, 1-bath units and one efficiency unit, offering a versatile unit mix with strong income potential. Interior photos of Units 3 and 4 are included in the listing to provide insight into the layout and overall condition of the property. With current rents presenting upside potential, investors have a clear opportunity to increase revenue over time. Ideally situated just minutes from major thoroughfares, dining, and shopping, the property benefits from a location that supports consistent tenant demand. Whether you're expanding your portfolio or entering the multifamily space in one of San Antonio's most established neighborhoods, 553 Club Dr offers both stability and long-term upside.
-
2026-03-19$820,000 New 979-char remark
Show marketing remark (979 chars)
Excellent Value-Add Opportunity in Monticello Park. Welcome to 553 Club Dr, a 7-unit multifamily property located in the historic and highly desirable Monticello Park neighborhood, directly across from Jefferson High School. This well-maintained asset features six spacious 2-bedroom, 1-bath units and one efficiency unit, offering a versatile unit mix with strong income potential. Interior photos of Units 3 and 4 are included in the listing to provide insight into the layout and overall condition of the property. With current rents presenting upside potential, investors have a clear opportunity to increase revenue over time. Ideally situated just minutes from major thoroughfares, dining, and shopping, the property benefits from a location that supports consistent tenant demand. Whether you're expanding your portfolio or entering the multifamily space in one of San Antonio's most established neighborhoods, 553 Club Dr offers both stability and long-term upside.
-
2026-02-14historical
-
2025-12-13price $870,000
-
2025-07-30price $899,900
-
2025-06-05price $925,000
-
2025-05-02status Back on Market
-
2025-04-15historical Active Option
-
2025-02-15$950,000 New
-
2021-02-09soldstatus
-
2020-03-13soldstatus
-
2020-03-12soldstatus Sold
-
2020-01-28status Pending
-
2020-01-08historical Active Option
-
2019-12-27price $585,000
-
2019-12-26status Back on Market
-
2019-11-25historical Active Option
-
2019-11-07price $595,000
-
2019-10-03price $605,000
-
2019-10-02price $625,000
-
2019-10-01status Back on Market
-
2019-09-25historical Active Option
-
2019-08-23$650,000 New
-
2013-07-31soldstatus Sold
-
2013-07-31soldstatus
-
2013-07-25status Pending
-
2013-07-24status Back on Market
-
2013-05-21Active Option
ⓘ Source: listings_history table (triggers on properties + properties_extension) + one-shot
backfill from property_details.listing_events for pre-trigger history.
Tax reassessment forecast TX · Resets to sale price
- Current annual tax
- $13,423 · $1,119/mo
- Projected year-2 tax
- $15,006 · $1,250/mo
- Expected delta
- +$1,583/yr (+$132/mo · 11.8%)
ⓘ Screening estimate from a state-policy table — verify with the county assessor before closing.
Climate risk First Street
- Flood 1/10 Low FEMA zone X (unshaded) · 0% chance over 30 yrs
- Wildfire 1/10 Low
- Heat 8/10 Severe 7 d/yr ≥108°F today · 22 d/yr by 30 yrs out
- Wind 6/10 Major 77% chance of damaging wind over 30 yrs
- Air quality 2/10 Low 1 unhealthy d/yr today · 1 by 30 yrs out
Nearby sold comps map
Loading sold comps map…
Walkable amenities ~0.75 mi
Loading nearby amenities…
Taxation est. · year 1
- Rental income
- $92,580
- − Mortgage interest
- −$45,933
- − Property taxes
- −$13,423
- − Insurance
- −$4,100
- − Repairs & maintenance
- −$7,406
- − Management
- −$7,406
- − Depreciation
- −$23,855
- Taxable loss
- −$9,543
- Est. tax savings @ 24.0%
- +$2,290
- After-tax cash flow
- $6,304/yr
For passive investors: Depreciation is non-cash, so a rental often shows a tax loss while cash-flowing — sheltering income. Rental losses are passive: they offset passive income freely, and up to $25,000/yr can offset ordinary (W-2) income if you actively participate and your MAGI is under $100k (phasing out to $0 by $150k); unused losses carry forward. On sale, claimed depreciation is recaptured at up to 25%, and gains may owe capital-gains tax (a 1031 exchange can defer both). Figures are a year-1 estimate at your 24.0% rate — not tax advice; consult a CPA.
Schools (NCES district)
- District
- San Antonio ISD
- NCES district ID
- 4838730
- Math proficiency
- 12% ▼ -21.00%
- Reading proficiency
- 22% ▼ -7.00%
- Median HH income
- $30,952
- Composite
- 13.57/100
- National rank
- #9512
- State rank
- #805 of 826 in TX
Livability — San Antonio
- Score
- 80/100
- State rank
- #31
- US rank
- #1616
Category grades
Schools grade is shown separately in the Schools card above.
Census & demographics
- Census place
- San Antonio, TX
- County
- Bexar County · 1,990,555 people
- City population
- 1,806,925
- Metro
- San Antonio-New Braunfels, TX
- Population (ZIP)
- 41,981
- Household income
- $47,121
- Rent vs Own
- Severe rent burden
- 2332.0
Population outlook (Bexar County) Hauer SSP2
- Today (2025)
- 2,336,851 people
- By 2030
- 2,560,728 · +9.6%
- By 2040
- 3,020,569 · +29.3%
- By 2050
- 3,493,522 · +49.5%
- By 2075
- 4,668,459 · +99.8%
- By 2100
- 5,533,242 · +136.8%
Race, ethnicity, and origin ACS 2023
- Neighborhood character
- Predominantly Hispanic (83%)
- Race & ethnicity
- Hispanic / Latino 83% Two or more races 51% White 13% Black 2% Native American 1%
- Hispanic origin (detail)
- Mexican 71%
- Common ancestry
- Arab 1% Lithuanian 1% Slovak 1%
- Foreign-born
- 22% · Canada
- Languages at home
- 43% English-only · Spanish 54% Arabic 1%
Political lean MEDSL · Bexar
- 2024 margin
- Lean D (+9.8) · D 54.3% · R 44.6% · Other 1.1%
- 2008→2024 swing
- +4.2pp toward D · 2008: 5.6pp · 2024: 9.8pp
- All cycles
- 2024: D+9.8 2020: D+18.2 2016: D+13.5 2012: D+4.6 2008: D+5.6
Not yet ingested
- Civics
- —
Market trends
- HPI YoY
- ▼ -103.07%
- Current HPI
- 259.9918
- Rent YoY
- ▲ 2.82%
- Metro
- San Antonio-New Braunfels, TX
- State GDP YoY
- ▲ 3.95%
- F500 in state
- 110
Industry mix (Fortune 500 HQ in TX)
| Industry | F500 HQs | Revenue |
|---|---|---|
| Energy | 16 | $1,198B |
|
||
| Technology | 5 | $198B |
|
||
| Engineering / Construction | 4 | $72B |
|
||
| Energy Services | 3 | $60B |
|
||
| Utilities | 3 | $41B |
|
||
| Healthcare | 2 | $330B |
|
||
Price history
+26.2% since first listed29 events — show timeline
- 2026-04-03 Relisted — LERA
- 2026-03-30 Contingent — LERA
- 2026-03-19 Listed $820,000 LERA
- 2026-02-14 Listing Removed — LERA
- 2025-12-13 Price Changed $870,000 LERA
- 2025-07-30 Price Changed $899,900 LERA
- 2025-06-05 Price Changed $925,000 LERA
- 2025-05-02 Relisted — LERA
- 2025-04-15 Contingent — LERA
- 2025-02-15 Listed $950,000 LERA
- 2021-02-09 Sold (Public Records) — Public Records
- 2020-03-13 Sold (Public Records) — Public Records
- 2020-03-12 Sold (MLS) — LERA
- 2020-01-28 Pending — LERA
- 2020-01-08 Contingent — LERA
- 2019-12-27 Price Changed $585,000 LERA
- 2019-12-26 Relisted — LERA
- 2019-11-25 Contingent — LERA
- 2019-11-07 Price Changed $595,000 LERA
- 2019-10-03 Price Changed $605,000 LERA
- 2019-10-02 Price Changed $625,000 LERA
- 2019-10-01 Relisted — LERA
- 2019-09-25 Contingent — LERA
- 2019-08-23 Listed $650,000 LERA
- 2013-07-31 Sold (MLS) — LERA
- 2013-07-31 Sold (Public Records) — Public Records
- 2013-07-25 Pending — LERA
- 2013-07-24 Relisted — LERA
- 2013-05-21 Listed — LERA
Property tax history
+6.0%/yrLatest (2025): $13,423 · +0.0% YoY. Source: county tax records.
Cash-flow waterfall
monthlySold comps — $/sqft
last 12 mo · ≤1 miLoading sold comps…