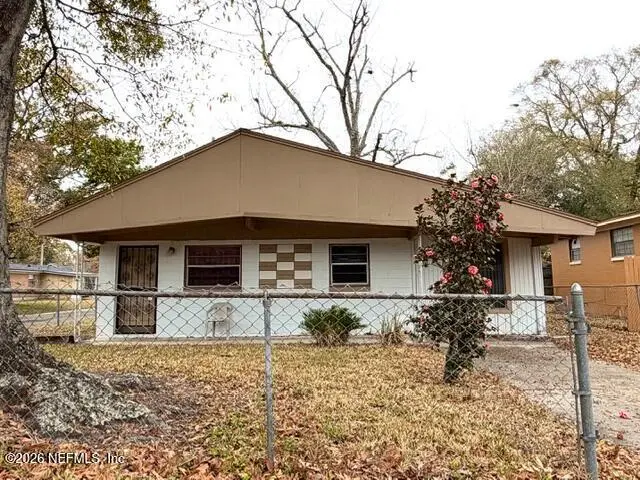
2239 W 17th St · Jacksonville, FL
Flood risk 1/10 · Minimal
- FEMA flood zone
- X (unshaded)
- Chance of flooding over 30 yrs
- 0.0%
- Est. flood insurance / yr
- $507 – $1,088
Fire risk 1/10 · Minimal
- Est. fire insurance / yr
- $947 – $1,759
Heat risk 9/10 · Severe
- Hot days now (above 107°F)
- 7 days/yr
- Hot days in 30 yrs
- 20 days/yr
Wind risk 9/10 · Severe
- Chance of severe wind over 30 yrs
- 99.0%
Air-quality risk 4/10 · Minor
- Unhealthy air days now
- 6 days/yr
- Unhealthy air days in 30 yrs
- 6 days/yr
Risk factors via First Street. Map © Google.
Why this score? — see what drove the B- grade
The composite is a weighted blend of 9 inputs, each scored 0–100. Each bar is that input's sub-score; the figure is the points it added to the 100-point composite (weight × sub-score).
- Cash flow +26.4/30.0
- ARV discount +13.9/15.0
- DSCR +9.0/10.0
- 1% rule +7.1/10.0
- Livability +4.2/5.0
- Schools +3.9/10.0
- Rent growth +3.0/5.0
- Condition / age +2.5/5.0
- Appreciation +0.0/10.0
$95,000
🖨 Deal sheet 📄 Offer letter ✓ Due diligence
Listing remarks
Priced to sell! Great investment opportunity or perfect as a starter home. With some TLC, this concrete block 2-bedroom, 1 flex room with 1 full bathroom home can be your haven. Coner lot, fully fenced, big backyard and offers quick access to major highways. Good-sized bedrooms with ample closet space. This home ia an ideal choice for those seeking a sturdy and well-located property. Don't miss out on this great opportunity in East Grand Park! Schedule your showing now!
Key facts
- Big backyard
- Fully fenced
- Ample closet space
Tags
Property features AI
Finance
- HOA & community: Not a senior community
Exterior
- Parking: Other parking
- Security: Smoke detector(s)
- Utilities: Electricity connected; Water connected
- Home design: Single-family home; One story
- Construction: Block construction
- Exterior features: Full fencing; Additional fencing; Corner lot; City street frontage; Shingle roof
Interior
- Kitchen: Electric oven
- Bedrooms: 2 bedrooms
- Bathrooms: 1 full bathroom
- Heating & cooling: Central heating; Central air conditioning
- Interior features: Ceiling fans; Split bedroom layout; Smoke detectors
- Laundry & utility: In-unit laundry
Neighborhood map
What this means for you Summary
Snapshot
- This is a 2-bed/1.0-bath single-family listed at $95k.
Deal economics
- At list price, monthly cash flow is $248 ($3k/yr) — positive.
- The deal already cash-flows at list — no discount required.
- Meets the 1% rule at list price ($1k rent vs $95k).
- Recommended offer: $86k (9.0% below list) — sets the bar for market timing.
- Cap rate 9.4% vs local median 4.0% in Jacksonville — top-decile yield for the area; either an underpriced asset or a hidden risk that comps aren't pricing in. Stress-test before assuming the spread holds.
Location & tenants
- Location reads 83/100 on livability (#50 in FL, #911 nationally) — a professional / high-income tenant draw. Strengths: amenities A+, commute A+, housing A+.
- Duval (urban): math 46% / reading 45% proficiency, ranked #48 of 73 in FL (top 66%) — families likely to look elsewhere, expect single-tenant / working-renter base with shorter leases.
- Market conditions: Rents rising (+1.8%/yr); 394 active listings in the ZIP; 40 comparable units currently listed for rent nearby; rentals at typical pace (median 21d on market — plan ~3-4 weeks tenant-placement turnaround); lower-income renter base — watch delinquency; 6,503 units permitted in Duval County in 2024 (1,131 in 5+ unit buildings).
- At $1,154/mo this rent would consume 45% of the median local household income ($31k/yr) (locally 2921% of renters already pay >50% of income on rent) — very limited rent-growth headroom before tenants either downsize or default.
Forward outlook
- Local home prices are declining (-3.0%/yr); year-one equity from $657 of loan paydown is wiped out by about $3k of value loss. Plan a longer hold.
- Duval County population projected at +19% by 2050 — long-run rental-demand tailwind backs the buy-and-hold thesis.
Negotiation context
- It's been on market 100 days — a 9% lower offer ($86k) is reasonable based on typical stale-listing flexibility.
- 3 sale attempts; this cycle's ask has dropped $10k (10%) from the opening price — seller is motivated, your offer sets the floor, not the list.
Risks & watch-outs
- Climate carrying-cost: severe wind risk, 99% chance of damaging wind over 30y; extreme-heat days projected 7→20/yr by 2055 (HVAC capex compounding) — expect insurance premiums to compound above CPI over the hold.
Questions for the listing agent
- It's been on market 100 days. Have you received any prior offers? Is the seller open to a 9% concession, seller financing, or rate buy-down credit?
- Built in 1962 — when were the roof, HVAC, electrical panel, plumbing, and water heater last replaced?
- Why hasn't it sold? Are there any deal-killer items the seller is aware of (foundation, flood, title, zoning, code violations)?
- Is there a deadline driving the sale (1031 exchange, divorce, estate, relocation)? That informs how much negotiation room exists.
- Schools are B-rated — typically a magnet for longer-tenancy family renters. What's the average tenant stay here, and is there a school-zone premium baked into asking?
- What's the average days-on-market for RENTAL listings here right now (not sales)? A rising rental-DOM trend means longer vacancies and softer asking-rent achievability than the comps imply.
- What's the recent tenant-quality profile in this submarket — average credit score on applications, eviction rate, late-payment / NSF rate, and stable-employment percentage? A property-management company in the area should have these aggregated.
- How much new for-sale + rental construction is in the pipeline within 1–3 miles? Heavy new supply typically softens prices + rents 12–24 months out; constrained supply supports both.
Investment metrics
- 1% rule
- 1.21% ✓
- Cap rate
- 9.43%
- Cash-on-cash
- 11.19%
- DSCR
- 1.50
- GRM
- 6.9
CMA / ARV
- ARV (on-the-fly)
- $110,880
- Comps found
- 12
Show comp detail 12 sales within ~0.75 mi
| Address | Dist | Beds/Ba | Sqft | Sold | Price | $/sf | Match |
|---|---|---|---|---|---|---|---|
| 2208 W 17th St | 0.06mi | 3/1.0 (+1) | 924 (-8%) | 4mo | $80,000 | $87 | 75 |
| 2706 Palafox St | 0.33mi | 3/1.0 (+1) | 1,040 (+3%) | 5mo | $141,500 | $136 | 70 |
| 2173 W 14th St | 0.17mi | 3/1.5 (+1) | 936 (-7%) | 4mo | $111,500 | $119 | 70 |
| 1901 Pullman Ct | 0.61mi | 2/1.0 | 969 (-4%) | 0mo | $98,000 | $101 | 65 |
| 2229 W 12th St | 0.23mi | 3/2.0 (+1) | 1,100 (+9%) | 1mo | $135,000 | $123 | 64 |
| 1924 McMillan St | 0.53mi | 2/2.5 | 1,022 (+1%) | 4mo | $209,020 | $205 | 64 |
| 3424 Gladys St | 0.37mi | 3/1.0 (+1) | 1,091 (+8%) | 3mo | $98,000 | $90 | 62 |
| 3430 Gladys St | 0.38mi | 3/1.0 (+1) | 923 (-8%) | 5mo | $62,500 | $68 | 59 |
| 3838 Penton St | 0.56mi | 3/1.0 (+1) | 950 (-6%) | 1mo | $110,000 | $116 | 58 |
| 2009 Almeda St | 0.37mi | 3/1.0 (+1) | 889 (-12%) | 2mo | $43,000 | $48 | 57 |
| 2419 W 28 St | 0.54mi | 3/1.0 (+1) | 1,136 (+13%) | 4mo | $125,000 | $110 | 45 |
| 3631 Effee St | 0.71mi | 3/2.0 (+1) | 1,120 (+11%) | 1mo | $74,000 | $66 | 38 |
Match score weights: distance 35% · size 25% · config 20% · recency 20%. Top-matched comps best support the ARV.
Projected returns pro-forma
-3.0% appreciation · 1.81% rent growth · sell at horizon
- IRR
- -0.9%
- Equity multiple
- 0.96×
- Total profit
- $-936
- Equity at exit
- $14,165
- IRR
- 7.4%
- Equity multiple
- 1.53×
- Total profit
- $14,150
- Equity at exit
- $8,214
Cash invested: $26,600 (down + closing). Projections, not guarantees.
Landlord ↔ Tenant lean methodology
- Overall (STATE)
- 87 Strongly Landlord-Friendly
- State Florida
- 87 Strongly Landlord-Friendly · R+3
- County
- — inherits STATE
- City
- — inherits STATE
ZIP-level market 32209
- Home prices YoY
- -22.1%
- Rents YoY
- 1.8%
- Active inventory
- 394
- Price-to-rent
- 6.9×
Monthly cashflow live
- Estimated rent
- $1,154 high interval (Pro) →
- Mortgage (P&I)
- −$498
- Tax from tax record
- −$126 /mo · $1,507/yr
- Insurance
- −$40
- HOA
- −$0
- Vacancy / Maint / Mgmt
- −$242
- Net cashflow
- $248
Break-even live
UW: 25.0% down · 7.5% · 30yr · 1.5% tax · 5.0% vac · 8.0% maint · 8.0% mgmt
Financing live
Cash to close
- Down payment
- $23,750
- Closing costs
- $2,850
- Reserves months
- —
- Total cash needed
- —
Loan-product check · same deal, 3 products live
Conventional
25% down · 7.5% · 30yr
- Down + closing
- —
- Monthly P&I
- —
- Monthly cashflow
- —
- DSCR
- —
- Eligible?
- —
Personal DTI + credit; lowest rate.
DSCR
20% down · 8.5% · 30yr
- Down + closing
- —
- Monthly P&I
- —
- Monthly cashflow
- —
- DSCR
- —
- Eligible?
- —
No personal income docs; deal must DSCR.
Hard money
10% down · 12.0% · 12mo
- Down + closing
- —
- Monthly P&I
- —
- Monthly cashflow
- —
- DSCR
- —
- Eligible?
- —
Short-term bridge; refi at stabilization.
Rent comps 40 comps
| Address | Beds | Baths | Sqft | Rent | $/sqft | DOM | Units | Dist |
|---|---|---|---|---|---|---|---|---|
| 2138 W 17th St Jacksonville, FL | 3.0 | 1.0 | 1158 | $1,425 | $1.23 | 4d | 1 | 0.15mi |
| 2319 Almeda St Jacksonville, FL | 3.0 | 1.0 | 1200 | $1,078 | $0.90 | 1d | 1 | 0.16mi |
| 2169 W 14th St Jacksonville, FL | 3.0 | 1.0 | 972 | $1,200 | $1.23 | 3d | 1 | 0.16mi |
| 2344 W 18th St Jacksonville, FL | 3.0 | 1.5 | 1129 | $1,425 | $1.26 | 14d | 1 | 0.19mi |
| 2345 W 15th St Jacksonville, FL | 3.0 | 2.0 | 1112 | $1,400 | $1.26 | 23d | 1 | 0.20mi |
| 2040 W 15th St Jacksonville, FL | 2.0 | 1.0 | 1036 | $1,050 | $1.01 | 23d | 1 | 0.34mi |
| 2134 Danson St Jacksonville, FL | 3.0 | 1.5 | 1080 | $995 | $0.92 | 3d | 1 | 0.34mi |
| 2134 Danson St Jacksonville, FL | 3.0 | 1.5 | 1080 | $995 | $0.92 | 4d | 1 | 0.34mi |
| 2604 McMillan St Jacksonville, FL | 3.0 | 1.0 | 912 | $1,100 | $1.21 | 21d | 1 | 0.38mi |
| 2100 Palafox St Jacksonville, FL | 2.0 | 1.0 | 750 | $975 | $1.30 | 23d | 1 | 0.41mi |
| 2000 Palafox St Jacksonville, FL | 2.0 | 1.0 | 750 | $950 | $1.27 | 23d | 1 | 0.42mi |
| 2020 Palafox St Jacksonville, FL | 2.0 | 1.0 | 750 | $950 | $1.27 | 23d | 1 | 0.42mi |
| 2002 Palafox St Jacksonville, FL | 2.0 | 1.0 | 750 | $950 | $1.27 | 21d | 2 | 0.43mi |
| 2004 Palafox St Jacksonville, FL | 2.0 | 1.0 | 750 | $950 | $1.27 | 21d | 1 | 0.43mi |
| 3516 Penton St Jacksonville, FL | 3.0 | 1.0 | 1000 | $1,350 | $1.35 | 23d | 1 | 0.45mi |
| 2116 McMillan St Jacksonville, FL | 3.0 | 1.5 | 1120 | $1,425 | $1.27 | 21d | 1 | 0.46mi |
| 2016 McMillan St Jacksonville, FL | 2.0 | 1.0 | 812 | $650 | $0.80 | 23d | 1 | 0.49mi |
| 2012 Palafox St Jacksonville, FL | 2.0 | 1.0 | 750 | $950 | $1.27 | 20d | 1 | 0.51mi |
| 2008 Palafox St Jacksonville, FL | 2.0 | 1.0 | 750 | $950 | $1.27 | 21d | 1 | 0.51mi |
| 2210 Pullman Ave Jacksonville, FL | 3.0 | 1.0 | 940 | $1,050 | $1.12 | 3d | 1 | 0.53mi |
| 1971 W 22nd St Jacksonville, FL | 3.0 | 1.0 | 1094 | $1,095 | $1.00 | 7d | 1 | 0.54mi |
| 1968 W 23rd St Unit Main Jacksonville, FL | 3.0 | 2.0 | 1106 | $1,400 | $1.27 | 21d | 1 | 0.55mi |
| 2540 W 25th St Jacksonville, FL | 3.0 | 1.5 | 854 | $1,295 | $1.52 | 14d | 1 | 0.58mi |
| 1901 Pullman Ct Jacksonville, FL | 2.0 | 1.0 | 969 | $1,295 | $1.34 | 7d | 1 | 0.59mi |
| 1721 Campus St Jacksonville, FL | 3.0 | 2.0 | 909 | $1,400 | $1.54 | 23d | 1 | 0.63mi |
| 1733 McMillan St Jacksonville, FL | 3.0 | 2.0 | 1211 | $1,265 | $1.04 | 4d | 1 | 0.63mi |
| 1845 W 13th St Unit 1 Jacksonville, FL | 2.0 | 1.0 | 800 | $850 | $1.06 | 23d | 1 | 0.66mi |
| 1934 Ella St Jacksonville, FL | 3.0 | 1.0 | 1045 | $1,095 | $1.05 | 20d | 1 | 0.67mi |
| 2312 Fairfax St Jacksonville, FL | 3.0 | 1.0 | 726 | $650 | $0.90 | 17d | 1 | 0.71mi |
| 1776 Spires Ave Unit 2 Jacksonville, FL | 2.0 | 1.0 | 800 | $1,125 | $1.41 | 4d | 1 | 0.71mi |
| 2306 Fairfax St Unit 3 Jacksonville, FL | 2.0 | 1.0 | 700 | $650 | $0.93 | 23d | 1 | 0.71mi |
| 2306 Fairfax St Unit 1 Jacksonville, FL | 3.0 | 1.0 | 900 | $700 | $0.78 | 23d | 1 | 0.71mi |
| 2310 Fairfax St Jacksonville, FL | 2.0 | 1.0 | 726 | $600 | $0.83 | 23d | 1 | 0.71mi |
| 1842 W 26th St Jacksonville, FL | 3.0 | 2.0 | 933 | $1,200 | $1.29 | 23d | 1 | 0.74mi |
| 1730 W 19th St Jacksonville, FL | 3.0 | 2.0 | 1323 | $1,100 | $0.83 | 1d | 1 | 0.75mi |
| 1830 W 27th St Jacksonville, FL | 3.0 | 2.0 | 952 | $1,375 | $1.44 | 23d | 1 | 0.78mi |
| 2011 W 5th St Jacksonville, FL | 3.0 | 1.0 | 988 | $1,150 | $1.16 | 23d | 1 | 0.78mi |
| 2693 W 25th St Jacksonville, FL | 3.0 | 1.5 | 1300 | $1,450 | $1.12 | 23d | 1 | 0.80mi |
| 1712 W 23rd St Jacksonville, FL | 3.0 | 2.0 | 1200 | $1,275 | $1.06 | 23d | 1 | 0.81mi |
| 1934 W 6th St Jacksonville, FL | 3.0 | 1.0 | 948 | $1,125 | $1.19 | 23d | 1 | 0.82mi |
Listing history 18 events
-
2026-06-18days on market $95,000 Active 100 DOM
-
2026-06-17days on market $95,000 Active 99 DOM
-
2026-06-16days on market $95,000 Active 98 DOM
-
2026-06-15days on market $95,000 Active 97 DOM
-
2026-06-13days on market $95,000 Active 94 DOM
-
2026-06-10days on market $95,000 Active 91 DOM
-
2026-06-08days on market $95,000 Active 90 DOM
-
2026-06-07days on market $95,000 Active 89 DOM
-
2026-06-03days on market $95,000 Active 85 DOM
-
2026-06-02days on market $95,000 Active 84 DOM
-
2026-06-01days on market $95,000 Active 83 DOM
-
2026-05-31days on market $95,000 Active 82 DOM
-
2026-05-12price $95,000
-
2026-05-01status Active
-
2026-04-11status Pending
-
2026-03-29status Active
-
2026-03-25status Pending
-
2026-02-15$105,000 Active
ⓘ Source: listings_history table (triggers on properties + properties_extension) + one-shot
backfill from property_details.listing_events for pre-trigger history.
Tax reassessment forecast FL · Resets to sale price
- Current annual tax
- $1,507 · $126/mo
- Projected year-2 tax
- $1,507 · $126/mo
- Expected delta
- $0/yr ($0/mo · 0.0%)
ⓘ Screening estimate from a state-policy table — verify with the county assessor before closing.
Climate risk First Street
- Flood 1/10 Low FEMA zone X (unshaded) · 0% chance over 30 yrs
- Wildfire 1/10 Low
- Heat 9/10 Extreme 7 d/yr ≥107°F today · 20 d/yr by 30 yrs out
- Wind 9/10 Extreme 99% chance of damaging wind over 30 yrs
- Air quality 4/10 Moderate 6 unhealthy d/yr today · 6 by 30 yrs out
Nearby sold comps map
Loading sold comps map…
Walkable amenities ~0.75 mi
Loading nearby amenities…
Taxation est. · year 1
- Rental income
- $13,844
- − Mortgage interest
- −$5,321
- − Property taxes
- −$1,507
- − Insurance
- −$475
- − Repairs & maintenance
- −$1,108
- − Management
- −$1,108
- − Depreciation
- −$2,764
- Taxable income
- $1,563
- Est. tax owed @ 24.0%
- −$375
- After-tax cash flow
- $2,602/yr
For passive investors: Depreciation is non-cash, so a rental often shows a tax loss while cash-flowing — sheltering income. Rental losses are passive: they offset passive income freely, and up to $25,000/yr can offset ordinary (W-2) income if you actively participate and your MAGI is under $100k (phasing out to $0 by $150k); unused losses carry forward. On sale, claimed depreciation is recaptured at up to 25%, and gains may owe capital-gains tax (a 1031 exchange can defer both). Figures are a year-1 estimate at your 24.0% rate — not tax advice; consult a CPA.
Schools (NCES district)
- District
- Duval
- NCES district ID
- 1200480
- Math proficiency
- 46% ▼ -11.00%
- Reading proficiency
- 45% ▼ -4.00%
- Median HH income
- $48,987
- Composite
- 38.97/100
- National rank
- #4076
- State rank
- #48 of 73 in FL
Livability — Jacksonville
- Score
- 83/100
- State rank
- #50
- US rank
- #911
Category grades
Schools grade is shown separately in the Schools card above.
Census & demographics
- Census place
- Jacksonville, FL
- County
- Duval County · 1,015,274 people
- City population
- 979,034
- Metro
- Jacksonville, FL
- Population (ZIP)
- 34,657
- Household income
- $30,514
- Rent vs Own
- Severe rent burden
- 2921.0
Population outlook (Duval County) Hauer SSP2
- Today (2025)
- 1,013,010 people
- By 2030
- 1,059,228 · +4.6%
- By 2040
- 1,141,439 · +12.7%
- By 2050
- 1,205,258 · +19.0%
- By 2075
- 1,324,282 · +30.7%
- By 2100
- 1,319,620 · +30.3%
Race, ethnicity, and origin ACS 2023
- Neighborhood character
- Predominantly Black (88%)
- Race & ethnicity
- Black 88% White 5% Hispanic / Latino 5% Two or more races 2%
- Hispanic origin (detail)
- Puerto Rican 3%
- Common ancestry
- Hispanic 1% Romanian 1%
- Foreign-born
- 3% · Canada
- Languages at home
- 95% English-only · Spanish 4% French/Haitian/Cajun 1%
Political lean MEDSL · Duval
- 2024 margin
- Toss-up / Even · D 48.7% · R 50.1% · Other 1.2%
- 2008→2024 swing
- +0.4pp no change · 2008: -1.9pp · 2024: -1.5pp
- All cycles
- 2024: R+1.5 2020: D+3.8 2016: R+1.5 2012: R+3.6 2008: R+1.9
Not yet ingested
- Civics
- —
Market trends
- HPI YoY
- ▼ -53.92%
- Current HPI
- 189.5977
- Rent YoY
- ▲ 1.81%
- Metro
- Jacksonville, FL
- State GDP YoY
- ▲ 3.28%
- F500 in state
- 36
Industry mix (Fortune 500 HQ in FL)
| Industry | F500 HQs | Revenue |
|---|---|---|
| Industrial Technology | 2 | $29B |
|
||
| Insurance | 2 | $17B |
|
||
| Retail | 1 | $60B |
|
||
| Technology Distribution | 1 | $58B |
|
||
| Homebuilding | 1 | $35B |
|
||
| Technology Manufacturing | 1 | $35B |
|
||
Price history
-9.5% since first listed6 events — show timeline
- 2026-05-12 Price Changed $95,000 realMLS
- 2026-05-01 Relisted — realMLS
- 2026-04-11 Pending — realMLS
- 2026-03-29 Relisted — realMLS
- 2026-03-25 Pending — realMLS
- 2026-02-15 Listed $105,000 realMLS
Property tax history
+6.0%/yrLatest (2025): $1,507 · +20.9% YoY. Source: county tax records.
Cash-flow waterfall
monthlySold comps — $/sqft
last 12 mo · ≤1 miLoading sold comps…