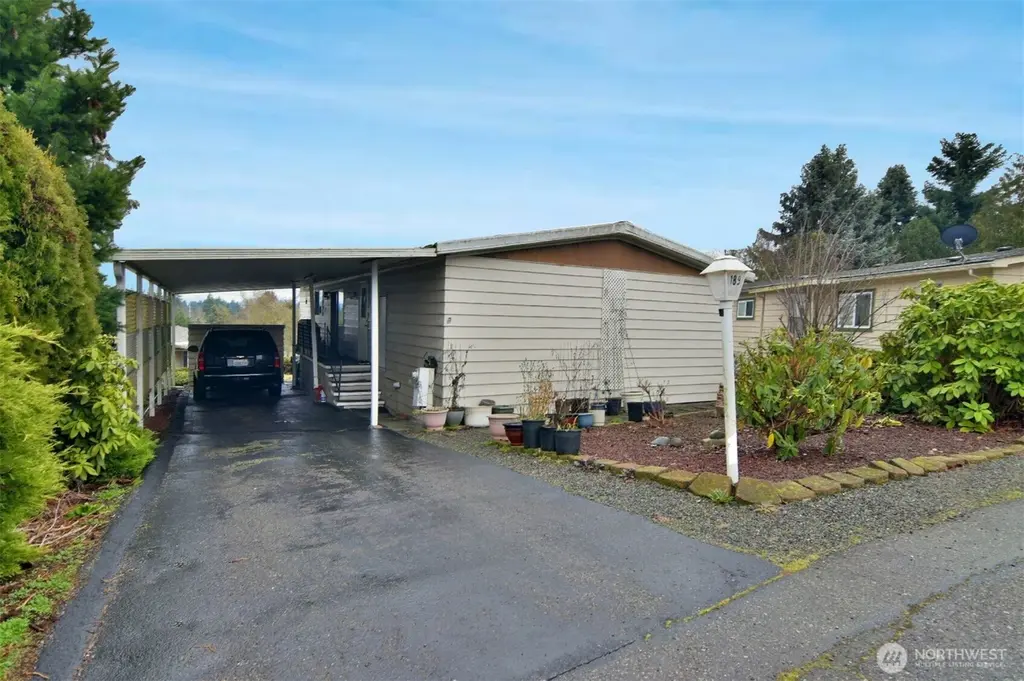
13320 Hwy 99 #189 · Everett, WA
Flood risk No data
- FEMA flood zone
- —
- Chance of flooding over 30 yrs
- —
- Est. flood insurance / yr
- —
Fire risk No data
- Est. fire insurance / yr
- —
Heat risk No data
- Hot days now (above threshold)
- —
- Hot days in 30 yrs
- —
Wind risk No data
- Chance of severe wind over 30 yrs
- —
Air-quality risk No data
- Unhealthy air days now
- —
- Unhealthy air days in 30 yrs
- —
Risk factors via First Street. Map © Google.
Why this score? — see what drove the B grade
The composite is a weighted blend of 9 inputs, each scored 0–100. Each bar is that input's sub-score; the figure is the points it added to the 100-point composite (weight × sub-score).
- Cash flow +30.0/30.0
- 1% rule +10.0/10.0
- DSCR +10.0/10.0
- ARV discount +9.4/15.0
- Schools +4.8/10.0
- Livability +3.7/5.0
- Condition / age +2.5/5.0
- Rent growth +2.1/5.0
- Appreciation +0.0/10.0
$110,000
🖨 Deal sheet (PDF) 📄 Offer letter ✓ Due diligence
Listing remarks
The transaction of this wonderful manufactured home failed due to unforeseen buyer circumstances. However, it could be an unusual opportunity of a lifetime for you! Remodeling package at an unbelievably low price is available through seller. Be the proud owner of this two bedroom two bath home in coveted Carriage Club 55+ Estates. This particular home has an excellent flowing floor plan with an efficient kitchen complete with eating bar. Adjoining dining, living and family room offers plenty of space for all your hobbies or entertainment enjoyment and finally, a home with plenty of cupboard and storage space. You will love and appreciate the large deck off the family room for your morning
Key facts
- Large deck
- Rv parking
- Efficient kitchen
Tags
Neighborhood map
What this means for you Summary
Snapshot
- This is a 3-bed/2.0-bath manufactured listed at $110k.
Deal economics
- At list price, monthly cash flow is $1k ($16k/yr) — positive.
- The deal already cash-flows at list — no discount required.
- Meets the 1% rule at list price ($3k rent vs $110k).
- Recommended offer: $103k (6.0% below list) — sets the bar for market timing.
- Cap rate 20.9% vs local median 2.5% in Everett — top-decile yield for the area; either an underpriced asset or a hidden risk that comps aren't pricing in. Stress-test before assuming the spread holds.
Location & tenants
- Location reads 73/100 on livability (#199 in WA) — a middle-class / working-renter tenant base. Strengths: commute A+, housing A, health & safety A; Watch: crime D+, amenities F, cost of living F.
- Mukilteo School District (suburban): math 47% / reading 59% proficiency, ranked #111 of 291 in WA (top 38%) — acceptable for families but not a draw, mixed tenant base, ~2y average lease.
- Zoned schools: Fairmount Elementary (511 students, 66% FRL); Olympic View Middle School (817 students, 49% FRL); Mariner High School (2,090 students, 67% FRL) — zoned schools average 61% FRL vs 40% district-wide (20 pts higher); higher-poverty schools than district average — tighter screening recommended.
- Market conditions: Rents soft (-1.7%/yr); 167 active listings in the ZIP; 40 comparable units currently listed for rent nearby; rentals leasing fast (median 7d on market — plan ~1-2 weeks tenant-placement turnaround); 3,982 units permitted in Snohomish County in 2024 (1,492 in 5+ unit buildings).
- This rent runs 45% of the median local income ($69k/yr) — at the standard rent-burdened threshold; future hikes will face affordability resistance.
Forward outlook
- Local home prices are declining (-3.0%/yr); year-one equity from $761 of loan paydown is wiped out by about $3k of value loss. Plan a longer hold.
- Snohomish County population projected at +30% by 2050 — long-run rental-demand tailwind backs the buy-and-hold thesis.
- At projected returns (-3.0% appreciation + 0.0% rent growth), your $31k cash investment doubles in ~3 years — after that, you're playing with house money.
Negotiation context
- It's been on market 90 days — a 6% lower offer ($103k) is reasonable based on typical stale-listing flexibility.
- 2 sale attempts; this cycle's ask has dropped $19k (15%) from the opening price — seller is motivated, your offer sets the floor, not the list.
Questions for the listing agent
- It's been on market 90 days. Have you received any prior offers? Is the seller open to a 6% concession, seller financing, or rate buy-down credit?
- Built in 1977 — when were the roof, HVAC, electrical panel, plumbing, and water heater last replaced?
- Why hasn't it sold? Are there any deal-killer items the seller is aware of (foundation, flood, title, zoning, code violations)?
- Is there a deadline driving the sale (1031 exchange, divorce, estate, relocation)? That informs how much negotiation room exists.
- Crime grade is D in this area — have there been break-ins, vandalism, or insurance claims at this property in the last 3 years? What carrier currently insures it and at what premium?
- What's the average days-on-market for RENTAL listings here right now (not sales)? A rising rental-DOM trend means longer vacancies and softer asking-rent achievability than the comps imply.
- What's the recent tenant-quality profile in this submarket — average credit score on applications, eviction rate, late-payment / NSF rate, and stable-employment percentage? A property-management company in the area should have these aggregated.
- How much new for-sale + rental construction is in the pipeline within 1–3 miles? Heavy new supply typically softens prices + rents 12–24 months out; constrained supply supports both.
Investment metrics
- 1% rule
- 2.33% ✓
- Cap rate
- 20.94%
- Cash-on-cash
- 52.30%
- DSCR
- 3.33
- GRM
- 3.6
CMA / ARV
- ARV (median comp)
- $114,895
- List price
- $110,000
- Delta
- -4.26%
- Verdict
- FAIR
- Comps
- 15 within 1.0 mi
Show comp detail 10 sales within ~0.75 mi
| Address | Dist | Beds/Ba | Sqft | Sold | Price | $/sf | Match |
|---|---|---|---|---|---|---|---|
| 13320 Hwy 99 #189 | 0.00mi | 2/2.0 (-1) | 1,334 (0%) | 1mo | $102,000 | $76 | 94 |
| 13320 Highway 99 #151 | 0.00mi | 2/2.0 (-1) | 1,344 (+1%) | 5mo | $65,000 | $48 | 90 |
| 13320 Highway 99 S #202 | 0.00mi | 3/2.0 | 1,488 (+12%) | 9mo | $127,500 | $86 | 74 |
| 13320 Hwy 99 #37 | 0.00mi | 2/2.0 (-1) | 1,200 (-10%) | 7mo | $122,500 | $102 | 73 |
| 13320 Highway 99 #139 | 0.00mi | 2/2.0 (-1) | 1,411 (+6%) | 23mo | $198,000 | $140 | 66 |
| 13320 Highway 99 #29 | 0.00mi | 2/2.0 (-1) | 1,140 (-14%) | 11mo | $179,950 | $158 | 62 |
| 13320 Highway 99 #208 | 0.00mi | 2/2.0 (-1) | 1,136 (-15%) | 11mo | $149,000 | $131 | 61 |
| 14322 Admiralty Way #125 | 0.51mi | 2/2.0 (-1) | 1,266 (-5%) | 6mo | $41,000 | $32 | 57 |
| 14322 Admiralty Way #51 | 0.51mi | 2/2.0 (-1) | 1,200 (-10%) | 8mo | $115,000 | $96 | 48 |
| 14322 Admiralty Way #97 | 0.51mi | 2/2.0 (-1) | 1,200 (-10%) | 20mo | $74,500 | $62 | 38 |
Match score weights: distance 35% · size 25% · config 20% · recency 20%. Top-matched comps best support the ARV.
Projected returns pro-forma
-3.0% appreciation · 0.0% rent growth · sell at horizon
- IRR
- 46.9%
- Equity multiple
- 2.95×
- Total profit
- $60,149
- Equity at exit
- $16,401
- IRR
- 51.4%
- Equity multiple
- 5.33×
- Total profit
- $133,381
- Equity at exit
- $9,511
Cash invested: $30,800 (down + closing). Projections, not guarantees.
Landlord ↔ Tenant lean methodology
- Overall (STATE)
- 28 Tenant-Leaning
- State Washington
- 28 Tenant-Leaning · D+8
- County
- — inherits STATE
- City
- — inherits STATE
ZIP-level market 98204
- Rents YoY
- -1.7%
- Active inventory
- 167
- Price-to-rent
- 3.6×
Monthly cashflow live
- Estimated rent
- $2,566 high interval (Pro) →
- Mortgage (P&I)
- −$577
- Tax from tax record
- −$62 /mo · $743/yr
- Insurance
- −$46
- HOA
- −$0
- Vacancy / Maint / Mgmt
- −$539
- Net cashflow
- $1,342
Break-even live
Sensitivity live
| Price | -10% $1,405 | -5% $1,374 | +0% $1,342 | +5% $1,311 | +10% $1,280 |
|---|---|---|---|---|---|
| Rent | -10% $1,140 | -5% $1,241 | +0% $1,342 | +5% $1,444 | +10% $1,545 |
| Rate | -1.0pp $1,398 | -0.5pp $1,370 | base $1,342 | +0.5pp $1,314 | +1.0pp $1,285 |
UW: 25.0% down · 7.5% · 30yr · 1.5% tax · 5.0% vac · 8.0% maint · 8.0% mgmt
Financing live
Cash to close
- Down payment
- $27,500
- Closing costs
- $3,300
- Reserves months
- —
- Total cash needed
- —
Loan-product check · same deal, 3 products live
Conventional
25% down · 7.5% · 30yr
- Down + closing
- —
- Monthly P&I
- —
- Monthly cashflow
- —
- DSCR
- —
- Eligible?
- —
Personal DTI + credit; lowest rate.
DSCR
20% down · 8.5% · 30yr
- Down + closing
- —
- Monthly P&I
- —
- Monthly cashflow
- —
- DSCR
- —
- Eligible?
- —
No personal income docs; deal must DSCR.
Hard money
10% down · 12.0% · 12mo
- Down + closing
- —
- Monthly P&I
- —
- Monthly cashflow
- —
- DSCR
- —
- Eligible?
- —
Short-term bridge; refi at stabilization.
Rent comps 40 comps
| Address | Beds | Baths | Sqft | Rent | $/sqft | DOM | Units | Dist |
|---|---|---|---|---|---|---|---|---|
| 12909 Mukilteo Speedway Lynnwood, WA | 3.0–4.0 | 2.0 | 1199 | $1,993 | $1.66 | 6d | 8 | 0.28mi |
| 2709 Lincoln Way Lynnwood, WA | 2.0–3.0 | 2.0 | 1120 | $2,606 | $2.33 | 3d | 4 | 0.34mi |
| 14014 Admiralty Way Lynnwood, WA | 1.0–2.0 | 1.0–2.0 | 768 | $1,975 | $2.57 | 6d | 6 | 0.42mi |
| 14131 Admiralty Way Unit B Lynnwood, WA | 2.0 | 1.5 | 1000 | $2,245 | $2.25 | 26d | 1 | 0.52mi |
| 13730 Manor Way Unit F2 Lynnwood, WA | 3.0 | 3.5 | 1626 | $3,400 | $2.09 | 45d | 1 | 0.57mi |
| 3924 135th St SW Lynnwood, WA | 3.0 | 2.0 | 1552 | $3,200 | $2.06 | 26d | 1 | 0.59mi |
| 12318 26th Pl W Everett, WA | 3.0 | 2.5 | 1558 | $3,000 | $1.93 | 6d | 1 | 0.64mi |
| 14611 Admiralty Way Lynnwood, WA | 1.0–3.0 | 1.0–2.0 | 1004 | $2,730 | $2.72 | 0d | 12 | 0.78mi |
| 3626 Shelby Rd #2 Lynnwood, WA | 2.0 | 2.5 | 1360 | $2,600 | $1.91 | 4d | 1 | 0.89mi |
| 4020 Shelby Rd Unit 2 Lynnwood, WA | 3.0 | 2.5 | 1523 | $3,400 | $2.23 | 45d | 1 | 0.93mi |
| 3717 148th St SW Lynnwood, WA | 2.0 | 1.0–2.0 | 865 | $1,912 | $2.21 | 4d | 6 | 0.94mi |
| 12530 Admiralty Way Unit D304 Everett, WA | 2.0 | 2.0 | 1050 | $2,400 | $2.29 | 6d | 1 | 0.94mi |
| 12118 Highway 99 Everett, WA | 1.0–5.0 | 1.0–3.0 | 1117 | $2,236 | $2.00 | 3d | 5 | 1.01mi |
| 15001 35th Ave W Lynnwood, WA | 1.0–3.0 | 1.0–2.0 | 885 | $2,400 | $2.71 | 1d | 15 | 1.04mi |
| 1830 145th St SW Lynnwood, WA | 3.0 | 2.5 | 1873 | $3,500 | $1.87 | 18d | 1 | 1.04mi |
| 3406 151st Pl SW Unit Na Lynnwood, WA | 3.0 | 2.5 | 1418 | $3,059 | $2.16 | 0d | 1 | 1.12mi |
| 12907 E Gibson Rd Everett, WA | 1.0–2.0 | 1.0–2.0 | 859 | $2,085 | $2.43 | 6d | 4 | 1.13mi |
| 12907 E Gibson Rd Everett, WA | 1.0–2.0 | 1.0–2.0 | 775 | $1,725 | $2.23 | 1d | 7 | 1.13mi |
| 11625 Center Rd Unit C Everett, WA | 3.0 | 2.5 | 1608 | $3,200 | $1.99 | 45d | 1 | 1.16mi |
| 12402 Admiralty Way Everett, WA | 1.0–3.0 | 1.0–2.0 | 842 | $2,370 | $2.81 | 4d | 16 | 1.16mi |
| 12433 Admiralty Way Everett, WA | 1.0–3.0 | 1.0–3.0 | 1244 | $3,099 | $2.49 | 1d | 34 | 1.16mi |
| 1007 130th St SW Everett, WA | 1.0–2.0 | 1.0–2.0 | 796 | $1,800 | $2.26 | 0d | 9 | 1.23mi |
| 2301 116th St SW Unit E Everett, WA | 3.0 | 2.5 | 1400 | $2,595 | $1.85 | 45d | 1 | 1.25mi |
| 14615 Madison Way Lynnwood, WA | 2.0–4.0 | 2.0 | 1288 | $2,045 | $1.59 | 6d | 1 | 1.27mi |
| 14925 44th Ave W Unit B3 Lynnwood, WA | 2.0 | 2.5 | 1419 | $3,000 | $2.11 | 4d | 1 | 1.28mi |
| 12101 Greenhaven Mukilteo, WA | 1.0–3.0 | 1.0–2.5 | 1075 | $3,985 | $3.71 | 0d | 16 | 1.31mi |
| 14713 47th Ave W Lynnwood, WA | 3.0 | 2.0 | 1265 | $2,975 | $2.35 | 12d | 1 | 1.34mi |
| 12121 Admiralty Way Everett, WA | 1.0–3.0 | 1.0–2.0 | 1116 | $2,855 | $2.56 | 0d | 15 | 1.35mi |
| 12522 8th Ave W Everett, WA | 1.0–3.0 | 1.0–2.0 | 1005 | $2,496 | $2.48 | 1d | 9 | 1.38mi |
| 14029 9th Pl W Lynnwood, WA | 4.0 | 2.5 | 1777 | $3,200 | $1.80 | 6d | 1 | 1.40mi |
| 820 124th St SW Apt D Everett, WA | 2.0 | 1.5 | 960 | $1,595 | $1.66 | 6d | 1 | 1.44mi |
| 1717 153rd St SW Lynnwood, WA | 3.0 | 1.5 | 1372 | $3,100 | $2.26 | 45d | 1 | 1.46mi |
| 1730 112th St SW Everett, WA | 1.0–2.0 | 1.0–2.0 | 805 | $2,245 | $2.79 | 0d | 5 | 1.46mi |
| 15713 35th Ave W Lynnwood, WA | 3.0 | 2.0 | 1145 | $2,395 | $2.09 | 4d | 1 | 1.48mi |
| 15713 35th Ave W Lynnwood, WA | 2.0 | 1.0 | 940 | $2,000 | $2.13 | 26d | 1 | 1.48mi |
| 1602 151st Pl SW Lynnwood, WA | 3.0 | 2.5 | 1597 | $3,800 | $2.38 | 26d | 1 | 1.48mi |
| 11727 12th Ave W #77 Everett, WA | 3.0 | 2.5 | 1533 | $3,100 | $2.02 | 23d | 1 | 1.48mi |
| 2510 164th St SW Lynnwood, WA | 3.0 | 1.0–2.0 | 998 | $3,440 | $3.45 | 0d | 1 | 1.48mi |
| 11719 12th Ave W Everett, WA | 3.0 | 2.5 | 1533 | $2,800 | $1.83 | 46d | 1 | 1.49mi |
| 4109 156th St SW Unit B4 Lynnwood, WA | 2.0 | 1.0 | 985 | $1,995 | $2.03 | 45d | 1 | 1.50mi |
Listing history 6 events
-
2026-05-15status Pending
-
2026-04-29status Active
-
2026-04-20status Pending
-
2026-04-18price $110,000
-
2026-02-20price $125,000
-
2026-02-05$129,000 Active
ⓘ Source: listings_history table (triggers on properties + properties_extension) + one-shot
backfill from property_details.listing_events for pre-trigger history.
Tax reassessment forecast WA · Resets to sale price
- Current annual tax
- $743 · $62/mo
- Projected year-2 tax
- $1,078 · $90/mo
- Expected delta
- +$335/yr (+$28/mo · 45.0%)
ⓘ Screening estimate from a state-policy table — verify with the county assessor before closing.
Nearby sold comps map
Loading sold comps map…
Walkable amenities ~0.75 mi
Loading nearby amenities…
Taxation est. · year 1
- Rental income
- $30,791
- − Mortgage interest
- −$6,162
- − Property taxes
- −$743
- − Insurance
- −$550
- − Repairs & maintenance
- −$2,463
- − Management
- −$2,463
- − Depreciation
- −$3,200
- Taxable income
- $15,209
- Est. tax owed @ 24.0%
- −$3,650
- After-tax cash flow
- $12,459/yr
For passive investors: Depreciation is non-cash, so a rental often shows a tax loss while cash-flowing — sheltering income. Rental losses are passive: they offset passive income freely, and up to $25,000/yr can offset ordinary (W-2) income if you actively participate and your MAGI is under $100k (phasing out to $0 by $150k); unused losses carry forward. On sale, claimed depreciation is recaptured at up to 25%, and gains may owe capital-gains tax (a 1031 exchange can defer both). Figures are a year-1 estimate at your 24.0% rate — not tax advice; consult a CPA.
Schools (NCES district)
- District
- Mukilteo School District
- NCES district ID
- 5305430
- Math proficiency
- 47% ▼ -2.00%
- Reading proficiency
- 59% ▬ 0.00%
- Median HH income
- $60,807
- Composite
- 48.17/100
- National rank
- #4733
- State rank
- #111 of 291 in WA
Livability — Everett
- Score
- 73/100
- State rank
- #199
- US rank
- #5489
Category grades
Schools grade is shown separately in the Schools card above.
Census & demographics
- County
- Snohomish County · 786,756 people
- City population
- 173,457
- Metro
- Seattle-Tacoma-Bellevue, WA
- Population (ZIP)
- 45,130
- Household income
- $68,513
- Rent vs Own
- Severe rent burden
- 2874.0
Population outlook (Snohomish County) Hauer SSP2
- Today (2025)
- 899,800 people
- By 2030
- 960,975 · +6.8%
- By 2040
- 1,074,447 · +19.4%
- By 2050
- 1,171,954 · +30.2%
- By 2075
- 1,384,849 · +53.9%
- By 2100
- 1,497,296 · +66.4%
Race, ethnicity, and origin ACS 2023
- Neighborhood character
- Highly diverse neighborhood (Simpson 0.71)
- Race & ethnicity
- White 46% Hispanic / Latino 22% Asian 14% Two or more races 11% Black 9% Pacific Islander 2%
- Hispanic origin (detail)
- Mexican 17%
- Common ancestry
- Subsaharan African 4% Italian 2% Portuguese 2%
- Foreign-born
- 31% · Canada, Vietnam, South Korea
- Languages at home
- 58% English-only · Spanish 18% Russian/Polish/Slavic 6% Vietnamese 5%
Political lean MEDSL · Snohomish
- 2024 margin
- D (+19.0) · D 57.8% · R 38.9% · Other 3.3%
- 2008→2024 swing
- +0.1pp no change · 2008: 18.9pp · 2024: 19.0pp
- All cycles
- 2024: D+19.0 2020: D+20.6 2016: D+16.6 2012: D+16.2 2008: D+18.9
Not yet ingested
- Civics
- —
Market trends
- HPI YoY
- ▼ -540.03%
- Current HPI
- 321.7923
- Rent YoY
- ▼ -1.70%
- Metro
- Seattle-Tacoma-Bellevue, WA
- State GDP YoY
- ▲ 4.65%
- F500 in state
- 22
Industry mix (Fortune 500 HQ in WA)
| Industry | F500 HQs | Revenue |
|---|---|---|
| Retail | 2 | $269B |
|
||
| Technology / Retail | 1 | $638B |
|
||
| Technology | 1 | $245B |
|
||
| Telecommunications | 1 | $38B |
|
||
| Food / Beverage | 1 | $36B |
|
||
| Automotive / Trucks | 1 | $34B |
|
||
Price history
-14.7% since first listed6 events — show timeline
- 2026-05-15 Pending — NWMLS as Distributed by MLS Grid
- 2026-04-29 Relisted — NWMLS as Distributed by MLS Grid
- 2026-04-20 Pending — NWMLS as Distributed by MLS Grid
- 2026-04-18 Price Changed $110,000 NWMLS as Distributed by MLS Grid
- 2026-02-20 Price Changed $125,000 NWMLS as Distributed by MLS Grid
- 2026-02-05 Listed $129,000 NWMLS as Distributed by MLS Grid
Property tax history
+9.5%/yrLatest (2026): $743 · -11.2% YoY. Source: county tax records.
Cash-flow waterfall
monthlySold comps — $/sqft
last 12 mo · ≤1 miLoading sold comps…