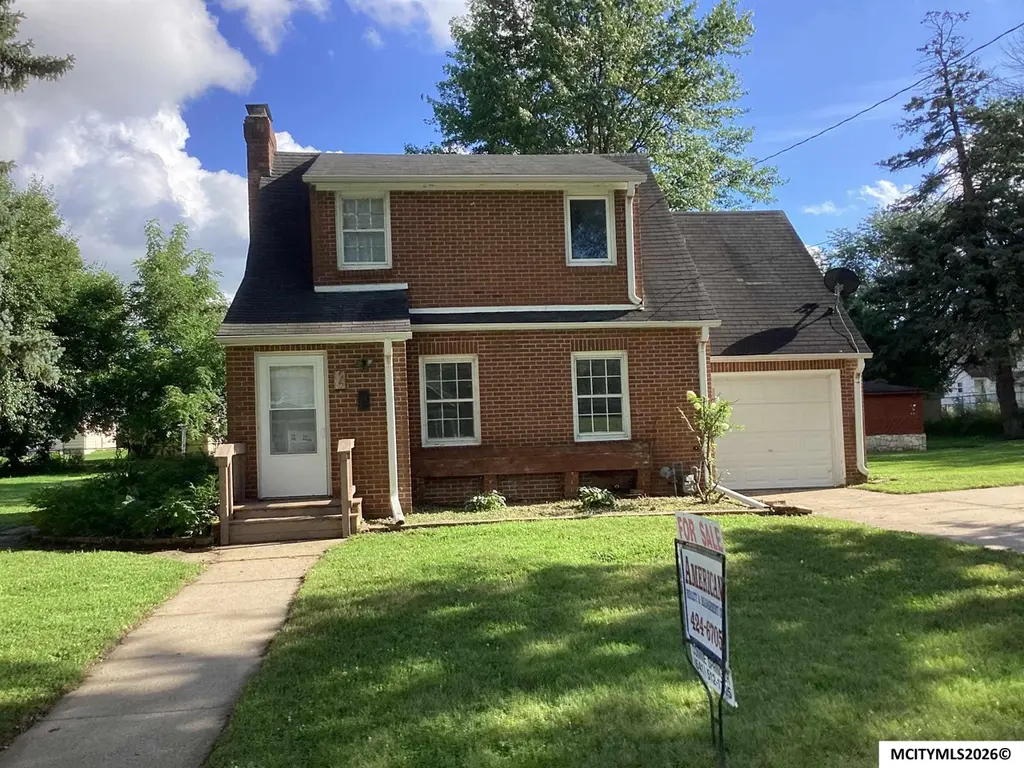
717 1st St SW · Mason City, IA
Flood risk 1/10 · Minimal
- FEMA flood zone
- X (unshaded)
- Chance of flooding over 30 yrs
- 0.0%
- Est. flood insurance / yr
- $473 – $860
Fire risk 2/10 · Minimal
- Est. fire insurance / yr
- $902 – $1,676
Heat risk 2/10 · Minimal
- Hot days now (above 101°F)
- 7 days/yr
- Hot days in 30 yrs
- 16 days/yr
Wind risk 2/10 · Minimal
- Chance of severe wind over 30 yrs
- —
Air-quality risk 1/10 · Minimal
- Unhealthy air days now
- 0 days/yr
- Unhealthy air days in 30 yrs
- 0 days/yr
Risk factors via First Street. Map © Google.
Why this score? — see what drove the C grade
The composite is a weighted blend of 9 inputs, each scored 0–100. Each bar is that input's sub-score; the figure is the points it added to the 100-point composite (weight × sub-score).
- Cash flow +24.5/30.0
- DSCR +7.9/10.0
- 1% rule +5.9/10.0
- Schools +4.5/10.0
- Livability +4.0/5.0
- ARV discount +3.6/15.0
- Rent growth +2.5/5.0
- Condition / age +2.5/5.0
- Appreciation +0.0/10.0
$142,100
🖨 Deal sheet 📄 Offer letter ✓ Due diligence
Listing remarks MLS
Nice brick home only 2 block's from the hospital. 2 bedroom home new carpet, oak floor's wood burning fireplace large storage shed. Large lot 3 parcel's 125x137 Priced to sell call today to see.
Key facts
- Open floor plan
- Fresh paint
- New doors
Tags
Property features AI
Exterior
- Parking: Attached garage; 1 garage space; Concrete driveway; Garage door opener
- Utilities: Public water; Public sewer
- Home design: Single-family residence; 2 stories total; Residential property
- Construction: Brick construction; Below-grade finished area (180)
- Exterior features: Asphalt roof; Shed(s)
Interior
- Kitchen: Dishwasher; Electric range; Microwave; Refrigerator
- Flooring: Carpet; Vinyl; Wood
- Heating & cooling: Radiant heating; Window air conditioning units
- Interior features: Full, partially finished basement; Dishwasher; Electric range; Microwave; Refrigerator
Neighborhood map
What this means for you Summary
Snapshot
- This is a 3-bed/1.5-bath single-family listed at $142k.
Deal economics
- At list price, monthly cash flow is $291 ($3k/yr) — positive.
- The deal already cash-flows at list — no discount required.
- Meets the 1% rule at list price ($2k rent vs $142k).
- Recommended offer: $138k (3.0% below list) — sets the bar for market timing.
- Cap rate 8.7% vs local median 5.2% in Mason City — top-decile yield for the area; either an underpriced asset or a hidden risk that comps aren't pricing in. Stress-test before assuming the spread holds.
Location & tenants
- Location reads 81/100 on livability (#67 in IA, #1,477 nationally) — a professional / high-income tenant draw. Strengths: commute A+, cost of living A+, housing A+; Watch: amenities F.
- Mason City Community School District (town): math 50% / reading 58% proficiency, ranked #271 of 289 in IA (top 94%) — acceptable for families but not a draw, mixed tenant base, ~2y average lease.
- Market conditions: 153 active listings in the ZIP; 3 comparable units currently listed for rent nearby; rentals lingering (median 44d on market — plan ~5-8 weeks vacancy on turnover, expect pricing pressure); 100% of comp listings sitting > 30 days — soft ceiling on asking rent; 54 units permitted in Cerro Gordo County in 2024 (6 in 5+ unit buildings).
Forward outlook
- Local home prices are declining (-3.0%/yr); year-one equity from $982 of loan paydown is wiped out by about $4k of value loss. Plan a longer hold.
- Cerro Gordo County population projected at -18% by 2050 — secular population decline; favor cash flow + early exit over multi-decade hold.
Negotiation context
- It's been on market 49 days — a 3% lower offer ($138k) is reasonable based on typical stale-listing flexibility.
- 3 sale attempts since 9y ago with the ask held roughly flat each time — persistent listings suggest the price (not the market) is what's stuck; bring a comps-based counter.
- Current owner paid $65k; list at $142k implies a 119% gain — meaningful room to come down on a strong offer.
Risks & watch-outs
- Watch-outs: built in 1940 — expect roof / HVAC / electrical / plumbing capex.
Questions for the listing agent
- It's been on market 49 days. Have you received any prior offers? Is the seller open to a 3% concession, seller financing, or rate buy-down credit?
- Built in 1940 — when were the roof, HVAC, electrical panel, plumbing, and water heater last replaced?
- Is there a deadline driving the sale (1031 exchange, divorce, estate, relocation)? That informs how much negotiation room exists.
- What's the average days-on-market for RENTAL listings here right now (not sales)? A rising rental-DOM trend means longer vacancies and softer asking-rent achievability than the comps imply.
- What's the recent tenant-quality profile in this submarket — average credit score on applications, eviction rate, late-payment / NSF rate, and stable-employment percentage? A property-management company in the area should have these aggregated.
- How much new for-sale + rental construction is in the pipeline within 1–3 miles? Heavy new supply typically softens prices + rents 12–24 months out; constrained supply supports both.
Investment metrics
- 1% rule
- 1.09% ✓
- Cap rate
- 8.75%
- Cash-on-cash
- 8.76%
- DSCR
- 1.39
- GRM
- 7.7
CMA / ARV
- ARV (median comp)
- $130,809
- List price
- $142,100
- Delta
- 8.63%
- Verdict
- FAIR
- Comps
- 20 within 1.0 mi
Show comp detail 12 sales within ~0.75 mi
| Address | Dist | Beds/Ba | Sqft | Sold | Price | $/sf | Match |
|---|---|---|---|---|---|---|---|
| 117 S Monroe Ave | 0.20mi | 3/1.5 | 1,089 (-9%) | 1mo | $77,000 | $71 | 75 |
| 726 1st St SW | 0.04mi | 2/1.2 (-1) | 1,064 (-11%) | 0mo | $144,000 | $135 | 74 |
| 1025 2nd St NW | 0.33mi | 2/1.8 (-1) | 1,188 (-1%) | 5mo | $84,000 | $71 | 74 |
| 913 4th St SW | 0.25mi | 4/1.5 (+1) | 1,312 (+10%) | 4mo | $127,000 | $97 | 64 |
| 856 1st St NW | 0.25mi | 3/1.0 | 1,054 (-12%) | 5mo | $146,000 | $139 | 63 |
| 615 S Polk PL Pl | 0.42mi | 2/1.0 (-1) | 1,120 (-6%) | 4mo | $115,500 | $103 | 60 |
| 6 Willowbrook Dr Dr | 0.60mi | 2/1.5 (-1) | 1,250 (+5%) | 2mo | $145,000 | $116 | 58 |
| 125 4th St NW | 0.52mi | 3/1.5 | 1,336 (+12%) | 1mo | $151,000 | $113 | 55 |
| 194 N Crescent Dr Dr | 0.34mi | 3/2.0 | 1,364 (+14%) | 5mo | $125,000 | $92 | 55 |
| 147 N Crescent Dr Dr | 0.26mi | 2/1.0 (-1) | 1,022 (-14%) | 3mo | $112,500 | $110 | 54 |
| 728 S Harrison Ave | 0.48mi | 3/1.0 | 1,032 (-14%) | 6mo | $146,000 | $141 | 48 |
| 616 S President Ave | 0.54mi | 4/2.0 (+1) | 1,374 (+15%) | 3mo | $123,000 | $90 | 40 |
Match score weights: distance 35% · size 25% · config 20% · recency 20%. Top-matched comps best support the ARV.
Projected returns pro-forma
-3.0% appreciation · 3.0% rent growth · sell at horizon
- IRR
- -3.0%
- Equity multiple
- 0.89×
- Total profit
- $-4,530
- Equity at exit
- $21,188
- IRR
- 6.7%
- Equity multiple
- 1.50×
- Total profit
- $19,847
- Equity at exit
- $12,286
Cash invested: $39,788 (down + closing). Projections, not guarantees.
Landlord ↔ Tenant lean methodology
- Overall (STATE)
- 83 Strongly Landlord-Friendly
- State Iowa
- 83 Strongly Landlord-Friendly · R+6
- County
- — inherits STATE
- City
- — inherits STATE
ZIP-level market 50401
- Active inventory
- 153
- Price-to-rent
- 7.7×
Monthly cashflow live
- Estimated rent
- $1,544 medium interval (Pro) →
- Mortgage (P&I)
- −$745
- Tax from tax record
- −$124 /mo · $1,494/yr
- Insurance
- −$59
- HOA
- −$0
- Vacancy / Maint / Mgmt
- −$324
- Net cashflow
- $291
Break-even live
UW: 25.0% down · 7.5% · 30yr · 1.5% tax · 5.0% vac · 8.0% maint · 8.0% mgmt
Financing live
Cash to close
- Down payment
- $35,525
- Closing costs
- $4,263
- Reserves months
- —
- Total cash needed
- —
Loan-product check · same deal, 3 products live
Conventional
25% down · 7.5% · 30yr
- Down + closing
- —
- Monthly P&I
- —
- Monthly cashflow
- —
- DSCR
- —
- Eligible?
- —
Personal DTI + credit; lowest rate.
DSCR
20% down · 8.5% · 30yr
- Down + closing
- —
- Monthly P&I
- —
- Monthly cashflow
- —
- DSCR
- —
- Eligible?
- —
No personal income docs; deal must DSCR.
Hard money
10% down · 12.0% · 12mo
- Down + closing
- —
- Monthly P&I
- —
- Monthly cashflow
- —
- DSCR
- —
- Eligible?
- —
Short-term bridge; refi at stabilization.
Rent comps 3 comps
| Address | Beds | Baths | Sqft | Rent | $/sqft | DOM | Units | Dist |
|---|---|---|---|---|---|---|---|---|
| 215 2nd St SW Unit 100-210 Mason City, IA | 3.0 | 2.0 | 1273 | $1,580 | $1.24 | 43d | 1 | 0.36mi |
| 12 2nd St NE Unit 6 Mason City, IA | 2.0 | 1.0 | 1296 | $1,600 | $1.23 | 43d | 1 | 0.61mi |
| 110 N Delaware Ave Unit 211 Mason City, IA | 2.0 | 1.0 | 919 | $1,395 | $1.52 | 43d | 1 | 0.64mi |
Listing history 20 events
-
2026-06-18days on market $142,100 Active 49 DOM
-
2026-06-17days on market $142,100 Active 48 DOM
-
2026-06-16days on market $142,100 Active 47 DOM
-
2026-06-15days on market $142,100 Active 46 DOM
-
2026-06-13days on market $142,100 Active 44 DOM
-
2026-06-12days on market $142,100 Active 43 DOM
-
2026-06-09days on market $142,100 Active 40 DOM
-
2026-06-08days on market $142,100 Active 39 DOM
-
2026-06-07days on market $142,100 Active 38 DOM
-
2026-06-07days on market $142,100 Active 37 DOM
-
2026-06-04days on market $142,100 Active 34 DOM
-
2026-06-02days on market $142,100 Active 33 DOM
-
2026-06-01days on market $142,100 Active 32 DOM
-
2026-05-31days on market $142,100 Active 31 DOM
-
2026-05-31days on market $142,100 Active 30 DOM
-
2026-04-30$142,100 Active 361-char remark
-
2025-08-18$138,400 Active
-
2018-01-09soldstatus $65,000
-
2017-12-29soldstatus $65,000
Show marketing remark (194 chars)
Nice brick home only 2 block's from the hospital. 2 bedroom home new carpet, oak floor's wood burning fireplace large storage shed. Large lot 3 parcel's 125x137 Priced to sell call today to see.
-
2017-11-28$75,000
Show marketing remark (194 chars)
Nice brick home only 2 block's from the hospital. 2 bedroom home new carpet, oak floor's wood burning fireplace large storage shed. Large lot 3 parcel's 125x137 Priced to sell call today to see.
ⓘ Source: listings_history table (triggers on properties + properties_extension) + one-shot
backfill from property_details.listing_events for pre-trigger history.
Tax reassessment forecast IA · Partial reset (capped growth)
- Current annual tax
- $1,494 · $124/mo
- Projected year-2 tax
- $1,862 · $155/mo
- Expected delta
- +$368/yr (+$31/mo · 24.7%)
ⓘ Screening estimate from a state-policy table — verify with the county assessor before closing.
Climate risk First Street
- Flood 1/10 Low FEMA zone X (unshaded) · 0% chance over 30 yrs
- Wildfire 2/10 Low
- Heat 2/10 Low 7 d/yr ≥101°F today · 16 d/yr by 30 yrs out
- Wind 2/10 Low
- Air quality 1/10 Low 0 unhealthy d/yr today · 0 by 30 yrs out
Nearby sold comps map
Loading sold comps map…
Walkable amenities ~0.75 mi
Loading nearby amenities…
Taxation est. · year 1
- Rental income
- $18,523
- − Mortgage interest
- −$7,960
- − Property taxes
- −$1,494
- − Insurance
- −$710
- − Repairs & maintenance
- −$1,482
- − Management
- −$1,482
- − Depreciation
- −$4,134
- Taxable income
- $1,262
- Est. tax owed @ 24.0%
- −$303
- After-tax cash flow
- $3,184/yr
For passive investors: Depreciation is non-cash, so a rental often shows a tax loss while cash-flowing — sheltering income. Rental losses are passive: they offset passive income freely, and up to $25,000/yr can offset ordinary (W-2) income if you actively participate and your MAGI is under $100k (phasing out to $0 by $150k); unused losses carry forward. On sale, claimed depreciation is recaptured at up to 25%, and gains may owe capital-gains tax (a 1031 exchange can defer both). Figures are a year-1 estimate at your 24.0% rate — not tax advice; consult a CPA.
Schools (NCES district)
- District
- Mason City Community School District
- NCES district ID
- 1918780
- Math proficiency
- 50% ▼ -1.00%
- Reading proficiency
- 58% ▼ -7.00%
- Median HH income
- $43,668
- Composite
- 45.47/100
- National rank
- #2614
- State rank
- #271 of 289 in IA
Livability — Mason City
- Score
- 81/100
- State rank
- #67
- US rank
- #1477
Category grades
Schools grade is shown separately in the Schools card above.
Census & demographics
- Census place
- Mason City, IA
- City population
- 28,818
- Population (ZIP)
- 28,818
Population outlook (Cerro Gordo County) Hauer SSP2
- Today (2025)
- 41,080 people
- By 2030
- 39,746 · -3.2%
- By 2040
- 36,608 · -10.9%
- By 2050
- 33,682 · -18.0%
- By 2075
- 29,702 · -27.7%
- By 2100
- 27,399 · -33.3%
Race, ethnicity, and origin ACS 2023
- Neighborhood character
- Predominantly White (87%)
- Race & ethnicity
- White 87% Hispanic / Latino 6% Two or more races 5% Black 3% Asian 1%
- Hispanic origin (detail)
- Mexican 5%
- Common ancestry
- Portuguese 12% Iranian 2% Lithuanian 2%
- Foreign-born
- 2% · Canada, Vietnam
- Languages at home
- 96% English-only · Spanish 3% Other Asian/Pacific 1%
Political lean MEDSL · Cerro Gordo
- 2024 margin
- R (+11.7) · D 43.4% · R 55.0% · Other 1.6%
- 2008→2024 swing
- -32.5pp toward R · 2008: 20.8pp · 2024: -11.7pp
- All cycles
- 2024: R+11.7 2020: R+6.3 2016: R+7.7 2012: D+13.2 2008: D+20.8
Not yet ingested
- Civics
- —
Market trends
- HPI YoY
- ▼ -130.01%
- Current HPI
- 199.1966
- Rent YoY
- —
- Metro
- —
- State GDP YoY
- ▲ 2.48%
- F500 in state
- 4
Industry mix (Fortune 500 HQ in IA)
| Industry | F500 HQs | Revenue |
|---|---|---|
| Financial Services | 1 | $16B |
|
||
| Retail / Convenience | 1 | $15B |
|
||
Price history
+89.5% since first listed5 events — show timeline
- 2026-04-30 Listed $142,100 Greater Mason BOR
- 2025-08-18 Listed $138,400 Greater Mason BOR
- 2018-01-09 Sold (Public Records) $65,000 Public Records
- 2017-12-29 Sold (MLS) $65,000 Greater Mason BOR
- 2017-11-28 Listed $75,000 Greater Mason BOR
Property tax history
-1.2%/yrLatest (2025): $1,494 · +2.9% YoY. Source: county tax records.
Cash-flow waterfall
monthlySold comps — $/sqft
last 12 mo · ≤1 miLoading sold comps…