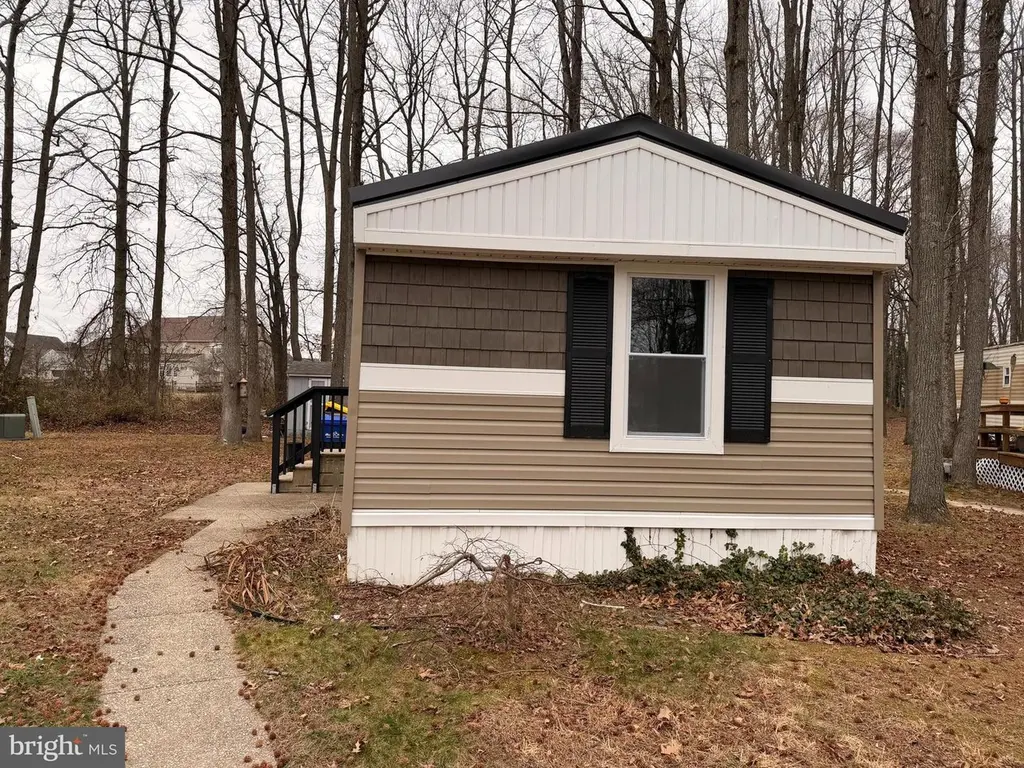
66 Juniper Ct #66 · Smyrna, DE
Flood risk 1/10 · Minimal
- FEMA flood zone
- X (unshaded)
- Chance of flooding over 30 yrs
- 0.0%
- Est. flood insurance / yr
- $507 – $1,088
Fire risk 1/10 · Minimal
- Est. fire insurance / yr
- $476 – $884
Heat risk 8/10 · Major
- Hot days now (above 102°F)
- 7 days/yr
- Hot days in 30 yrs
- 15 days/yr
Wind risk 6/10 · Moderate
- Chance of severe wind over 30 yrs
- 71.0%
Air-quality risk 2/10 · Minimal
- Unhealthy air days now
- 1 days/yr
- Unhealthy air days in 30 yrs
- 1 days/yr
Risk factors via First Street. Map © Google.
Why this score? — see what drove the C+ grade
The composite is a weighted blend of 9 inputs, each scored 0–100. Each bar is that input's sub-score; the figure is the points it added to the 100-point composite (weight × sub-score).
- Cash flow +30.0/30.0
- 1% rule +10.0/10.0
- DSCR +10.0/10.0
- Condition / age +4.0/5.0
- Livability +3.5/5.0
- Schools +2.8/10.0
- Rent growth +2.5/5.0
- ARV discount +0.0/15.0
- Appreciation +0.0/10.0
$72,000
🖨 Deal sheet (PDF) 📄 Offer letter ✓ Due diligence
Listing remarks MLS
Welcome home to 66 Juniper Court in Smyrna, DE! This beautifully updated 3-bedroom, 2-bath home is truly move-in ready. Enjoy peace of mind with a brand-new metal roof, new A/C and heating system, and new flooring throughout. The spacious layout offers comfortable living and plenty of natural light. A storage shed provides extra space for tools, hobbies, or outdoor equipment. Conveniently located and thoughtfully updated, this home is ready for you to move in today—just bring your furniture and make it your own!
Key facts
- Metal roof
- New flooring
- Storage shed
Tags
Neighborhood map
What this means for you Summary
Snapshot
- This is a 3-bed/2.0-bath single-family listed at $72k. Condition is rated good.
Deal economics
- At list price, monthly cash flow is $936 ($11k/yr) — positive.
- The deal already cash-flows at list — no discount required.
- Meets the 1% rule at list price ($2k rent vs $72k).
- Recommended offer: $63k (12.0% below list) — sets the bar for market timing.
- Cap rate 21.9% vs local median 3.6% in Smyrna — top-decile yield for the area; either an underpriced asset or a hidden risk that comps aren't pricing in. Stress-test before assuming the spread holds.
Location & tenants
- Location reads 69/100 on livability (#29 in DE) — a middle-class / working-renter tenant base. Strengths: cost of living A+, housing A+, health & safety A+; Watch: crime D-, amenities F, commute F.
- Smyrna School District (rural): math 22% / reading 39% proficiency, ranked #16 of 26 in DE (top 62%) — families likely to look elsewhere, expect single-tenant / working-renter base with shorter leases.
- Zoned schools: Smyrna Elementary School (math 27% / reading 32%, grade F, #50 of 105 statewide, top 53%, 474 students, 0% FRL); Smyrna Middle School (math 18% / reading 41%, grade F, #16 of 36 statewide, top 43%, 1,027 students, 0% FRL); Smyrna High School (math 21% / reading 45%, grade F, #22 of 40 statewide, top 56%, 1,807 students, 0% FRL) — zoned schools average 0% FRL vs 32% district-wide (32 pts lower); this property's tenant base skews higher-income than the district average.
- Market conditions: 224 active listings in the ZIP; 1,201 units permitted in Kent County in 2024 (116 in 5+ unit buildings).
Forward outlook
- Local home prices are declining (-3.0%/yr); year-one equity from $498 of loan paydown is wiped out by about $2k of value loss. Plan a longer hold.
- Kent County population projected at +22% by 2050 — long-run rental-demand tailwind backs the buy-and-hold thesis.
- At projected returns (-3.0% appreciation + 3.0% rent growth), your $20k cash investment doubles in ~3 years — after that, you're playing with house money.
Negotiation context
- It's been on market 167 days — a 12% lower offer ($63k) is reasonable based on typical stale-listing flexibility.
Risks & watch-outs
- Climate carrying-cost: major wind risk, 71% chance of damaging wind over 30y; extreme-heat days projected 7→15/yr by 2055 (HVAC capex compounding) — expect insurance premiums to compound above CPI over the hold.
Questions for the listing agent
- It's been on market 167 days. Have you received any prior offers? Is the seller open to a 12% concession, seller financing, or rate buy-down credit?
- Why hasn't it sold? Are there any deal-killer items the seller is aware of (foundation, flood, title, zoning, code violations)?
- Is there a deadline driving the sale (1031 exchange, divorce, estate, relocation)? That informs how much negotiation room exists.
- Crime grade is D in this area — have there been break-ins, vandalism, or insurance claims at this property in the last 3 years? What carrier currently insures it and at what premium?
- What's the average days-on-market for RENTAL listings here right now (not sales)? A rising rental-DOM trend means longer vacancies and softer asking-rent achievability than the comps imply.
- What's the recent tenant-quality profile in this submarket — average credit score on applications, eviction rate, late-payment / NSF rate, and stable-employment percentage? A property-management company in the area should have these aggregated.
- How much new for-sale + rental construction is in the pipeline within 1–3 miles? Heavy new supply typically softens prices + rents 12–24 months out; constrained supply supports both.
Investment metrics
- 1% rule
- 2.52% ✓
- Cap rate
- 21.89%
- Cash-on-cash
- 55.69%
- DSCR
- 3.48
- GRM
- 3.3
CMA / ARV
- ARV (median comp)
- $50,214
- List price
- $72,000
- Delta
- 43.39%
- Verdict
- OVERPRICED
- Comps
- 13 within 1.0 mi
Projected returns pro-forma
-3.0% appreciation · 3.0% rent growth · sell at horizon
- IRR
- 54.0%
- Equity multiple
- 3.38×
- Total profit
- $47,945
- Equity at exit
- $10,735
- IRR
- 59.2%
- Equity multiple
- 6.88×
- Total profit
- $118,586
- Equity at exit
- $6,225
Cash invested: $20,160 (down + closing). Projections, not guarantees.
Landlord ↔ Tenant lean methodology
- Overall (STATE)
- 70 Landlord-Friendly
- State Delaware
- 70 Landlord-Friendly · D+7
- County
- — inherits STATE
- City
- — inherits STATE
ZIP-level market 19977
- Home prices YoY
- -29.1%
- Active inventory
- 224
- Price-to-rent
- 3.3×
Monthly cashflow live
- Estimated rent
- $1,814 medium interval (Pro) →
- Mortgage (P&I)
- −$378
- Tax est. 1.5%
- −$90 /mo · $1,080/yr
- Insurance
- −$30
- HOA
- −$0
- Vacancy / Maint / Mgmt
- −$381
- Net cashflow
- $936
Break-even live
Sensitivity live
| Price | -10% $985 | -5% $960 | +0% $936 | +5% $911 | +10% $886 |
|---|---|---|---|---|---|
| Rent | -10% $792 | -5% $864 | +0% $936 | +5% $1,007 | +10% $1,079 |
| Rate | -1.0pp $972 | -0.5pp $954 | base $936 | +0.5pp $917 | +1.0pp $898 |
UW: 25.0% down · 7.5% · 30yr · 1.5% tax · 5.0% vac · 8.0% maint · 8.0% mgmt
Financing live
Cash to close
- Down payment
- $18,000
- Closing costs
- $2,160
- Reserves months
- —
- Total cash needed
- —
Loan-product check · same deal, 3 products live
Conventional
25% down · 7.5% · 30yr
- Down + closing
- —
- Monthly P&I
- —
- Monthly cashflow
- —
- DSCR
- —
- Eligible?
- —
Personal DTI + credit; lowest rate.
DSCR
20% down · 8.5% · 30yr
- Down + closing
- —
- Monthly P&I
- —
- Monthly cashflow
- —
- DSCR
- —
- Eligible?
- —
No personal income docs; deal must DSCR.
Hard money
10% down · 12.0% · 12mo
- Down + closing
- —
- Monthly P&I
- —
- Monthly cashflow
- —
- DSCR
- —
- Eligible?
- —
Short-term bridge; refi at stabilization.
Listing history 18 events
-
2026-06-22days on market $72,000 Active 167 DOM
-
2026-06-19days on market $72,000 Active 165 DOM
-
2026-06-18days on market $72,000 Active 164 DOM
-
2026-06-17days on market $72,000 Active 163 DOM
-
2026-06-16days on market $72,000 Active 162 DOM
-
2026-06-15days on market $72,000 Active 161 DOM
-
2026-06-14days on market $72,000 Active 159 DOM
-
2026-06-13days on market $72,000 Active 158 DOM
-
2026-06-10days on market $72,000 Active 156 DOM
-
2026-06-09days on market $72,000 Active 155 DOM
-
2026-06-08days on market $72,000 Active 154 DOM
-
2026-06-07days on market $72,000 Active 153 DOM
-
2026-06-05days on market $72,000 Active 150 DOM
-
2026-06-02days on market $72,000 Active 148 DOM
-
2026-06-01days on market $72,000 Active 147 DOM
-
2026-05-31days on market $72,000 Active 146 DOM
-
2026-05-30days on market $72,000 Active 145 DOM
-
2026-01-05$72,000 Active 523-char remark
Show marketing remark (523 chars)
Welcome home to 66 Juniper Court in Smyrna, DE! This beautifully updated 3-bedroom, 2-bath home is truly move-in ready. Enjoy peace of mind with a brand-new metal roof, new A/C and heating system, and new flooring throughout. The spacious layout offers comfortable living and plenty of natural light. A storage shed provides extra space for tools, hobbies, or outdoor equipment. Conveniently located and thoughtfully updated, this home is ready for you to move in today—just bring your furniture and make it your own!
ⓘ Source: listings_history table (triggers on properties + properties_extension) + one-shot
backfill from property_details.listing_events for pre-trigger history.
Climate risk First Street
- Flood 1/10 Low FEMA zone X (unshaded) · 0% chance over 30 yrs
- Wildfire 1/10 Low
- Heat 8/10 Severe 7 d/yr ≥102°F today · 15 d/yr by 30 yrs out
- Wind 6/10 Major 71% chance of damaging wind over 30 yrs
- Air quality 2/10 Low 1 unhealthy d/yr today · 1 by 30 yrs out
Nearby sold comps map
Loading sold comps map…
Walkable amenities ~0.75 mi
Loading nearby amenities…
Taxation est. · year 1
- Rental income
- $21,769
- − Mortgage interest
- −$4,033
- − Property taxes
- −$1,080
- − Insurance
- −$360
- − Repairs & maintenance
- −$1,742
- − Management
- −$1,742
- − Depreciation
- −$2,095
- Taxable income
- $10,718
- Est. tax owed @ 24.0%
- −$2,572
- After-tax cash flow
- $8,654/yr
For passive investors: Depreciation is non-cash, so a rental often shows a tax loss while cash-flowing — sheltering income. Rental losses are passive: they offset passive income freely, and up to $25,000/yr can offset ordinary (W-2) income if you actively participate and your MAGI is under $100k (phasing out to $0 by $150k); unused losses carry forward. On sale, claimed depreciation is recaptured at up to 25%, and gains may owe capital-gains tax (a 1031 exchange can defer both). Figures are a year-1 estimate at your 24.0% rate — not tax advice; consult a CPA.
Condition & rehab AI · 12 photos
This move-in ready home features updated interiors, a new roof, and HVAC system, making it an attractive option for both resale and rental.
Value-add opportunities
- Both Painting exterior and interior walls — Enhances curb appeal and interior aesthetics.
- Both Landscaping improvements — Enhances curb appeal and adds value to the property.
Renovation cost estimate screening
Value-add ROI direction
- Both Painting exterior and interior walls — Enhances curb appeal and interior aesthetics. ↑
- Both Landscaping improvements — Enhances curb appeal and adds value to the property. ↑
ⓘ Cost ranges are severity-bucket heuristics (US national rule-of-thumb). Get contractor quotes + a written scope before underwriting a rehab budget.
Schools (NCES district)
- District
- Smyrna School District
- NCES district ID
- 1001620
- Math proficiency
- 22% ▼ -25.00%
- Reading proficiency
- 39% ▼ -17.00%
- Median HH income
- $61,704
- Composite
- 27.67/100
- National rank
- #6915
- State rank
- #16 of 26 in DE
Livability — Smyrna
- Score
- 69/100
- State rank
- #29
- US rank
- #8702
Category grades
Schools grade is shown separately in the Schools card above.
Census & demographics
- Population (ZIP)
- 27,164
Population outlook (Kent County) Hauer SSP2
- Today (2025)
- 194,477 people
- By 2030
- 204,351 · +5.1%
- By 2040
- 222,135 · +14.2%
- By 2050
- 236,483 · +21.6%
- By 2075
- 266,327 · +36.9%
- By 2100
- 275,335 · +41.6%
Race, ethnicity, and origin ACS 2023
- Neighborhood character
- Diverse neighborhood (Simpson 0.59)
- Race & ethnicity
- White 56% Black 29% Two or more races 9% Hispanic / Latino 8% Asian 2%
- Hispanic origin (detail)
- Mexican 1% Puerto Rican 5% Dominican 1%
- Common ancestry
- Romanian 5% Hispanic 1% Iranian 1%
- Foreign-born
- 7% · Canada
- Languages at home
- 89% English-only · Spanish 4% French/Haitian/Cajun 2% Other Asian/Pacific 2%
Political lean MEDSL · Kent
- 2024 margin
- Toss-up / Even · D 50.2% · R 48.2% · Other 1.7%
- 2008→2024 swing
- -7.8pp toward R · 2008: 9.8pp · 2024: 2.0pp
- All cycles
- 2024: D+2.0 2020: D+4.1 2016: R+4.9 2012: D+4.9 2008: D+9.8
Not yet ingested
- Civics
- —
Market trends
- HPI YoY
- ▼ -110.14%
- Current HPI
- 267.998
- Rent YoY
- —
- Metro
- —
- State GDP YoY
- —
- F500 in state
- 0
Price history
1 event — show timeline
- 2026-01-05 Listed $72,000 BRIGHT MLS
Cash-flow waterfall
monthlySold comps — $/sqft
last 12 mo · ≤1 miLoading sold comps…