 🌊 Lakefront
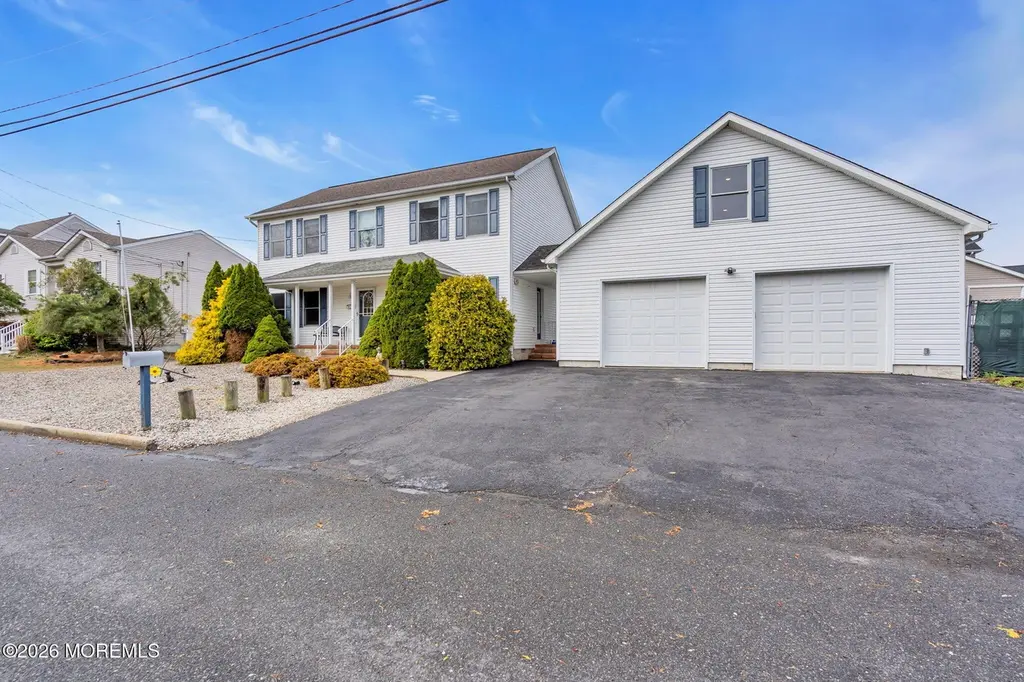
460 Cedar Dr · Forked River, NJ
Flood risk 8/10 · Major
- FEMA flood zone
- AE
- Chance of flooding over 30 yrs
- 0.99%
- Est. flood insurance / yr
- $1,737 – $8,500
Fire risk 4/10 · Minor
- Est. fire insurance / yr
- $526 – $976
Heat risk 7/10 · Major
- Hot days now (above 98°F)
- 7 days/yr
- Hot days in 30 yrs
- 15 days/yr
Wind risk 8/10 · Major
- Chance of severe wind over 30 yrs
- 80.0%
Air-quality risk 3/10 · Minor
- Unhealthy air days now
- 3 days/yr
- Unhealthy air days in 30 yrs
- 3 days/yr
Risk factors via First Street. Map © Google.
Why this score? — see what drove the C+ grade
The composite is a weighted blend of 9 inputs, each scored 0–100. Each bar is that input's sub-score; the figure is the points it added to the 100-point composite (weight × sub-score).
- Cash flow +30.0/30.0
- 1% rule +10.0/10.0
- DSCR +10.0/10.0
- Livability +3.1/5.0
- Schools +3.0/10.0
- Rent growth +2.5/5.0
- Condition / age +2.5/5.0
- ARV discount +0.0/15.0
- Appreciation +0.0/10.0
$1,060,000
🖨 Deal sheet 📄 Offer letter ✓ Due diligence
Listing remarks
Situated adjacent a national wildlife preserve with bay views and privacy in this quiet waterfront living area. This home offers an endless amount of opportunities. The spacious kitchen with new granite countertops and breakfast bar for optimal entertaining space. There is a formal dining room as well as space for eat in kitchen table. Enjoy those colder nights in front of the fireplace in the spacious living room. Upstairs you will find 4 generous sized bedrooms all with water views. You will enjoy the beautiful updated bathrooms with tiled showers and the primary bath offers a soaking tub with water views. The oversized workshop is a dream for the handy person or home business it offers w
Key facts
- Water views
- Formal dining room
- Spacious kitchen
Tags
Property features AI
Exterior
- Parking: Attached 2-car garage
- Utilities: Public sewer
- Home design: Single-family property
- Exterior features: Shingle roof; Waterfront property
Interior
- Kitchen: Dishwasher; Microwave; Stove; Refrigerator
- Bedrooms: 4 bedrooms
- Flooring: Ceramic tile
- Bathrooms: 2 full bathrooms and 1 half bathroom
- Heating & cooling: Forced air heating with 2 heat zones; 2-zone air conditioning
- Interior features: Ceiling fan(s); Fireplace; Crawl space basement
- Laundry & utility: Dryer
Neighborhood map
What this means for you Summary
Snapshot
- This is a 4-bed/3.0-bath single-family listed at $1.06M.
Deal economics
- At list price, monthly cash flow is $7k ($82k/yr) — positive.
- The deal already cash-flows at list — no discount required.
- Meets the 1% rule at list price ($18k rent vs $1.06M).
- Cap rate 14.5% vs local median 3.2% in Forked River — top-decile yield for the area; either an underpriced asset or a hidden risk that comps aren't pricing in. Stress-test before assuming the spread holds.
Location & tenants
- Location reads 61/100 on livability (#464 in NJ) — a middle-class / working-renter tenant base. Strengths: housing A+, crime A-, employment A-; Watch: amenities F, commute F, cost of living F.
- Lacey Township School District (suburban): math 22% / reading 43% proficiency, ranked #299 of 472 in NJ (top 63%) — families likely to look elsewhere, expect single-tenant / working-renter base with shorter leases; only 19% free/reduced lunch — higher-income household profile.
- Market conditions: 57 active listings in the ZIP; 2 comparable units currently listed for rent nearby; 4,434 units permitted in Ocean County in 2024 (868 in 5+ unit buildings).
Forward outlook
- Local home prices are declining (-3.0%/yr); year-one equity from $7k of loan paydown is wiped out by about $32k of value loss. Plan a longer hold.
- Ocean County population projected to shrink 8% by 2050 — rents likely to lag national; underwrite the cash flow, not the appreciation.
- At projected returns (-3.0% appreciation + 3.0% rent growth), your $297k cash investment doubles in ~5 years — after that, you're playing with house money.
Negotiation context
- Only 2 days on market — expect competitive offers; lowballing is unlikely to land.
- 2 sale attempts with the ask held roughly flat each time — persistent listings suggest the price (not the market) is what's stuck; bring a comps-based counter.
- Current owner paid $41k; list at $1.06M implies a 2501% gain — meaningful room to come down on a strong offer.
Risks & watch-outs
- Watch-outs: flood insurance adds $427/mo.
- Climate carrying-cost: in FEMA flood zone AE (mandatory federal flood insurance); severe wind risk, 80% chance of damaging wind over 30y; extreme-heat days projected 7→15/yr by 2055 (HVAC capex compounding) — expect insurance premiums to compound above CPI over the hold.
Questions for the listing agent
- What's the actual annual flood-insurance premium (NFIP or private), and is the property in a SFHA with mandatory coverage?
- Is there a deadline driving the sale (1031 exchange, divorce, estate, relocation)? That informs how much negotiation room exists.
- This sits on a lake — are riparian / water-frontage rights deeded with the parcel? Any dock permits, shoreline easements, or HOA water-use restrictions?
- What's the documented flood / surge / shoreline-erosion history here (FEMA AND non-FEMA — e.g., storm surge, creek backup, septic-field saturation)?
- Any water-quality or seasonal algae-bloom issues that affect tenant satisfaction or short-term-rental demand?
- What's the average days-on-market for RENTAL listings here right now (not sales)? A rising rental-DOM trend means longer vacancies and softer asking-rent achievability than the comps imply.
- What's the recent tenant-quality profile in this submarket — average credit score on applications, eviction rate, late-payment / NSF rate, and stable-employment percentage? A property-management company in the area should have these aggregated.
- How much new for-sale + rental construction is in the pipeline within 1–3 miles? Heavy new supply typically softens prices + rents 12–24 months out; constrained supply supports both.
Investment metrics
- 1% rule
- 1.70% ✓
- Cap rate
- 14.49%
- Cash-on-cash
- 29.26%
- DSCR
- 2.30
- GRM
- 4.9
CMA / ARV
- ARV (median comp)
- $846,571
- List price
- $1,060,000
- Delta
- 29.94%
- Verdict
- OVERPRICED
- Comps
- 20 within 1.0 mi
Show comp detail 12 sales within ~0.75 mi
| Address | Dist | Beds/Ba | Sqft | Sold | Price | $/sf | Match |
|---|---|---|---|---|---|---|---|
| 601 Laurel Blvd | 0.12mi | 4/2.5 | 2,290 (-6%) | 7mo | $795,000 | $347 | 76 |
| 825 Laurel Blvd | 0.28mi | 3/3.0 (-1) | 2,450 (+0%) | 11mo | $950,000 | $388 | 72 |
| 1005 Plimsoll Pt | 0.65mi | 4/3.0 | 2,394 (-2%) | 4mo | $806,000 | $337 | 63 |
| — | 0.08mi | 3/2.5 (-1) | 2,152 (-12%) | 15mo | $245,000 | $114 | 58 |
| 307 Cedar Dr | 0.55mi | 4/3.0 | 2,160 (-12%) | 2mo | $491,000 | $227 | 54 |
| 714 Laurel Blvd | 0.18mi | 3/2.5 (-1) | 2,083 (-15%) | 10mo | $710,000 | $341 | 52 |
| 227 Predmore Ave | 0.59mi | 4/2.0 | 2,310 (-5%) | 11mo | $452,000 | $196 | 50 |
| 201 Hemlock Dr | 0.71mi | 4/2.5 | 2,436 (-0%) | 21mo | $485,000 | $199 | 47 |
| — | 0.46mi | 3/2.5 (-1) | 2,310 (-5%) | 21mo | $575,000 | $249 | 45 |
| 202 Cedar Dr | 0.71mi | 4/2.0 | 2,128 (-13%) | 5mo | $454,250 | $213 | 38 |
| 406 Laurel Blvd | 0.44mi | 3/2.0 (-1) | 2,170 (-11%) | 20mo | $540,000 | $249 | 35 |
| 825 Oxgoose Dr | 0.68mi | 4/4.0 | 2,805 (+15%) | 11mo | $849,900 | $303 | 30 |
Match score weights: distance 35% · size 25% · config 20% · recency 20%. Top-matched comps best support the ARV.
Projected returns pro-forma
-3.0% appreciation · 3.0% rent growth · sell at horizon
- IRR
- 21.6%
- Equity multiple
- 1.88×
- Total profit
- $262,343
- Equity at exit
- $158,049
- IRR
- 29.7%
- Equity multiple
- 3.66×
- Total profit
- $788,364
- Equity at exit
- $91,649
Cash invested: $296,800 (down + closing). Projections, not guarantees.
Landlord ↔ Tenant lean methodology
- Overall (STATE)
- 21 Tenant-Leaning
- State New Jersey
- 21 Tenant-Leaning · D+6
- County
- — inherits STATE
- City
- — inherits STATE
ZIP-level market 08734
- Active inventory
- 57
- Price-to-rent
- 4.9×
Monthly cashflow live
- Estimated rent
- $18,029 medium interval (Pro) →
- Mortgage (P&I)
- −$5,559
- Tax from tax record
- −$1,006 /mo · $12,067/yr
- Insurance
- −$442
- Flood insurance flood zone
- −$427 /mo · $5,118/yr
- HOA
- −$0
- Vacancy / Maint / Mgmt
- −$3,786
- Net cashflow
- $6,811
Break-even live
UW: 25.0% down · 7.5% · 30yr · 1.5% tax · 5.0% vac · 8.0% maint · 8.0% mgmt
Financing live
Cash to close
- Down payment
- $265,000
- Closing costs
- $31,800
- Reserves months
- —
- Total cash needed
- —
Loan-product check · same deal, 3 products live
Conventional
25% down · 7.5% · 30yr
- Down + closing
- —
- Monthly P&I
- —
- Monthly cashflow
- —
- DSCR
- —
- Eligible?
- —
Personal DTI + credit; lowest rate.
DSCR
20% down · 8.5% · 30yr
- Down + closing
- —
- Monthly P&I
- —
- Monthly cashflow
- —
- DSCR
- —
- Eligible?
- —
No personal income docs; deal must DSCR.
Hard money
10% down · 12.0% · 12mo
- Down + closing
- —
- Monthly P&I
- —
- Monthly cashflow
- —
- DSCR
- —
- Eligible?
- —
Short-term bridge; refi at stabilization.
Rent comps 2 comps
| Address | Beds | Baths | Sqft | Rent | $/sqft | DOM | Units | Dist |
|---|---|---|---|---|---|---|---|---|
| 406 Lawrence Dr Lanoka Harbor, NJ | 3.0 | 2.0 | 1836 | $16,000 | $8.71 | 1d | 1 | 0.43mi |
| 821 Bunnell St Lanoka Harbor, NJ | 5.0 | 3.5 | 3012 | $20,000 | $6.64 | 15d | 1 | 0.45mi |
Listing history 4 events
-
2026-06-18days on market $1,060,000 Active 2 DOM
-
2026-06-16pricedays on market $1,060,000 Active 1 DOM
-
2026-04-24$1,100,000 Active 800-char remark
-
1998-06-30soldstatus $40,750
ⓘ Source: listings_history table (triggers on properties + properties_extension) + one-shot
backfill from property_details.listing_events for pre-trigger history.
Tax reassessment forecast NJ · Partial reset (capped growth)
- Current annual tax
- $12,067 · $1,006/mo
- Projected year-2 tax
- $19,230 · $1,603/mo
- Expected delta
- +$7,164/yr (+$597/mo · 59.4%)
ⓘ Screening estimate from a state-policy table — verify with the county assessor before closing.
Climate risk First Street
- Flood 8/10 Severe FEMA zone AE · 99% chance over 30 yrs
- Wildfire 4/10 Moderate
- Heat 7/10 Severe 7 d/yr ≥98°F today · 15 d/yr by 30 yrs out
- Wind 8/10 Severe 80% chance of damaging wind over 30 yrs
- Air quality 3/10 Moderate 3 unhealthy d/yr today · 3 by 30 yrs out
Nearby sold comps map
Loading sold comps map…
Walkable amenities ~0.75 mi
Loading nearby amenities…
Taxation est. · year 1
- Rental income
- $216,351
- − Mortgage interest
- −$59,376
- − Property taxes
- −$12,067
- − Insurance
- −$10,418
- − Repairs & maintenance
- −$17,308
- − Management
- −$17,308
- − Depreciation
- −$30,836
- Taxable income
- $69,037
- Est. tax owed @ 24.0%
- −$16,569
- After-tax cash flow
- $65,158/yr
For passive investors: Depreciation is non-cash, so a rental often shows a tax loss while cash-flowing — sheltering income. Rental losses are passive: they offset passive income freely, and up to $25,000/yr can offset ordinary (W-2) income if you actively participate and your MAGI is under $100k (phasing out to $0 by $150k); unused losses carry forward. On sale, claimed depreciation is recaptured at up to 25%, and gains may owe capital-gains tax (a 1031 exchange can defer both). Figures are a year-1 estimate at your 24.0% rate — not tax advice; consult a CPA.
Schools (NCES district)
- District
- Lacey Township School District
- NCES district ID
- 3408100
- Math proficiency
- 22% ▼ -18.00%
- Reading proficiency
- 43% ▼ -11.00%
- Median HH income
- $73,331
- Composite
- 30.42/100
- National rank
- #6242
- State rank
- #299 of 472 in NJ
Livability — Forked River
- Score
- 61/100
- State rank
- #464
- US rank
- #17753
Category grades
Schools grade is shown separately in the Schools card above.
Census & demographics
- Population (ZIP)
- 8,028
Population outlook (Ocean County) Hauer SSP2
- Today (2025)
- 586,991 people
- By 2030
- 581,403 · -1.0%
- By 2040
- 564,913 · -3.8%
- By 2050
- 538,149 · -8.3%
- By 2075
- 468,845 · -20.1%
- By 2100
- 350,297 · -40.3%
Race, ethnicity, and origin ACS 2023
- Neighborhood character
- Predominantly White (93%)
- Race & ethnicity
- White 93% Hispanic / Latino 5% Two or more races 3%
- Common ancestry
- Romanian 7% Subsaharan African 3% Slovak 3%
- Foreign-born
- 2% · Canada
- Languages at home
- 98% English-only · Spanish 1%
Political lean MEDSL · Ocean
- 2024 margin
- Solid R (+36.0) · D 31.4% · R 67.4% · Other 1.2%
- 2008→2024 swing
- -17.6pp toward R · 2008: -18.4pp · 2024: -36.0pp
- All cycles
- 2024: R+36.0 2020: R+28.7 2016: R+34.0 2012: R+17.7 2008: R+18.4
Not yet ingested
- Civics
- —
Market trends
- HPI YoY
- ▼ -225.83%
- Current HPI
- 368.8557
- Rent YoY
- —
- Metro
- —
- State GDP YoY
- ▲ 2.05%
- F500 in state
- 34
Industry mix (Fortune 500 HQ in NJ)
| Industry | F500 HQs | Revenue |
|---|---|---|
| Consumer Goods | 3 | $31B |
|
||
| Pharmaceuticals | 2 | $153B |
|
||
| Technology | 2 | $21B |
|
||
| Insurance | 2 | $20B |
|
||
| Healthcare | 2 | $19B |
|
||
| Financial Services | 1 | $70B |
|
||
Price history
+2501.2% since first listed3 events — show timeline
- 2026-06-09 Listed $1,060,000 MOMLS
- 2026-04-24 Listed $1,100,000 MOMLS
- 1998-06-30 Sold (Public Records) $40,750 Public Records
Property tax history
+2.8%/yrLatest (2025): $12,067 · +7.9% YoY. Source: county tax records.
Cash-flow waterfall
monthlySold comps — $/sqft
last 12 mo · ≤1 miLoading sold comps…