 🏷️ Likely Rental
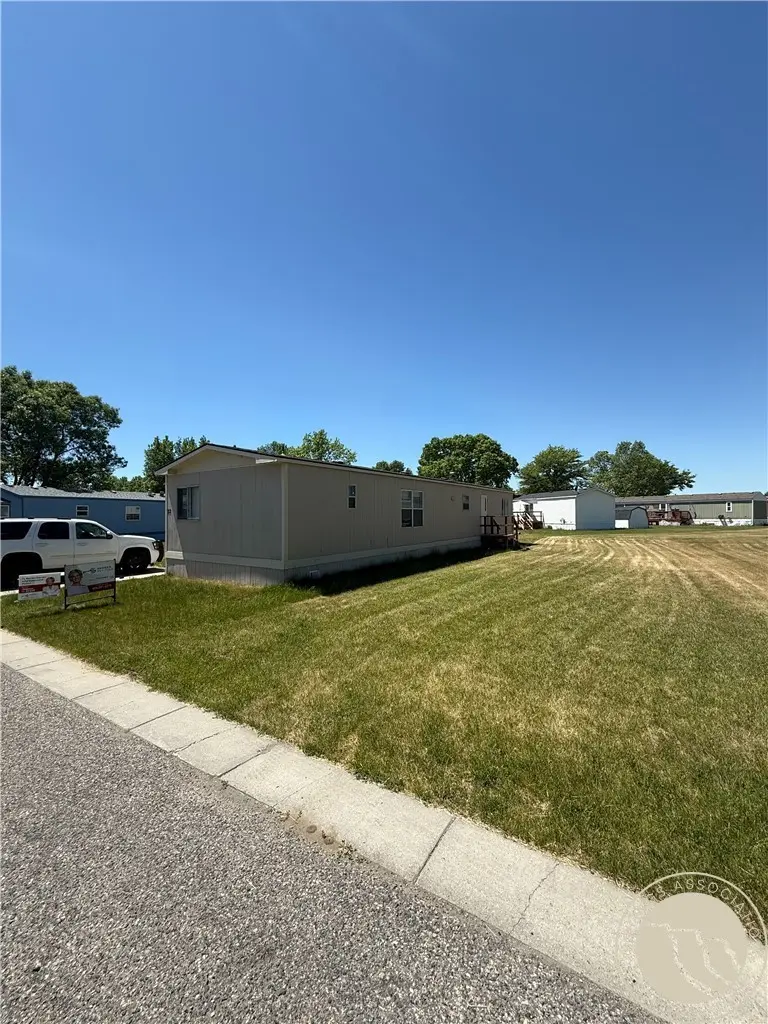
22 Willow Bend Dr · Billings, MT
Flood risk 1/10 · Minimal
- FEMA flood zone
- X (unshaded)
- Chance of flooding over 30 yrs
- 0.0%
- Est. flood insurance / yr
- $507 – $1,088
Fire risk 1/10 · Minimal
- Est. fire insurance / yr
- $918 – $1,706
Heat risk 3/10 · Minor
- Hot days now (above 95°F)
- 7 days/yr
- Hot days in 30 yrs
- 15 days/yr
Wind risk 1/10 · Minimal
- Chance of severe wind over 30 yrs
- —
Air-quality risk 4/10 · Minor
- Unhealthy air days now
- 3 days/yr
- Unhealthy air days in 30 yrs
- 5 days/yr
Risk factors via First Street. Map © Google.
Why this score? — see what drove the B+ grade
The composite is a weighted blend of 9 inputs, each scored 0–100. Each bar is that input's sub-score; the figure is the points it added to the 100-point composite (weight × sub-score).
- Cash flow +30.0/30.0
- ARV discount +15.0/15.0
- 1% rule +10.0/10.0
- DSCR +10.0/10.0
- Schools +4.5/10.0
- Livability +4.0/5.0
- Rent growth +3.8/5.0
- Condition / age +2.2/5.0
- Appreciation +0.0/10.0
$45,000
🖨 Deal sheet 📄 Offer letter ✓ Due diligence
Listing remarks MLS
Located in Golden Meadows Mobile Home Park. This home offers a functional floor plan with a spacious living area, a kitchen with ample cabinet space, and a primary bedroom with a private bath. Bring your ideas and make this home your own. With some updating and personal touches, this property offers a great opportunity for affordable homeownership in a convenient location. Enjoy access to community amenities including a neighborhood park and clubhouse available for resident use. Golden Meadows is also investing in future improvements. Lot rent is $950 per month and includes water, sewer, trash, and irrigation water for the lawn. Buyer must be approved by Golden Meadows Mobile Home Park and complete the online application. Info deemed reliable but not guaranteed. Buyer and buyer's agent to verify. Info deemed reliable but not guaranteed. Buyer/buyer agent to verify.
Key facts
- Spacious living area
- Private bath
- Community amenities
Tags
Property features AI
Finance
- Other: Zoned for residential manufactured homes
Exterior
- Parking: Covered parking for 3 vehicles; 3-car garage; On-street parking available
- Utilities: Shared well water; Public sewer
- Home design: Manufactured home (residential); Single-family residence
- Construction: Vinyl siding; Asphalt shingle roof; 1,080 above-grade finished area
- Exterior features: Front porch; Shed(s); Level lot
Interior
- Kitchen: Oven; Range; Refrigerator
- Bedrooms: 2 main-level bedrooms
- Bathrooms: 2 full bathrooms (both on the main level)
- Heating & cooling: Natural gas forced air heating; Window air conditioning units
- Interior features: Pantry; 4 total rooms; No basement
Neighborhood map
What this means for you Summary
Snapshot
- This is a 2-bed/2.0-bath manufactured listed at $45k. Condition is rated fair.
Deal economics
- At list price, monthly cash flow is $821 ($10k/yr) — positive.
- The deal already cash-flows at list — no discount required.
- Meets the 1% rule at list price ($1k rent vs $45k).
- Cap rate 28.2% vs local median 3.0% in Billings — top-decile yield for the area; either an underpriced asset or a hidden risk that comps aren't pricing in. Stress-test before assuming the spread holds.
Location & tenants
- Location reads 80/100 on livability (#10 in MT, #1,830 nationally) — a professional / high-income tenant draw. Strengths: amenities A+, commute A+, housing A+; Watch: crime F.
- Elysian Elementary (rural): math 48% / reading 58% proficiency, ranked #15 of 116 in MT (top 13%) — acceptable for families but not a draw, mixed tenant base, ~2y average lease.
- Zoned schools: Elysian School (math 47% / reading 62%, grade C, #57 of 293 statewide, top 22%, 307 students, 0% FRL); Elysian Middle School (math 47% / reading 52%, grade C, #26 of 146 statewide, top 22%, 144 students, 0% FRL) — zoned schools average 0% FRL vs 29% district-wide (29 pts lower); this property's tenant base skews higher-income than the district average.
- Market conditions: Rents rising fast (+5.0%/yr); 197 active listings in the ZIP; 10 comparable units currently listed for rent nearby; rentals leasing fast (median 13d on market — plan ~1-2 weeks tenant-placement turnaround); solid renter incomes; 1,401 units permitted in Yellowstone County in 2024 (281 in 5+ unit buildings).
Forward outlook
- Local home prices are declining (-3.0%/yr); year-one equity from $311 of loan paydown is wiped out by about $1k of value loss. Plan a longer hold.
- Yellowstone County population projected at +26% by 2050 — long-run rental-demand tailwind backs the buy-and-hold thesis.
- At projected returns (-3.0% appreciation + 5.0% rent growth), your $13k cash investment doubles in ~2 years — after that, you're playing with house money.
Negotiation context
- Only 14 days on market — expect competitive offers; lowballing is unlikely to land.
- 2 sale attempts with the ask held roughly flat each time — persistent listings suggest the price (not the market) is what's stuck; bring a comps-based counter.
Questions for the listing agent
- Have any recent inspections been done? Can we get a copy of the seller's disclosures and any deferred-maintenance estimates?
- Is there a deadline driving the sale (1031 exchange, divorce, estate, relocation)? That informs how much negotiation room exists.
- Schools are D-rated, which usually means shorter tenancies and higher turnover. Who's the typical renter profile here, and what's been the actual vacancy rate?
- Crime grade is F in this area — have there been break-ins, vandalism, or insurance claims at this property in the last 3 years? What carrier currently insures it and at what premium?
- What's the average days-on-market for RENTAL listings here right now (not sales)? A rising rental-DOM trend means longer vacancies and softer asking-rent achievability than the comps imply.
- What's the recent tenant-quality profile in this submarket — average credit score on applications, eviction rate, late-payment / NSF rate, and stable-employment percentage? A property-management company in the area should have these aggregated.
- How much new for-sale + rental construction is in the pipeline within 1–3 miles? Heavy new supply typically softens prices + rents 12–24 months out; constrained supply supports both.
Investment metrics
- 1% rule
- 3.18% ✓
- Cap rate
- 28.19%
- Cash-on-cash
- 78.19%
- DSCR
- 4.48
- GRM
- 2.6
CMA / ARV
- ARV (on-the-fly)
- $62,640
- Comps found
- 12
Show comp detail 12 sales within ~0.75 mi
| Address | Dist | Beds/Ba | Sqft | Sold | Price | $/sf | Match |
|---|---|---|---|---|---|---|---|
| 4 W Meadow Dr | 0.27mi | 2/2.0 | 924 (-14%) | 5mo | $34,000 | $37 | 59 |
| 16 Brookpark Dr | 0.24mi | 3/2.0 (+1) | 1,226 (+14%) | 7mo | $40,000 | $33 | 55 |
| 36 Chestnut Dr | 0.45mi | 3/2.0 (+1) | 1,200 (+11%) | 2mo | $55,000 | $46 | 54 |
| 16 Bridlewood Dr | 0.29mi | 3/2.0 (+1) | 1,216 (+13%) | 9mo | $30,000 | $25 | 53 |
| 8 Redrock Dr | 0.28mi | 3/2.0 (+1) | 1,216 (+13%) | 10mo | $89,900 | $74 | 53 |
| 3 Redrock Dr | 0.31mi | 2/2.0 | 938 (-13%) | 14mo | $65,000 | $69 | 52 |
| 8 Brookpark Dr | 0.27mi | 3/— (+1) | 924 (-14%) | 8mo | $14,999 | $16 | 52 |
| 6 Northglen Dr | 0.46mi | 3/2.0 (+1) | 1,216 (+13%) | 3mo | $89,500 | $74 | 50 |
| 4 Redrock Dr | 0.29mi | 3/1.0 (+1) | 980 (-9%) | 18mo | $64,900 | $66 | 47 |
| 44 Bridlewood Dr Dr | 0.42mi | 2/2.0 | 1,216 (+13%) | 20mo | $70,000 | $58 | 42 |
| 20 Brookpark Dr Dr | 0.22mi | 3/1.0 (+1) | 924 (-14%) | 18mo | $22,900 | $25 | 41 |
| 14 Walnut Grove Dr | 0.41mi | 3/2.0 (+1) | 1,232 (+14%) | 20mo | $125,000 | $101 | 36 |
Match score weights: distance 35% · size 25% · config 20% · recency 20%. Top-matched comps best support the ARV.
Projected returns pro-forma
-3.0% appreciation · 5.03% rent growth · sell at horizon
- IRR
- 80.5%
- Equity multiple
- 4.81×
- Total profit
- $48,003
- Equity at exit
- $6,710
- IRR
- 84.5%
- Equity multiple
- 10.68×
- Total profit
- $121,988
- Equity at exit
- $3,891
Cash invested: $12,600 (down + closing). Projections, not guarantees.
Landlord ↔ Tenant lean methodology
- Overall (STATE)
- 82 Strongly Landlord-Friendly
- State Montana
- 82 Strongly Landlord-Friendly · R+11
- County
- — inherits STATE
- City
- — inherits STATE
ZIP-level market 59102
- Rents YoY
- 5.0%
- Active inventory
- 197
- Price-to-rent
- 2.6×
Monthly cashflow live
- Estimated rent
- $1,433 high interval (Pro) →
- Mortgage (P&I)
- −$236
- Tax est. 1.5%
- −$56 /mo · $675/yr
- Insurance
- −$19
- HOA
- −$0
- Vacancy / Maint / Mgmt
- −$301
- Net cashflow
- $821
Break-even live
UW: 25.0% down · 7.5% · 30yr · 1.5% tax · 5.0% vac · 8.0% maint · 8.0% mgmt
Financing live
Cash to close
- Down payment
- $11,250
- Closing costs
- $1,350
- Reserves months
- —
- Total cash needed
- —
Loan-product check · same deal, 3 products live
Conventional
25% down · 7.5% · 30yr
- Down + closing
- —
- Monthly P&I
- —
- Monthly cashflow
- —
- DSCR
- —
- Eligible?
- —
Personal DTI + credit; lowest rate.
DSCR
20% down · 8.5% · 30yr
- Down + closing
- —
- Monthly P&I
- —
- Monthly cashflow
- —
- DSCR
- —
- Eligible?
- —
No personal income docs; deal must DSCR.
Hard money
10% down · 12.0% · 12mo
- Down + closing
- —
- Monthly P&I
- —
- Monthly cashflow
- —
- DSCR
- —
- Eligible?
- —
Short-term bridge; refi at stabilization.
Rent comps 10 comps
| Address | Beds | Baths | Sqft | Rent | $/sqft | DOM | Units | Dist |
|---|---|---|---|---|---|---|---|---|
| 3290 Granger Ave E Billings, MT | 1.0–2.0 | 1.0 | 686 | $1,225 | $1.79 | 13d | 5 | 0.51mi |
| 371 Cape Cod Dr Billings, MT | 2.0 | 1.5 | 1175 | $1,495 | $1.27 | 20d | 1 | 0.90mi |
| 353 Cape Cod Dr Unit 3 Billings, MT | 2.0 | 1.0 | 1056 | $1,295 | $1.23 | 13d | 1 | 0.92mi |
| 3900 Olympic Blvd Billings, MT | 2.0–3.0 | 1.0–2.0 | 960 | $1,390 | $1.45 | 13d | 5 | 0.95mi |
| 3900 Victory Cir Billings, MT | 2.0 | 1.0 | 966 | $1,360 | $1.41 | 13d | 21 | 1.13mi |
| 2604 Phyllis Ln Billings, MT | 2.0–3.0 | 1.0 | 792 | $1,235 | $1.56 | 13d | 2 | 1.19mi |
| 218 Brookshire Blvd Billings, MT | 2.0 | 2.0 | 1128 | $1,445 | $1.28 | 20d | 1 | 1.28mi |
| 3040 Central Ave Billings, MT | 3.0 | 1.0–2.0 | 887 | $1,678 | $1.89 | 13d | 25 | 1.31mi |
| 1625 Annafeld Pkwy E #201 Billings, MT | 2.0 | 2.0 | 949 | $1,705 | $1.80 | 13d | 1 | 1.45mi |
| 1625 Annafeld Pkwy E Unit 203 Billings, MT | 2.0 | 2.0 | 1160 | $1,705 | $1.47 | 20d | 1 | 1.45mi |
Listing history 11 events
-
2026-06-19days on market $45,000 Active 14 DOM
-
2026-06-18days on market $45,000 Active 13 DOM
-
2026-06-17days on market $45,000 Active 12 DOM
-
2026-06-16days on market $45,000 Active 11 DOM
-
2026-06-15days on market $45,000 Active 10 DOM
-
2026-06-14days on market $45,000 Active 8 DOM
-
2026-06-13days on market $45,000 Active 7 DOM
-
2026-06-10days on market $45,000 Active 5 DOM
-
2026-06-09days on market $45,000 Active 4 DOM
-
2026-06-08days on market $45,000 Active 3 DOM
-
2026-06-07$45,000 Active 2 DOM
ⓘ Source: listings_history table (triggers on properties + properties_extension) + one-shot
backfill from property_details.listing_events for pre-trigger history.
Climate risk First Street
- Flood 1/10 Low FEMA zone X (unshaded) · 0% chance over 30 yrs
- Wildfire 1/10 Low
- Heat 3/10 Moderate 7 d/yr ≥95°F today · 15 d/yr by 30 yrs out
- Wind 1/10 Low
- Air quality 4/10 Moderate 3 unhealthy d/yr today · 5 by 30 yrs out
Nearby sold comps map
Loading sold comps map…
Walkable amenities ~0.75 mi
Loading nearby amenities…
Taxation est. · year 1
- Rental income
- $17,194
- − Mortgage interest
- −$2,521
- − Property taxes
- −$675
- − Insurance
- −$225
- − Repairs & maintenance
- −$1,376
- − Management
- −$1,376
- − Depreciation
- −$1,309
- Taxable income
- $9,713
- Est. tax owed @ 24.0%
- −$2,331
- After-tax cash flow
- $7,520/yr
For passive investors: Depreciation is non-cash, so a rental often shows a tax loss while cash-flowing — sheltering income. Rental losses are passive: they offset passive income freely, and up to $25,000/yr can offset ordinary (W-2) income if you actively participate and your MAGI is under $100k (phasing out to $0 by $150k); unused losses carry forward. On sale, claimed depreciation is recaptured at up to 25%, and gains may owe capital-gains tax (a 1031 exchange can defer both). Figures are a year-1 estimate at your 24.0% rate — not tax advice; consult a CPA.
Condition & rehab AI · 11 photos
This manufactured home requires moderate renovations to update the kitchen and bathrooms, and painting the interior. It is located in a mobile home park with community amenities, making it a good investment opportunity.
Repairs flagged
- Moderate Kitchen cabinets — Dated and in need of updating.
- Moderate Bathroom fixtures — Outdated and in need of replacement.
- Moderate Flooring — Worn and in need of replacement.
Value-add opportunities
- Resale Updating kitchen cabinets and appliances — Modernizing the kitchen will attract more buyers.
- Resale Updating bathrooms with new fixtures and flooring — Modernizing bathrooms will attract more buyers.
- Both Painting interior walls and ceilings — Improves the home's appearance and can increase both resale and rental value.
Renovation cost estimate screening
| Repair item | Severity | Est. cost |
|---|---|---|
| Kitchen cabinets · Dated and in need of updating. | Moderate | $3,000–15,000 |
| Bathroom fixtures · Outdated and in need of replacement. | Moderate | $3,000–15,000 |
| Flooring · Worn and in need of replacement. | Moderate | $3,000–15,000 |
| Total estimated repair cost · 3 items | $9,000–45,000 |
Value-add ROI direction
- Resale Updating kitchen cabinets and appliances — Modernizing the kitchen will attract more buyers. ↑
- Resale Updating bathrooms with new fixtures and flooring — Modernizing bathrooms will attract more buyers. ↑
- Both Painting interior walls and ceilings — Improves the home's appearance and can increase both resale and rental value. ↑
ⓘ Cost ranges are severity-bucket heuristics (US national rule-of-thumb). Get contractor quotes + a written scope before underwriting a rehab budget.
Schools (NCES district)
- District
- Elysian Elementary
- NCES district ID
- 3009840
- Math proficiency
- 48% ▼ -4.00%
- Reading proficiency
- 58% ▼ -4.00%
- Median HH income
- $47,094
- Composite
- 44.96/100
- National rank
- #2705
- State rank
- #15 of 116 in MT
Livability — Billings
- Score
- 80/100
- State rank
- #10
- US rank
- #1830
Category grades
Schools grade is shown separately in the Schools card above.
Census & demographics
- Census place
- Billings, MT
- County
- Yellowstone County · 159,426 people
- City population
- 147,124
- Metro
- Billings, MT
- Population (ZIP)
- 47,977
- Household income
- $76,141
- Rent vs Own
- Severe rent burden
- 1584.0
Population outlook (Yellowstone County) Hauer SSP2
- Today (2025)
- 176,227 people
- By 2030
- 185,619 · +5.3%
- By 2040
- 203,543 · +15.5%
- By 2050
- 221,100 · +25.5%
- By 2075
- 266,931 · +51.5%
- By 2100
- 301,141 · +70.9%
Race, ethnicity, and origin ACS 2023
- Neighborhood character
- Predominantly White (88%)
- Race & ethnicity
- White 88% Hispanic / Latino 6% Two or more races 5% Native American 2% Asian 1%
- Hispanic origin (detail)
- Mexican 4%
- Common ancestry
- Portuguese 10% Slovak 3% Lithuanian 3%
- Foreign-born
- 2% · Canada, Vietnam
- Languages at home
- 96% English-only · Spanish 2% Vietnamese 1%
Political lean MEDSL · Yellowstone
- 2024 margin
- Strong R (+27.1) · D 34.9% · R 62.0% · Other 3.1%
- 2008→2024 swing
- -20.8pp toward R · 2008: -6.3pp · 2024: -27.1pp
- All cycles
- 2024: R+27.1 2020: R+24.0 2016: R+27.1 2012: R+20.6 2008: R+6.3
Not yet ingested
- Civics
- —
Market trends
- HPI YoY
- ▼ -364.20%
- Current HPI
- 205.0915
- Rent YoY
- ▲ 5.03%
- Metro
- Billings, MT
- State GDP YoY
- ▲ 3.41%
- F500 in state
- 2
Industry mix (Fortune 500 HQ in MT)
| Industry | F500 HQs | Revenue |
|---|---|---|
| Technology / Analytics | 1 | $2B |
|
||
Price history
+0.0% since first listed2 events — show timeline
- 2026-06-05 Listed $45,000 MRMLS
- 2026-06-05 Listed $45,000 BMTMLS
Cash-flow waterfall
monthlySold comps — $/sqft
last 12 mo · ≤1 miLoading sold comps…