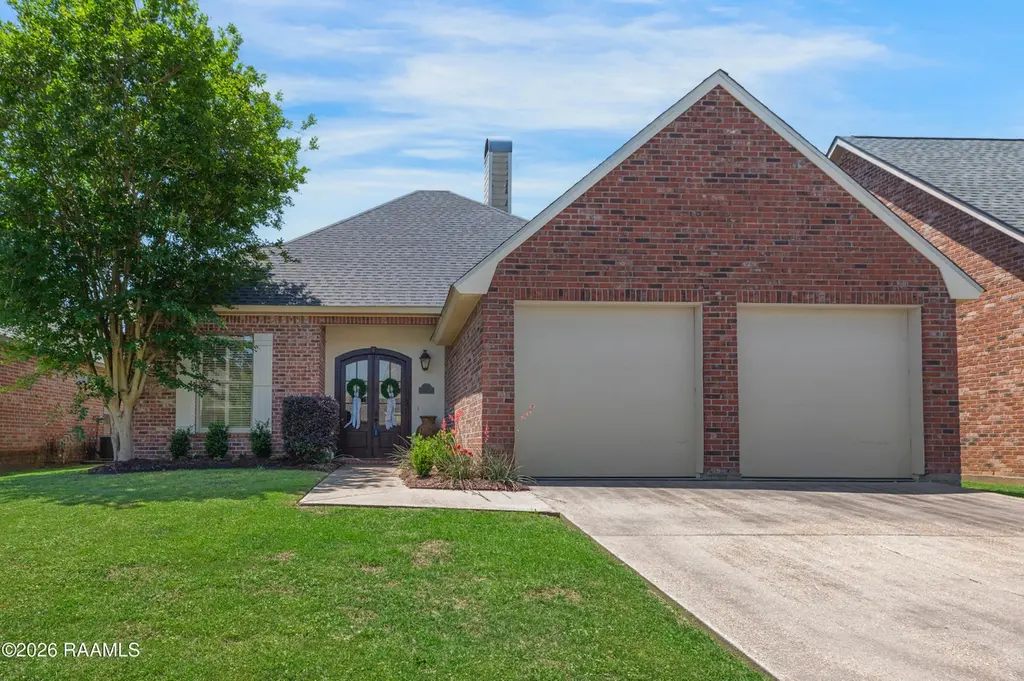
112 Tonbridge Dr · Lafayette, LA
Flood risk 6/10 · Moderate
- FEMA flood zone
- AE
- Chance of flooding over 30 yrs
- 0.74%
- Est. flood insurance / yr
- $1,737 – $8,500
Fire risk 1/10 · Minimal
- Est. fire insurance / yr
- $1,269 – $2,357
Heat risk 9/10 · Severe
- Hot days now (above 108°F)
- 7 days/yr
- Hot days in 30 yrs
- 22 days/yr
Wind risk 9/10 · Severe
- Chance of severe wind over 30 yrs
- 99.0%
Air-quality risk 2/10 · Minimal
- Unhealthy air days now
- 0 days/yr
- Unhealthy air days in 30 yrs
- 1 days/yr
Risk factors via First Street. Map © Google.
Why this score? — see what drove the D+ grade
The composite is a weighted blend of 9 inputs, each scored 0–100. Each bar is that input's sub-score; the figure is the points it added to the 100-point composite (weight × sub-score).
- Cash flow +17.3/30.0
- ARV discount +10.2/15.0
- DSCR +5.4/10.0
- 1% rule +4.1/10.0
- Schools +3.6/10.0
- Livability +3.5/5.0
- Rent growth +2.8/5.0
- Condition / age +2.5/5.0
- Appreciation +0.0/10.0
$294,000
🖨 Deal sheet (PDF) 📄 Offer letter ✓ Due diligence
Listing remarks MLS
NEW DESIGN WITH SEPARATE FORMAL DINING, WOOD FLOORS, SPLIT PLAN, CORNER FIREPLACE, BREAKFAST BAR, BEAUTIFUL DOUBLE CURVED FRONT DOORS WITH 3/4 GLASS.
Key facts
- Split floor plan
- New appliances
- Large back yard
Tags
Property features AI
Exterior
- Parking: Garage (approximately 2.5 spaces); Covered parking
- Utilities: Gas service: Atmos; Public sewer; Electric: City
- Home design: Single family residence; City street frontage
- Construction: Brick veneer, stucco, and frame construction; Composition roof
- Exterior features: Outdoor lighting; Covered patio/porch; Privacy wood fencing
Interior
- Kitchen: Dishwasher; Disposal; Microwave; Walk-in pantry; Tile countertops
- Flooring: Carpet; Tile; Wood
- Bathrooms: 2 full bathrooms
- Heating & cooling: Central heating; Central air conditioning
- Interior features: High ceilings; Crown molding; Double vanity; Standalone tub; Varied ceiling heights; Walk-in pantry; Walk-in closet(s); Tile countertops; Window treatments; Double-pane windows; 1 gas ventless fireplace
Neighborhood map
What this means for you Summary
Snapshot
- This is a 3-bed/2.0-bath single-family listed at $294k.
Deal economics
- At list price, monthly cash flow is $-212 ($-3k/yr) — negative.
- To cash-flow at today's rent, offer at most $257k (12.7% below list).
- To meet the 1% rule (rent ≥ 1% of price), the offer needs to be $266k (9.4% below list).
- Recommended offer: $257k (12.7% below list) — sets the bar for cash-flow.
- Cap rate 7.2% vs local median 4.7% in Lafayette — top-decile yield for the area; either an underpriced asset or a hidden risk that comps aren't pricing in. Stress-test before assuming the spread holds.
Location & tenants
- Location reads 70/100 on livability (#63 in LA) — a middle-class / working-renter tenant base. Strengths: cost of living A+, housing A+, health & safety A+; Watch: amenities C-, employment C-, crime F.
- Lafayette Parish (urban): math 38% / reading 46% proficiency, ranked #19 of 98 in LA (top 19%) — families likely to look elsewhere, expect single-tenant / working-renter base with shorter leases.
- Zoned schools: J. Wallace James Elementary School (math 46% / reading 49%, grade D, #147 of 646 statewide, top 23%, 939 students, 64% FRL); Edgar Martin Middle School (math 40% / reading 53%, grade D+, #41 of 218 statewide, top 19%, 490 students, 59% FRL); O. Comeaux High School (math 38% / reading 40%, grade F, #86 of 265 statewide, top 33%, 1,098 students, 56% FRL) — zoned schools at 60% FRL track the district average.
- Market conditions: Rents rising (+1.2%/yr); 473 active listings in the ZIP; 31 comparable units currently listed for rent nearby; rentals lingering (median 46d on market — plan ~5-8 weeks vacancy on turnover, expect pricing pressure); 52% of comp listings sitting > 30 days — soft ceiling on asking rent; solid renter incomes; 1,585 units permitted in Lafayette Parish in 2024 (10 in 5+ unit buildings).
- This rent runs 37% of the median local income ($86k/yr) — at the standard rent-burdened threshold; future hikes will face affordability resistance.
Forward outlook
- Local home prices are declining (-3.0%/yr); year-one equity from $2k of loan paydown is wiped out by about $9k of value loss. Plan a longer hold.
- Lafayette County population projected at +34% by 2050 — long-run rental-demand tailwind backs the buy-and-hold thesis.
Negotiation context
- It's been on market 37 days — a 3% lower offer ($285k) is reasonable based on typical stale-listing flexibility.
- 3 sale attempts since 25y ago with the ask held roughly flat each time — persistent listings suggest the price (not the market) is what's stuck; bring a comps-based counter.
Risks & watch-outs
- Watch-outs: flood insurance adds $427/mo.
- Climate carrying-cost: in FEMA flood zone AE (mandatory federal flood insurance); severe wind risk, 99% chance of damaging wind over 30y; extreme-heat days projected 7→22/yr by 2055 (HVAC capex compounding) — expect insurance premiums to compound above CPI over the hold.
Questions for the listing agent
- What do current leases actually rent for vs. the listed asking? Can we see a recent rent roll and the last 12 months of T-12 income?
- It's been on market 37 days. Have you received any prior offers? Is the seller open to a 13% concession, seller financing, or rate buy-down credit?
- What's the actual annual flood-insurance premium (NFIP or private), and is the property in a SFHA with mandatory coverage?
- Is there a deadline driving the sale (1031 exchange, divorce, estate, relocation)? That informs how much negotiation room exists.
- Schools are B-rated — typically a magnet for longer-tenancy family renters. What's the average tenant stay here, and is there a school-zone premium baked into asking?
- Crime grade is F in this area — have there been break-ins, vandalism, or insurance claims at this property in the last 3 years? What carrier currently insures it and at what premium?
- The area grade is low — what's the realistic commute time and amenity access for the typical tenant pool here? Any planned neighborhood developments (good or bad) we should know about?
- What's the average days-on-market for RENTAL listings here right now (not sales)? A rising rental-DOM trend means longer vacancies and softer asking-rent achievability than the comps imply.
- What's the recent tenant-quality profile in this submarket — average credit score on applications, eviction rate, late-payment / NSF rate, and stable-employment percentage? A property-management company in the area should have these aggregated.
- How much new for-sale + rental construction is in the pipeline within 1–3 miles? Heavy new supply typically softens prices + rents 12–24 months out; constrained supply supports both.
Investment metrics
- 1% rule
- 0.91% ✗
- Cap rate
- 7.17%
- Cash-on-cash
- 3.13%
- DSCR
- 1.14
- GRM
- 9.2
CMA / ARV
- ARV (median comp)
- $313,013
- List price
- $294,000
- Delta
- -6.07%
- Verdict
- FAIR
- Comps
- 20 within 1.0 mi
Show comp detail 12 sales within ~0.75 mi
| Address | Dist | Beds/Ba | Sqft | Sold | Price | $/sf | Match |
|---|---|---|---|---|---|---|---|
| 213 Durham Dr | 0.15mi | 3/2.0 | 1,757 (+3%) | 4mo | $295,000 | $168 | 85 |
| 219 Durham Dr | 0.18mi | 3/2.0 | 1,757 (+3%) | 4mo | $295,000 | $168 | 83 |
| 106 Dove Cir | 0.38mi | 3/2.0 | 1,651 (-4%) | 10mo | $230,000 | $139 | 68 |
| 122 Coconut Grove Cir | 0.41mi | 3/2.5 | 1,624 (-5%) | 4mo | $230,000 | $142 | 67 |
| 100 Coconut Grove Cir | 0.39mi | 3/2.5 | 1,617 (-5%) | 4mo | $237,500 | $147 | 67 |
| 108 Eldridge Dr | 0.18mi | 3/2.0 | 1,885 (+10%) | 10mo | $290,000 | $154 | 66 |
| 114 Swan Cir | 0.57mi | 3/2.0 | 1,603 (-6%) | 1mo | $232,500 | $145 | 62 |
| 101 Coconut Grove Cir | 0.37mi | 3/2.5 | 1,604 (-6%) | 13mo | $215,000 | $134 | 60 |
| 127 Meadowlark Loop | 0.49mi | 3/2.0 | 1,650 (-4%) | 14mo | $272,000 | $165 | 59 |
| 114 Tern Cir | 0.52mi | 3/2.0 | 1,753 (+2%) | 16mo | $257,500 | $147 | 58 |
| 210 Porch View Dr | 0.23mi | 3/3.0 | 1,947 (+14%) | 12mo | $415,000 | $213 | 52 |
| 114 Rose Of Sharon Ln | 0.65mi | 3/2.0 | 1,953 (+14%) | 11mo | $260,000 | $133 | 37 |
Match score weights: distance 35% · size 25% · config 20% · recency 20%. Top-matched comps best support the ARV.
Projected returns pro-forma
-3.0% appreciation · 1.23% rent growth · sell at horizon
- IRR
- -23.7%
- Equity multiple
- 0.20×
- Total profit
- $-65,575
- Equity at exit
- $43,836
- IRR
- -25.0%
- Equity multiple
- -0.12×
- Total profit
- $-92,059
- Equity at exit
- $25,420
Cash invested: $82,320 (down + closing). Projections, not guarantees.
Landlord ↔ Tenant lean methodology
- Overall (STATE)
- 90 Strongly Landlord-Friendly
- State Louisiana
- 90 Strongly Landlord-Friendly · R+12
- County
- — inherits STATE
- City
- — inherits STATE
ZIP-level market 70508
- Home prices YoY
- -34.7%
- Rents YoY
- 1.2%
- Active inventory
- 473
- Price-to-rent
- 9.2×
Monthly cashflow live
- Estimated rent
- $2,664 high interval (Pro) →
- Mortgage (P&I)
- −$1,542
- Tax from tax record
- −$226 /mo · $2,707/yr
- Insurance
- −$122
- Flood insurance flood zone
- −$427 /mo · $5,118/yr
- HOA
- −$0
- Vacancy / Maint / Mgmt
- −$559
- Net cashflow
- $-212
Break-even live
Sensitivity live
| Price | -10% $-45 | -5% $-129 | +0% $-212 | +5% $-295 | +10% $-378 |
|---|---|---|---|---|---|
| Rent | -10% $-422 | -5% $-317 | +0% $-212 | +5% $-107 | +10% $-1 |
| Rate | -1.0pp $-64 | -0.5pp $-137 | base $-212 | +0.5pp $-288 | +1.0pp $-365 |
UW: 25.0% down · 7.5% · 30yr · 1.5% tax · 5.0% vac · 8.0% maint · 8.0% mgmt
Financing live
Cash to close
- Down payment
- $73,500
- Closing costs
- $8,820
- Reserves months
- —
- Total cash needed
- —
Loan-product check · same deal, 3 products live
Conventional
25% down · 7.5% · 30yr
- Down + closing
- —
- Monthly P&I
- —
- Monthly cashflow
- —
- DSCR
- —
- Eligible?
- —
Personal DTI + credit; lowest rate.
DSCR
20% down · 8.5% · 30yr
- Down + closing
- —
- Monthly P&I
- —
- Monthly cashflow
- —
- DSCR
- —
- Eligible?
- —
No personal income docs; deal must DSCR.
Hard money
10% down · 12.0% · 12mo
- Down + closing
- —
- Monthly P&I
- —
- Monthly cashflow
- —
- DSCR
- —
- Eligible?
- —
Short-term bridge; refi at stabilization.
Rent comps 31 comps
| Address | Beds | Baths | Sqft | Rent | $/sqft | DOM | Units | Dist |
|---|---|---|---|---|---|---|---|---|
| 204 Student Ln Lafayette, LA | 3.0 | 2.0 | 1976 | $3,500 | $1.77 | 45d | 1 | 0.13mi |
| 215 Republic Ave Lafayette, LA | 1.0–2.0 | 1.0–2.0 | 863 | $1,455 | $1.69 | 15d | 16 | 0.14mi |
| 150 La Rue Vil Lafayette, LA | 3.0 | 2.0 | 1650 | $1,650 | $1.00 | 15d | 1 | 0.14mi |
| 202 Student Ln Lafayette, LA | 4.0 | 2.0 | 2017 | $4,000 | $1.98 | 45d | 1 | 0.14mi |
| 406 E Martial Ave Lafayette, LA | 4.0 | 2.0 | 2017 | $5,000 | $2.48 | 45d | 1 | 0.16mi |
| 404 E Martial Ave Lafayette, LA | 4.0 | 2.0 | 2017 | $4,000 | $1.98 | 45d | 1 | 0.16mi |
| 402 E Martial Ave Lafayette, LA | 3.0 | 2.0 | 1500 | $4,000 | $2.67 | 45d | 1 | 0.16mi |
| 115 La Rue Vil Lafayette, LA | 3.0 | 2.0 | 1860 | $1,900 | $1.02 | 46d | 1 | 0.17mi |
| 5530 Ambassador Caffrey Blvd Lafayette, LA | 1.0–3.0 | 1.0–2.0 | 1194 | $1,875 | $1.57 | 15d | 15 | 0.23mi |
| 110 E Martial Ave Lafayette, LA | 1.0–3.0 | 1.0–2.0 | 1047 | $1,535 | $1.47 | 15d | 5 | 0.30mi |
| 119 Coconut Grove Cir Lafayette, LA | 3.0 | 2.5 | 1600 | $1,800 | $1.12 | 45d | 1 | 0.45mi |
| 1521 Camellia Blvd Lafayette, LA | 1.0–3.0 | 1.0–2.0 | 1246 | $2,342 | $1.88 | 15d | 16 | 0.58mi |
| 110 Frem Boustany Dr Lafayette, LA | 1.0–3.0 | 1.0–2.0 | 1026 | $2,030 | $1.98 | 23d | 15 | 0.63mi |
| 201 Settlers Trace Blvd Lafayette, LA | 1.0–3.0 | 1.0–2.0 | 1024 | $1,848 | $1.80 | 15d | 12 | 0.82mi |
| 1510 Kaliste Saloom Rd #404 Lafayette, LA | 3.0 | 2.5 | 1398 | $4,000 | $2.86 | 45d | 1 | 0.98mi |
| 536 Settlers Trace Blvd Lafayette, LA | 1.0–3.0 | 1.0–2.0 | 1103 | $1,795 | $1.63 | 15d | 10 | 0.98mi |
| 105 Steiner Rd Lafayette, LA | 2.0 | 2.5 | 1190 | $2,900 | $2.44 | 23d | 1 | 1.02mi |
| 104 shirekeep Ln Lafayette, LA | 2.0 | 2.5 | 1311 | $1,985 | $1.51 | 15d | 1 | 1.05mi |
| 104 shirekeep Ln Lafayette, LA | 2.0 | 2.5 | 1311 | $2,075 | $1.58 | 45d | 1 | 1.05mi |
| 206 Steiner Oaks Lafayette, LA | 2.0 | 2.5 | 1200 | $2,975 | $2.48 | 45d | 1 | 1.05mi |
| 214 Steiner Oaks Lafayette, LA | 2.0 | 2.5 | 1190 | $1,900 | $1.60 | 45d | 1 | 1.05mi |
| 302 Richland Ave Unit 103C Lafayette, LA | 2.0 | 2.0 | 1409 | $4,200 | $2.98 | 45d | 1 | 1.06mi |
| 1042 Camellia Blvd Lafayette, LA | 1.0–2.0 | 1.0–2.0 | 880 | $1,941 | $2.21 | 15d | 10 | 1.26mi |
| 220 Steiner Rd Lafayette, LA | 2.0 | 2.5 | 1200 | $3,200 | $2.67 | 45d | 1 | 1.28mi |
| 107 Papwood Cir Lafayette, LA | 3.0 | 2.0 | 1805 | $2,000 | $1.11 | 23d | 1 | 1.32mi |
| 134 Sandest Dr Lafayette, LA | 3.0 | 2.0 | 1173 | $1,300 | $1.11 | 23d | 1 | 1.36mi |
| 210 Polly Ln Lafayette, LA | 1.0–3.0 | 1.0–2.0 | 1064 | $1,686 | $1.58 | 15d | 23 | 1.37mi |
| 1019 Kaliste Saloom Rd Lafayette, LA | 1.0–3.0 | 1.0–2.0 | 928 | $1,640 | $1.77 | 15d | 28 | 1.40mi |
| 108 Beaulac Ln Lafayette, LA | 2.0 | 2.0 | 1450 | $2,950 | $2.03 | 45d | 1 | 1.41mi |
| 106 Doubloon Dr Lafayette, LA | 2.0 | 2.0 | 1200 | $1,200 | $1.00 | 45d | 1 | 1.42mi |
| 113 Templeton Dr Lafayette, LA | 3.0 | 2.5 | 2050 | $3,000 | $1.46 | 45d | 1 | 1.49mi |
Listing history 8 events
-
2026-05-12price $298,000 553-char remark
-
2026-05-05price $298,500 553-char remark
-
2026-04-21$302,500 Active 553-char remark
-
2022-04-29soldstatus $276,000
-
2017-08-31soldstatus $140,000
-
2003-08-15soldstatus $181,400 149-char remark
Show marketing remark (149 chars)
NEW DESIGN WITH SEPARATE FORMAL DINING, WOOD FLOORS, SPLIT PLAN, CORNER FIREPLACE, BREAKFAST BAR, BEAUTIFUL DOUBLE CURVED FRONT DOORS WITH 3/4 GLASS.
-
2003-04-15$179,900 149-char remark
Show marketing remark (149 chars)
NEW DESIGN WITH SEPARATE FORMAL DINING, WOOD FLOORS, SPLIT PLAN, CORNER FIREPLACE, BREAKFAST BAR, BEAUTIFUL DOUBLE CURVED FRONT DOORS WITH 3/4 GLASS.
-
2001-11-26$30,000
ⓘ Source: listings_history table (triggers on properties + properties_extension) + one-shot
backfill from property_details.listing_events for pre-trigger history.
Tax reassessment forecast LA · Resets to sale price
- Current annual tax
- $2,707 · $226/mo
- Projected year-2 tax
- $2,707 · $226/mo
- Expected delta
- $0/yr ($0/mo · 0.0%)
ⓘ Screening estimate from a state-policy table — verify with the county assessor before closing.
Climate risk First Street
- Flood 6/10 Major FEMA zone AE · 74% chance over 30 yrs
- Wildfire 1/10 Low
- Heat 9/10 Extreme 7 d/yr ≥108°F today · 22 d/yr by 30 yrs out
- Wind 9/10 Extreme 99% chance of damaging wind over 30 yrs
- Air quality 2/10 Low 0 unhealthy d/yr today · 1 by 30 yrs out
Nearby sold comps map
Loading sold comps map…
Walkable amenities ~0.75 mi
Loading nearby amenities…
Taxation est. · year 1
- Rental income
- $31,968
- − Mortgage interest
- −$16,469
- − Property taxes
- −$2,707
- − Insurance
- −$6,589
- − Repairs & maintenance
- −$2,557
- − Management
- −$2,557
- − Depreciation
- −$8,553
- Taxable loss
- −$7,463
- Est. tax savings @ 24.0%
- +$1,791
- After-tax cash flow
- $-750/yr
For passive investors: Depreciation is non-cash, so a rental often shows a tax loss while cash-flowing — sheltering income. Rental losses are passive: they offset passive income freely, and up to $25,000/yr can offset ordinary (W-2) income if you actively participate and your MAGI is under $100k (phasing out to $0 by $150k); unused losses carry forward. On sale, claimed depreciation is recaptured at up to 25%, and gains may owe capital-gains tax (a 1031 exchange can defer both). Figures are a year-1 estimate at your 24.0% rate — not tax advice; consult a CPA.
Schools (NCES district)
- District
- Lafayette Parish
- NCES district ID
- 2200870
- Math proficiency
- 38% ▼ -32.00%
- Reading proficiency
- 46% ▼ -24.00%
- Median HH income
- $50,238
- Composite
- 36.15/100
- National rank
- #4741
- State rank
- #19 of 98 in LA
Livability — Lafayette
- Score
- 70/100
- State rank
- #63
- US rank
- #8133
Category grades
Schools grade is shown separately in the Schools card above.
Census & demographics
- Census place
- Lafayette, LA
- County
- Lafayette Parish · 207,544 people
- City population
- 158,114
- Metro
- Lafayette, LA
- Population (ZIP)
- 40,592
- Household income
- $86,005
- Rent vs Own
- Severe rent burden
- 1860.0
Population outlook (Lafayette County) Hauer SSP2
- Today (2025)
- 280,930 people
- By 2030
- 301,092 · +7.2%
- By 2040
- 339,456 · +20.8%
- By 2050
- 375,156 · +33.5%
- By 2075
- 451,672 · +60.8%
- By 2100
- 497,203 · +77.0%
Race, ethnicity, and origin ACS 2023
- Neighborhood character
- Predominantly White (75%)
- Race & ethnicity
- White 75% Black 13% Two or more races 7% Hispanic / Latino 5% Asian 3%
- Common ancestry
- Lithuanian 20% Slovak 2% Italian 1%
- Foreign-born
- 5% · Canada, China
- Languages at home
- 91% English-only · Spanish 3% French/Haitian/Cajun 2% Other Indo-European 1%
Political lean MEDSL · Lafayette
- 2024 margin
- Solid R (+31.4) · D 33.5% · R 64.8% · Other 1.7%
- 2008→2024 swing
- -0.1pp no change · 2008: -31.3pp · 2024: -31.4pp
- All cycles
- 2024: R+31.4 2020: R+28.7 2016: R+33.6 2012: R+33.7 2008: R+31.3
Not yet ingested
- Civics
- —
Market trends
- HPI YoY
- ▼ -76.28%
- Current HPI
- 143.6305
- Rent YoY
- ▲ 1.23%
- Metro
- Lafayette, LA
- State GDP YoY
- ▲ 3.29%
- F500 in state
- 10
Industry mix (Fortune 500 HQ in LA)
| Industry | F500 HQs | Revenue |
|---|---|---|
| Telecommunications | 2 | $23B |
|
||
| Utilities | 1 | $12B |
|
||
| Wholesale / Distribution | 1 | $5B |
|
||
| Advertising | 1 | $2B |
|
||
Price history
+880.0% since first listed10 events — show timeline
- 2026-05-28 Pending — AcadianaMLS
- 2026-05-22 Price Changed $294,000 AcadianaMLS
- 2026-05-12 Price Changed $298,000 AcadianaMLS
- 2026-05-05 Price Changed $298,500 AcadianaMLS
- 2026-04-21 Listed $302,500 AcadianaMLS
- 2022-04-29 Sold (Public Records) $276,000 Public Records
- 2017-08-31 Sold (Public Records) $140,000 Public Records
- 2003-08-15 Sold (MLS) $181,400 AcadianaMLS
- 2003-04-15 Listed $179,900 AcadianaMLS
- 2001-11-26 Listed $30,000 AcadianaMLS
Property tax history
+7.7%/yrLatest (2025): $2,707 · -1.1% YoY. Source: county tax records.
Cash-flow waterfall
monthlySold comps — $/sqft
last 12 mo · ≤1 miLoading sold comps…