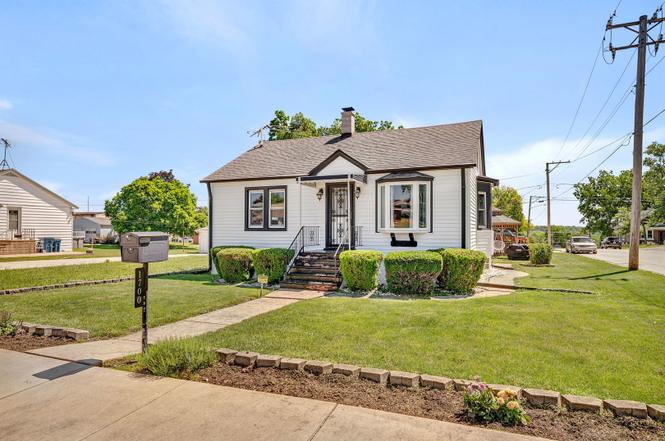
1700 Cora St · Crest Hill, IL
Flood risk 1/10 · Minimal
- FEMA flood zone
- X (unshaded)
- Chance of flooding over 30 yrs
- 0.0%
- Est. flood insurance / yr
- $507 – $1,088
Fire risk 3/10 · Minor
- Est. fire insurance / yr
- $804 – $1,492
Heat risk 3/10 · Minor
- Hot days now (above 102°F)
- 7 days/yr
- Hot days in 30 yrs
- 15 days/yr
Wind risk 2/10 · Minimal
- Chance of severe wind over 30 yrs
- 0.0%
Air-quality risk 2/10 · Minimal
- Unhealthy air days now
- 1 days/yr
- Unhealthy air days in 30 yrs
- 2 days/yr
Risk factors via First Street. Map © Google.
Why this score? — see what drove the D grade
The composite is a weighted blend of 9 inputs, each scored 0–100. Each bar is that input's sub-score; the figure is the points it added to the 100-point composite (weight × sub-score).
- Cash flow +14.5/30.0
- ARV discount +7.5/15.0
- DSCR +4.4/10.0
- 1% rule +4.2/10.0
- Schools +3.4/10.0
- Livability +3.2/5.0
- Rent growth +2.5/5.0
- Condition / age +2.5/5.0
- Appreciation +0.0/10.0
$260,000
🖨 Deal sheet 📄 Offer letter ✓ Due diligence
Listing remarks MLS
Move-in ready ranch with full basement. Home is immaculate, freshly painted throughout & original hardwood floors have just been refinished beautifully. Large living room has two bay windows and arches that lead to spacious eat-in kitchen with plenty of updated cabinets, newer appliances, granite counter tops and a beamed coffered ceiling. Small bonus rm leads to yard and basement which has a laundry area, shower and toilet that could be finished into a full bathroom. Back yard has a screened 11x11 Gazebo and a fence has been added in the last year. 2 car garage 9-10 years old, with newer concrete drive. 4 year old whole house Generac Generator and a 2nd back-up sump pump. Other updates include: Newer vinyl windows and exterior doors thru-out, roof approx. 6 years old, furnace and AC 7-9 years. Chimney re-bricked in last year. This is a great home. Being sold As-Is
Key facts
- Large eat-in kitchen
- Full basement
- Abundant cabinetry
Tags
Property features AI
Finance
- Other: Property not currently leased; Built before 1978
- HOA & community: No master association required
Exterior
- Parking: Detached garage (garage owned) with garage door opener; Concrete driveway; 2 garage/total parking spaces
- Utilities: Public water; Public sewer; Electric service with circuit breakers
- Home design: Detached single-family ranch; One-story; Fee simple ownership
- Construction: Built approximately 81–90 years ago; Vinyl siding; Asphalt roof; Concrete perimeter foundation
- Exterior features: Corner lot; Wood fencing; Sidewalks and street lights in neighborhood; Paved streets
Interior
- Kitchen: Range; Microwave; Refrigerator; Disposal; Eating area / table space
- Bedrooms: Main level master bedroom (hardwood flooring); Main level second bedroom (11 x 9, hardwood); Additional labeled bedrooms/rooms (listed as Bedroom 3 and Bedroom 4)
- Flooring: Hardwood in main living areas and bedrooms; Vinyl in kitchen and bonus room
- Bathrooms: 1 full bathroom
- Heating & cooling: Natural gas forced air heating; Central air conditioning
- Interior features: 5 total rooms; Dormer attic; Unfinished full basement with storage space; Some photos virtually staged; CO detectors; Ceiling fans; Sump pump with backup; Generator
- Laundry & utility: In-unit laundry (washer and dryer); Basement laundry room (6 x 6)
Neighborhood map
What this means for you Summary
Snapshot
- This is a 2-bed/1.0-bath other listed at $260k.
Deal economics
- At list price, monthly cash flow is $56 ($675/yr) — positive.
- The deal already cash-flows at list — no discount required.
- To meet the 1% rule (rent ≥ 1% of price), the offer needs to be $239k (8.0% below list).
- Recommended offer: $239k (8.0% below list) — sets the bar for 1% rule.
- Cap rate 6.6% vs local median 5.3% in Crest Hill — meaningfully above typical; check what's discounted (condition, days-on-market, listing class) to confirm the premium yield is real.
Location & tenants
- Location reads 63/100 on livability (#792 in IL) — a middle-class / working-renter tenant base. Strengths: cost of living A+, housing A+, crime A-; Watch: amenities F, commute F, health & safety F.
- Lockport Twp Hsd 205 (suburban): math 35% / reading 38% proficiency, ranked #153 of 620 in IL (top 25%) — families likely to look elsewhere, expect single-tenant / working-renter base with shorter leases.
- Zoned schools: Lockport Township High Sch East (math 35% / reading 38%, grade F, #117 of 693 statewide, top 17%, 3,872 students, 0% FRL).
- Market conditions: 35 active listings in the ZIP; 3 comparable units currently listed for rent nearby; rentals leasing fast (median 1d on market — plan ~1-2 weeks tenant-placement turnaround); 2,028 units permitted in Will County in 2024 (530 in 5+ unit buildings).
Forward outlook
- Local home prices are declining (-3.0%/yr); year-one equity from $2k of loan paydown is wiped out by about $8k of value loss. Plan a longer hold.
- Will County population projected to shrink 4% by 2050 — rents likely to lag national; underwrite the cash flow, not the appreciation.
Negotiation context
- Only 5 days on market — expect competitive offers; lowballing is unlikely to land.
- 5 sale attempts since 5y ago with the ask held roughly flat each time — persistent listings suggest the price (not the market) is what's stuck; bring a comps-based counter.
- Current owner paid $225k; 16% above their basis — modest negotiation headroom, anchor on the comps not their cost.
Risks & watch-outs
- Watch-outs: built in 1943 — expect roof / HVAC / electrical / plumbing capex.
Questions for the listing agent
- Built in 1943 — when were the roof, HVAC, electrical panel, plumbing, and water heater last replaced?
- Is there a deadline driving the sale (1031 exchange, divorce, estate, relocation)? That informs how much negotiation room exists.
- Schools are F-rated, which usually means shorter tenancies and higher turnover. Who's the typical renter profile here, and what's been the actual vacancy rate?
- The area grade is low — what's the realistic commute time and amenity access for the typical tenant pool here? Any planned neighborhood developments (good or bad) we should know about?
- What's the average days-on-market for RENTAL listings here right now (not sales)? A rising rental-DOM trend means longer vacancies and softer asking-rent achievability than the comps imply.
- What's the recent tenant-quality profile in this submarket — average credit score on applications, eviction rate, late-payment / NSF rate, and stable-employment percentage? A property-management company in the area should have these aggregated.
- How much new for-sale + rental construction is in the pipeline within 1–3 miles? Heavy new supply typically softens prices + rents 12–24 months out; constrained supply supports both.
Investment metrics
- 1% rule
- 0.92% ✗
- Cap rate
- 6.55%
- Cash-on-cash
- 0.93%
- DSCR
- 1.04
- GRM
- 9.1
CMA / ARV
No comps found within radius.
Projected returns pro-forma
-3.0% appreciation · 3.0% rent growth · sell at horizon
- IRR
- -14.8%
- Equity multiple
- 0.47×
- Total profit
- $-38,489
- Equity at exit
- $38,767
- IRR
- -6.1%
- Equity multiple
- 0.61×
- Total profit
- $-28,664
- Equity at exit
- $22,480
Cash invested: $72,800 (down + closing). Projections, not guarantees.
Landlord ↔ Tenant lean methodology
- Overall (STATE)
- 43 Moderately Tenant-Leaning
- State Illinois
- 43 Moderately Tenant-Leaning · D+7
- County
- — inherits STATE
- City
- — inherits STATE
ZIP-level market 60403
- Active inventory
- 35
- Price-to-rent
- 9.1×
Monthly cashflow live
- Estimated rent
- $2,392 medium interval (Pro) →
- Mortgage (P&I)
- −$1,363
- Tax from tax record
- −$361 /mo · $4,335/yr
- Insurance
- −$108
- HOA
- −$0
- Vacancy / Maint / Mgmt
- −$502
- Net cashflow
- $56
Break-even live
UW: 25.0% down · 7.5% · 30yr · 1.5% tax · 5.0% vac · 8.0% maint · 8.0% mgmt
Financing live
Cash to close
- Down payment
- $65,000
- Closing costs
- $7,800
- Reserves months
- —
- Total cash needed
- —
Loan-product check · same deal, 3 products live
Conventional
25% down · 7.5% · 30yr
- Down + closing
- —
- Monthly P&I
- —
- Monthly cashflow
- —
- DSCR
- —
- Eligible?
- —
Personal DTI + credit; lowest rate.
DSCR
20% down · 8.5% · 30yr
- Down + closing
- —
- Monthly P&I
- —
- Monthly cashflow
- —
- DSCR
- —
- Eligible?
- —
No personal income docs; deal must DSCR.
Hard money
10% down · 12.0% · 12mo
- Down + closing
- —
- Monthly P&I
- —
- Monthly cashflow
- —
- DSCR
- —
- Eligible?
- —
Short-term bridge; refi at stabilization.
Rent comps 3 comps
| Address | Beds | Baths | Sqft | Rent | $/sqft | DOM | Units | Dist |
|---|---|---|---|---|---|---|---|---|
| 1805 Kelly Ave Crest Hill, IL | 3.0 | 1.5 | 1188 | $2,450 | $2.06 | 1d | 1 | 0.54mi |
| 1615 Arbor Ln Crest Hill, IL | 2.0 | 1.0–1.5 | 624 | $1,899 | $3.04 | 1d | 57 | 1.17mi |
| 1304 Norley Ave Joliet, IL | 3.0 | 3.0 | 1500 | $2,650 | $1.77 | 21d | 1 | 1.26mi |
Listing history 6 events
-
2026-06-18days on market $260,000 Active 5 DOM
-
2026-06-17days on market $260,000 Active 4 DOM
-
2026-06-16days on market $260,000 Active 3 DOM
-
2026-06-15remarks 699-char remark
-
2026-06-15status $260,000 Active 2 DOM
-
2026-06-13$260,000 Active (Private) 2 DOM
ⓘ Source: listings_history table (triggers on properties + properties_extension) + one-shot
backfill from property_details.listing_events for pre-trigger history.
Tax reassessment forecast IL · Partial reset (capped growth)
- Current annual tax
- $4,335 · $361/mo
- Projected year-2 tax
- $5,119 · $427/mo
- Expected delta
- +$783/yr (+$65/mo · 18.1%)
ⓘ Screening estimate from a state-policy table — verify with the county assessor before closing.
Climate risk First Street
- Flood 1/10 Low FEMA zone X (unshaded) · 0% chance over 30 yrs
- Wildfire 3/10 Moderate
- Heat 3/10 Moderate 7 d/yr ≥102°F today · 15 d/yr by 30 yrs out
- Wind 2/10 Low 0% chance of damaging wind over 30 yrs
- Air quality 2/10 Low 1 unhealthy d/yr today · 2 by 30 yrs out
Nearby sold comps map
Loading sold comps map…
Walkable amenities ~0.75 mi
Loading nearby amenities…
Taxation est. · year 1
- Rental income
- $28,699
- − Mortgage interest
- −$14,564
- − Property taxes
- −$4,335
- − Insurance
- −$1,300
- − Repairs & maintenance
- −$2,296
- − Management
- −$2,296
- − Depreciation
- −$7,564
- Taxable loss
- −$3,656
- Est. tax savings @ 24.0%
- +$877
- After-tax cash flow
- $1,553/yr
For passive investors: Depreciation is non-cash, so a rental often shows a tax loss while cash-flowing — sheltering income. Rental losses are passive: they offset passive income freely, and up to $25,000/yr can offset ordinary (W-2) income if you actively participate and your MAGI is under $100k (phasing out to $0 by $150k); unused losses carry forward. On sale, claimed depreciation is recaptured at up to 25%, and gains may owe capital-gains tax (a 1031 exchange can defer both). Figures are a year-1 estimate at your 24.0% rate — not tax advice; consult a CPA.
Schools (NCES district)
- District
- Lockport Twp Hsd 205
- NCES district ID
- 1723350
- Math proficiency
- 35% ▼ -5.00%
- Reading proficiency
- 38% ▼ -4.00%
- Median HH income
- $69,994
- Composite
- 33.5/100
- National rank
- #5440
- State rank
- #153 of 620 in IL
Livability — Crest Hill
- Score
- 63/100
- State rank
- #792
- US rank
- #15733
Category grades
Schools grade is shown separately in the Schools card above.
Census & demographics
- Census place
- Crest Hill, IL
- City population
- 17,226
- Population (ZIP)
- 17,226
Population outlook (Will County) Hauer SSP2
- Today (2025)
- 705,368 people
- By 2030
- 708,154 · +0.4%
- By 2040
- 702,692 · -0.4%
- By 2050
- 680,249 · -3.6%
- By 2075
- 611,990 · -13.2%
- By 2100
- 516,215 · -26.8%
Race, ethnicity, and origin ACS 2023
- Neighborhood character
- Diverse neighborhood (Simpson 0.64)
- Race & ethnicity
- White 52% Hispanic / Latino 26% Black 14% Two or more races 13% Asian 3%
- Hispanic origin (detail)
- Mexican 22%
- Common ancestry
- Romanian 7% Lithuanian 2% Subsaharan African 1%
- Foreign-born
- 12% · Canada, South Korea
- Languages at home
- 76% English-only · Spanish 16% Russian/Polish/Slavic 2% Tagalog/Filipino 2%
Political lean MEDSL · Will
- 2024 margin
- Toss-up / Even · D 50.1% · R 48.5% · Other 1.4%
- 2008→2024 swing
- -11.6pp toward R · 2008: 13.2pp · 2024: 1.6pp
- All cycles
- 2024: D+1.6 2020: D+8.3 2016: D+5.7 2012: D+3.7 2008: D+13.2
Not yet ingested
- Civics
- —
Market trends
- HPI YoY
- ▼ -136.15%
- Current HPI
- 205.702
- Rent YoY
- —
- Metro
- —
- State GDP YoY
- ▲ 1.59%
- F500 in state
- 60
Industry mix (Fortune 500 HQ in IL)
| Industry | F500 HQs | Revenue |
|---|---|---|
| Insurance | 4 | $201B |
|
||
| Consumer Goods | 4 | $87B |
|
||
| Industrial Machinery | 3 | $64B |
|
||
| Healthcare | 2 | $55B |
|
||
| Retail / Pharmacy | 1 | $148B |
|
||
| Agriculture / Food | 1 | $86B |
|
||
Price history
+36.9% since first listed16 events — show timeline
- 2026-06-13 Listed $260,000 MRED as Distributed by MLS Grid
- 2026-06-11 Coming Soon $260,000 MRED as Distributed by MLS Grid
- 2023-10-23 Sold (Public Records) $225,000 Public Records
- 2023-10-10 Sold (MLS) $225,000 MRED as Distributed by MLS Grid
- 2023-09-16 Contingent — MRED as Distributed by MLS Grid
- 2023-09-06 Price Changed $225,000 MRED as Distributed by MLS Grid
- 2023-08-10 Relisted — MRED as Distributed by MLS Grid
- 2023-07-05 Contingent — MRED as Distributed by MLS Grid
- 2023-07-02 Listed $230,000 MRED as Distributed by MLS Grid
- 2021-08-31 Sold (Public Records) $192,000 Public Records
- 2021-08-24 Sold (MLS) $192,000 MRED as Distributed by MLS Grid
- 2021-07-17 Pending — MRED as Distributed by MLS Grid
- 2021-07-13 Listed $189,900 MRED as Distributed by MLS Grid
- 2021-07-03 Pending — MRED as Distributed by MLS Grid
- 2021-07-02 Listing Removed — MRED as Distributed by MLS Grid
- 2021-06-21 Listed — MRED as Distributed by MLS Grid
Property tax history
+4.0%/yrLatest (2024): $4,335 · +6.4% YoY. Source: county tax records.
Cash-flow waterfall
monthlySold comps — $/sqft
last 12 mo · ≤1 miLoading sold comps…