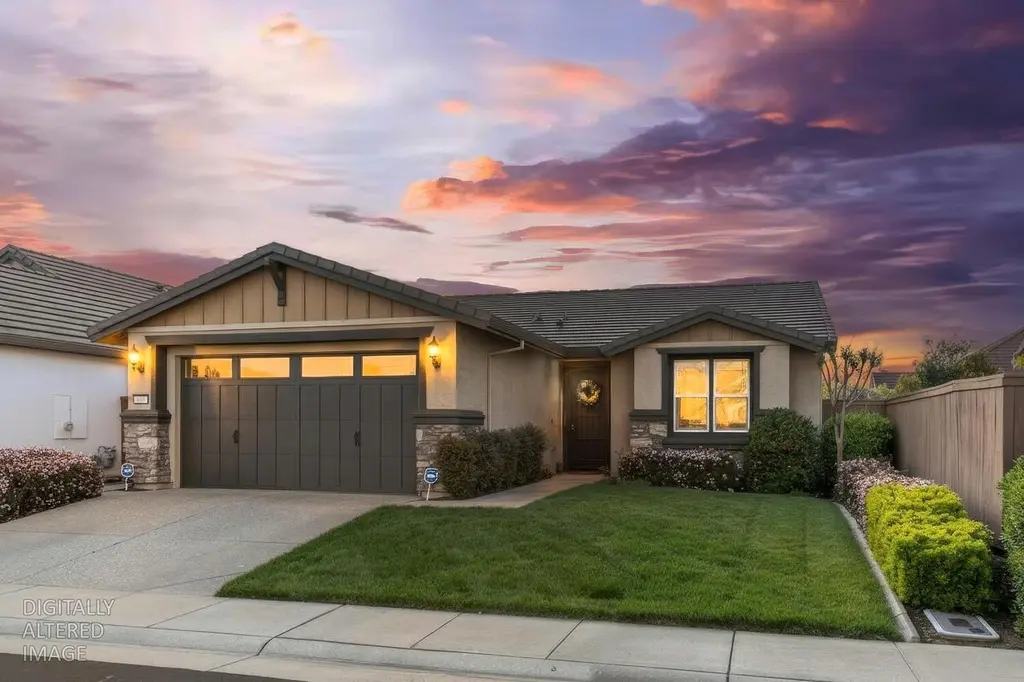
9930 Hatherton Way · Elk Grove, CA
Flood risk 1/10 · Minimal
- FEMA flood zone
- X (unshaded)
- Chance of flooding over 30 yrs
- 0.0%
- Est. flood insurance / yr
- $507 – $1,088
Fire risk 4/10 · Minor
- Est. fire insurance / yr
- $659 – $1,223
Heat risk 7/10 · Major
- Hot days now (above 102°F)
- 7 days/yr
- Hot days in 30 yrs
- 14 days/yr
Wind risk 1/10 · Minimal
- Chance of severe wind over 30 yrs
- —
Air-quality risk 10/10 · Severe
- Unhealthy air days now
- 25 days/yr
- Unhealthy air days in 30 yrs
- 27 days/yr
Risk factors via First Street. Map © Google.
Why this score? — see what drove the D- grade
The composite is a weighted blend of 9 inputs, each scored 0–100. Each bar is that input's sub-score; the figure is the points it added to the 100-point composite (weight × sub-score).
- ARV discount +10.9/15.0
- Appreciation +10.0/10.0
- Cash flow +4.2/30.0
- Schools +4.1/10.0
- Rent growth +3.6/5.0
- Livability +3.6/5.0
- Condition / age +2.5/5.0
- 1% rule +0.5/10.0
- DSCR +0.0/10.0
$559,900
🖨 Deal sheet 📄 Offer letter ✓ Due diligence
Listing remarks
Welcome to this beautifully maintained home in the highly sought-after Del Webb 55+ active adult community, where resort-style living meets everyday comfort. From the moment you arrive, the exceptional curb appeal sets the tone. Step through the oversized entry door and you're greeted by stunning tile flooring and plantation shutters, creating a bright and elegant atmosphere. Two well-appointed guest bedrooms are thoughtfully positioned near the entry, offering flexibility for visitors or a home office. The home opens into a spacious great room concept, seamlessly blending the kitchen, dining, and living areasperfect for entertaining or relaxed living. The kitchen features granite counterto
Key facts
- Oversized entry door
- Plantation shutters
- Granite countertops
Tags
Neighborhood map
What this means for you Summary
Snapshot
- This is a 3-bed/2.0-bath single-family listed at $560k.
Deal economics
- At list price, monthly cash flow is $-2k ($-18k/yr) — negative.
- To cash-flow at today's rent, offer at most $293k (47.6% below list).
- To meet the 1% rule (rent ≥ 1% of price), the offer needs to be $307k (45.1% below list).
- Recommended offer: $293k (47.6% below list) — sets the bar for cash-flow.
Location & tenants
- Location reads 71/100 on livability (#212 in CA) — a middle-class / working-renter tenant base. Strengths: employment A+, housing A+, crime B+; Watch: commute F, cost of living F.
- Elk Grove Unified (suburban): math 40% / reading 51% proficiency, ranked #165 of 517 in CA (top 32%) — families likely to look elsewhere, expect single-tenant / working-renter base with shorter leases.
- Market conditions: Rents rising fast (+4.5%/yr); 295 active listings in the ZIP; 40 comparable units currently listed for rent nearby; rentals at typical pace (median 22d on market — plan ~3-4 weeks tenant-placement turnaround); high-income renter base; 6,825 units permitted in Sacramento County in 2024 (1,752 in 5+ unit buildings).
Forward outlook
- In year one you build about $60k of equity ($4k loan paydown + $56k appreciation (10.0% local appreciation)).
- Sacramento County population projected at +17% by 2050 — long-run rental-demand tailwind backs the buy-and-hold thesis.
- By year 2, paydown + projected appreciation supports a ~$96k cash-out refi (75% LTV) — recoverable capital for the next deal without selling this one.
Negotiation context
- It's been on market 64 days — a 6% lower offer ($526k) is reasonable based on typical stale-listing flexibility.
Risks & watch-outs
- Climate carrying-cost: extreme-heat days projected 7→14/yr by 2055 (HVAC capex compounding) — expect insurance premiums to compound above CPI over the hold.
Questions for the listing agent
- What do current leases actually rent for vs. the listed asking? Can we see a recent rent roll and the last 12 months of T-12 income?
- It's been on market 64 days. Have you received any prior offers? Is the seller open to a 48% concession, seller financing, or rate buy-down credit?
- What does the HOA fee cover, when was the last increase, and are there any pending special assessments or reserve-fund shortfalls?
- Why hasn't it sold? Are there any deal-killer items the seller is aware of (foundation, flood, title, zoning, code violations)?
- Is there a deadline driving the sale (1031 exchange, divorce, estate, relocation)? That informs how much negotiation room exists.
- Schools are B-rated — typically a magnet for longer-tenancy family renters. What's the average tenant stay here, and is there a school-zone premium baked into asking?
- The area grade is low — what's the realistic commute time and amenity access for the typical tenant pool here? Any planned neighborhood developments (good or bad) we should know about?
- What's the average days-on-market for RENTAL listings here right now (not sales)? A rising rental-DOM trend means longer vacancies and softer asking-rent achievability than the comps imply.
- What's the recent tenant-quality profile in this submarket — average credit score on applications, eviction rate, late-payment / NSF rate, and stable-employment percentage? A property-management company in the area should have these aggregated.
- How much new for-sale + rental construction is in the pipeline within 1–3 miles? Heavy new supply typically softens prices + rents 12–24 months out; constrained supply supports both.
Investment metrics
- 1% rule
- 0.55% ✗
- Cap rate
- 3.06%
- Cash-on-cash
- -11.56%
- DSCR
- 0.49
- GRM
- 15.2
CMA / ARV
- ARV (median comp)
- $605,991
- List price
- $559,900
- Delta
- -7.61%
- Verdict
- FAIR
- Comps
- 20 within 1.0 mi
Show comp detail 12 sales within ~0.75 mi
| Address | Dist | Beds/Ba | Sqft | Sold | Price | $/sf | Match |
|---|---|---|---|---|---|---|---|
| 9930 Hatherton Way | 0.00mi | 3/2.0 | 1,542 (0%) | 0mo | $548,500 | $356 | 100 |
| 8221 Peak Forest Way | 0.07mi | 3/2.0 | 1,569 (+2%) | 2mo | $600,000 | $382 | 92 |
| 7908 Dearne Way | 0.11mi | 3/2.0 | 1,569 (+2%) | 2mo | $555,000 | $354 | 90 |
| 9895 Sheffield Way | 0.30mi | 3/2.0 | 1,569 (+2%) | 4mo | $550,000 | $351 | 80 |
| 7604 Fey Way | 0.41mi | 3/2.0 | 1,493 (-3%) | 7mo | $635,000 | $425 | 69 |
| 9932 Westminster Way | 0.24mi | 2/2.0 (-1) | 1,372 (-11%) | 1mo | $537,500 | $392 | 64 |
| 7660 Wayans Way | 0.42mi | 4/2.0 (+1) | 1,493 (-3%) | 7mo | $570,000 | $382 | 64 |
| 7713 Peak Forest Way | 0.25mi | 2/2.0 (-1) | 1,371 (-11%) | 3mo | $535,000 | $390 | 62 |
| 9975 Tarzo Way | 0.61mi | 3/2.0 | 1,482 (-4%) | 4mo | $580,000 | $391 | 62 |
| 9882 Sheffield Way | 0.34mi | 2/2.0 (-1) | 1,371 (-11%) | 2mo | $525,000 | $383 | 59 |
| 9995 Tarzo Way | 0.66mi | 3/2.0 | 1,639 (+6%) | 1mo | $605,000 | $369 | 58 |
| 7448 Abbey Cir | 0.38mi | 2/2.0 (-1) | 1,343 (-13%) | 3mo | $498,000 | $371 | 53 |
Match score weights: distance 35% · size 25% · config 20% · recency 20%. Top-matched comps best support the ARV.
Projected returns pro-forma
10.0% appreciation · 4.54% rent growth · sell at horizon
- IRR
- 16.5%
- Equity multiple
- 2.36×
- Total profit
- $213,711
- Equity at exit
- $504,402
- IRR
- 16.1%
- Equity multiple
- 5.56×
- Total profit
- $715,575
- Equity at exit
- $1,087,763
Cash invested: $156,772 (down + closing). Projections, not guarantees.
Landlord ↔ Tenant lean methodology
- Overall (STATE)
- 18 Strongly Tenant-Friendly
- State California
- 18 Strongly Tenant-Friendly · D+13
- County
- — inherits STATE
- City
- — inherits STATE
ZIP-level market 95757
- Home prices YoY
- 13.5%
- Rents YoY
- 4.5%
- Active inventory
- 295
- Price-to-rent
- 15.2×
Monthly cashflow live
- Estimated rent
- $3,073 high interval (Pro) →
- Mortgage (P&I)
- −$2,936
- Tax from tax record
- −$554 /mo · $6,649/yr
- Insurance
- −$233
- HOA
- −$214
- Vacancy / Maint / Mgmt
- −$645
- Net cashflow
- $-1,510
Break-even live
UW: 25.0% down · 7.5% · 30yr · 1.5% tax · 5.0% vac · 8.0% maint · 8.0% mgmt
Financing live
Cash to close
- Down payment
- $139,975
- Closing costs
- $16,797
- Reserves months
- —
- Total cash needed
- —
Loan-product check · same deal, 3 products live
Conventional
25% down · 7.5% · 30yr
- Down + closing
- —
- Monthly P&I
- —
- Monthly cashflow
- —
- DSCR
- —
- Eligible?
- —
Personal DTI + credit; lowest rate.
DSCR
20% down · 8.5% · 30yr
- Down + closing
- —
- Monthly P&I
- —
- Monthly cashflow
- —
- DSCR
- —
- Eligible?
- —
No personal income docs; deal must DSCR.
Hard money
10% down · 12.0% · 12mo
- Down + closing
- —
- Monthly P&I
- —
- Monthly cashflow
- —
- DSCR
- —
- Eligible?
- —
Short-term bridge; refi at stabilization.
Rent comps 40 comps
| Address | Beds | Baths | Sqft | Rent | $/sqft | DOM | Units | Dist |
|---|---|---|---|---|---|---|---|---|
| 9932 Westminster Way Elk Grove, CA | 2.0 | 2.0 | 1376 | $2,695 | $1.96 | 23d | 1 | 0.25mi |
| 7540 Abbey Cir Elk Grove, CA | 2.0 | 2.0 | 1257 | $2,700 | $2.15 | 4d | 1 | 0.33mi |
| 7405 Rothschild Ct Elk Grove, CA | 3.0 | 2.0 | 1859 | $2,650 | $1.43 | 1d | 1 | 0.42mi |
| 8008 Poppy Ridge Rd Elk Grove, CA | 4.0 | 3.0 | 2073 | $3,375 | $1.63 | 23d | 1 | 0.45mi |
| 9867 Tarzo Way Elk Grove, CA | 3.0 | 3.0 | 1905 | $2,700 | $1.42 | 43d | 1 | 0.56mi |
| 8471 Anker Way Elk Grove, CA | 4.0 | 2.5 | 2107 | $3,200 | $1.52 | 23d | 1 | 0.85mi |
| 7706 Brabham Way Elk Grove, CA | 3.0 | 2.0 | 1434 | $2,995 | $2.09 | 43d | 1 | 0.87mi |
| 10110 Elise Way Elk Grove, CA | 3.0 | 2.5 | 1628 | $3,300 | $2.03 | 7d | 1 | 0.89mi |
| 10114 Elise Way Elk Grove, CA | 4.0 | 3.0 | 2214 | $2,995 | $1.35 | 7d | 1 | 0.90mi |
| 8403 Sinesky Way Elk Grove, CA | 3.0 | 2.0 | 1579 | $2,995 | $1.90 | 10d | 1 | 0.93mi |
| 8212 Shannon Oak Ln Elk Grove, CA | 3.0 | 2.5 | 1351 | $2,600 | $1.92 | 43d | 1 | 0.93mi |
| 10365 Bayson Way Elk Grove, CA | 4.0 | 3.0 | 2018 | $3,300 | $1.64 | 20d | 1 | 0.94mi |
| 10365 Bayson Way Elk Grove, CA | 4.0 | 3.0 | 2018 | $3,300 | $1.64 | 21d | 1 | 0.94mi |
| 9567 S Coast Ln Elk Grove, CA | 2.0 | 2.5 | 1265 | $2,300 | $1.82 | 3d | 1 | 0.97mi |
| 7216 Tavira Ct Elk Grove, CA | 3.0 | 2.0 | 1513 | $2,600 | $1.72 | 43d | 1 | 0.99mi |
| 9534 Sunlight Ln Elk Grove, CA | 3.0 | 2.0 | 1427 | $2,650 | $1.86 | 17d | 1 | 1.03mi |
| 10371 Bruceville Rd Elk Grove, CA | 2.0 | 3.0 | 1152 | $2,700 | $2.34 | 17d | 1 | 1.08mi |
| 10371 Bruceville Rd Elk Grove, CA | 2.0 | 3.0 | 1152 | $2,700 | $2.34 | 43d | 1 | 1.08mi |
| 9428 Plainoak Way Elk Grove, CA | 3.0 | 2.0 | 1232 | $2,745 | $2.23 | 7d | 1 | 1.29mi |
| 8357 Eleodoro Way Elk Grove, CA | 3.0 | 2.5 | 1730 | $3,245 | $1.88 | 2d | 1 | 1.30mi |
| 8376 Solfrid Way Elk Grove, CA | 4.0 | 3.0 | 2070 | $3,200 | $1.55 | 17d | 1 | 1.30mi |
| 10516 Paseo Garcia Ct Elk Grove, CA | 3.0 | 2.5 | 1492 | $3,399 | $2.28 | 4d | 1 | 1.32mi |
| 10508 Paseo Garcia Ct Elk Grove, CA | 3.0 | 2.5 | 1492 | $3,389 | $2.27 | 20d | 1 | 1.33mi |
| 10573 Vina Ct Elk Grove, CA | 3.0 | 2.5 | 1449 | $3,299 | $2.28 | 43d | 1 | 1.33mi |
| 10571 Vina Ct Elk Grove, CA | 3.0 | 2.5 | 1322 | $3,149 | $2.38 | 10d | 1 | 1.33mi |
| 10565 Vina Ct Elk Grove, CA | 3.0 | 2.5 | 1322 | $3,149 | $2.38 | 10d | 1 | 1.33mi |
| 10563 Vina Ct Elk Grove, CA | 3.0 | 2.5 | 1449 | $3,299 | $2.28 | 43d | 1 | 1.33mi |
| 7104 Saltgrass Way Elk Grove, CA | 3.0 | 2.0 | 1818 | $2,750 | $1.51 | 43d | 1 | 1.34mi |
| 10564 Vina Ct Elk Grove, CA | 3.0 | 2.5 | 1322 | $3,149 | $2.38 | 23d | 1 | 1.34mi |
| 8120 Crystal Walk Cir Elk Grove, CA | 2.0 | 2.0 | 1163 | $2,195 | $1.89 | 43d | 1 | 1.35mi |
| 10583 Amigos Ct Elk Grove, CA | 3.0 | 2.5 | 1322 | $3,149 | $2.38 | 23d | 1 | 1.35mi |
| 10439 Barrena Loop Elk Grove, CA | 2.0–3.0 | 2.5 | 1252 | $3,149 | $2.52 | 1d | 1 | 1.35mi |
| 8357 Luan Way Elk Grove, CA | 3.0 | 2.0 | 1967 | $2,895 | $1.47 | 19d | 1 | 1.35mi |
| 8144 Crystal Walk Cir Elk Grove, CA | 4.0 | 2.5 | 1727 | $2,599 | $1.50 | 12d | 1 | 1.35mi |
| 10577 Amigos Ct Elk Grove, CA | 3.0 | 2.5 | 1322 | $3,149 | $2.38 | 43d | 1 | 1.36mi |
| 9836 Imperia Ct Elk Grove, CA | 4.0 | 2.0 | 1639 | $2,900 | $1.77 | 7d | 1 | 1.38mi |
| 10595 Gato Ct Elk Grove, CA | 3.0 | 2.5 | 1322 | $3,149 | $2.38 | 43d | 1 | 1.38mi |
| 10589 Gato Ct Elk Grove, CA | 3.0 | 2.5 | 1322 | $3,119 | $2.36 | 23d | 1 | 1.38mi |
| 9732 Marianna Way Elk Grove, CA | 4.0 | 2.5 | 2090 | $3,300 | $1.58 | 43d | 1 | 1.39mi |
| 5819 Witt Ct Elk Grove, CA | 4.0 | 2.5 | 2090 | $2,900 | $1.39 | 44d | 1 | 1.44mi |
HOA detail
- Monthly dues
- $214 · $2,568/yr
Tax reassessment forecast CA · Resets to sale price
- Current annual tax
- $6,649 · $554/mo
- Projected year-2 tax
- $6,649 · $554/mo
- Expected delta
- $0/yr ($0/mo · 0.0%)
ⓘ Screening estimate from a state-policy table — verify with the county assessor before closing.
Climate risk First Street
- Flood 1/10 Low FEMA zone X (unshaded) · 0% chance over 30 yrs
- Wildfire 4/10 Moderate
- Heat 7/10 Severe 7 d/yr ≥102°F today · 14 d/yr by 30 yrs out
- Wind 1/10 Low
- Air quality 10/10 Extreme 25 unhealthy d/yr today · 27 by 30 yrs out
Nearby sold comps map
Loading sold comps map…
Walkable amenities ~0.75 mi
Loading nearby amenities…
Taxation est. · year 1
- Rental income
- $36,879
- − Mortgage interest
- −$31,363
- − Property taxes
- −$6,649
- − Insurance
- −$2,800
- − Repairs & maintenance
- −$2,950
- − Management
- −$2,950
- − HOA
- −$2,568
- − Depreciation
- −$16,288
- Taxable loss
- −$28,688
- Est. tax savings @ 24.0%
- +$6,885
- After-tax cash flow
- $-11,230/yr
For passive investors: Depreciation is non-cash, so a rental often shows a tax loss while cash-flowing — sheltering income. Rental losses are passive: they offset passive income freely, and up to $25,000/yr can offset ordinary (W-2) income if you actively participate and your MAGI is under $100k (phasing out to $0 by $150k); unused losses carry forward. On sale, claimed depreciation is recaptured at up to 25%, and gains may owe capital-gains tax (a 1031 exchange can defer both). Figures are a year-1 estimate at your 24.0% rate — not tax advice; consult a CPA.
Schools (NCES district)
- District
- Elk Grove Unified
- NCES district ID
- 0612330
- Math proficiency
- 40% ▼ -5.00%
- Reading proficiency
- 51% ▼ -5.00%
- Median HH income
- $67,860
- Composite
- 40.72/100
- National rank
- #3658
- State rank
- #165 of 517 in CA
Livability — Elk Grove
- Score
- 71/100
- State rank
- #212
- US rank
- #6681
Category grades
Schools grade is shown separately in the Schools card above.
Census & demographics
- Census place
- Elk Grove, CA
- County
- Sacramento County · 1,539,646 people
- City population
- 190,119
- Metro
- Sacramento-Roseville-Folsom, CA
- Population (ZIP)
- 56,764
- Household income
- $138,198
- Rent vs Own
- Severe rent burden
- 1121.0
Population outlook (Sacramento County) Hauer SSP2
- Today (2025)
- 1,660,763 people
- By 2030
- 1,732,990 · +4.3%
- By 2040
- 1,855,755 · +11.7%
- By 2050
- 1,941,335 · +16.9%
- By 2075
- 2,046,162 · +23.2%
- By 2100
- 1,961,444 · +18.1%
Race, ethnicity, and origin ACS 2023
- Neighborhood character
- Highly diverse neighborhood (Simpson 0.75)
- Race & ethnicity
- Asian 40% White 21% Hispanic / Latino 18% Two or more races 14% Black 11% Pacific Islander 1%
- Hispanic origin (detail)
- Mexican 14%
- Common ancestry
- Russian 1% Italian 1% Portuguese 1%
- Foreign-born
- 28% · China, Canada, Vietnam
- Languages at home
- 62% English-only · Spanish 8% Other Indo-European 7% Chinese 7%
Political lean MEDSL · Sacramento
- 2024 margin
- D (+19.7) · D 58.1% · R 38.4% · Other 3.5%
- 2008→2024 swing
- +0.7pp no change · 2008: 19.0pp · 2024: 19.7pp
- All cycles
- 2024: D+19.7 2020: D+25.3 2016: D+23.7 2012: D+16.3 2008: D+19.0
Not yet ingested
- Civics
- —
Market trends
- HPI YoY
- ▲ 39.15%
- Current HPI
- 328.5885
- Rent YoY
- ▲ 4.54%
- Metro
- Sacramento-Roseville-Folsom, CA
- State GDP YoY
- ▲ 3.21%
- F500 in state
- 116
Industry mix (Fortune 500 HQ in CA)
| Industry | F500 HQs | Revenue |
|---|---|---|
| Technology | 27 | $1,492B |
|
||
| Financial Services | 3 | $174B |
|
||
| Retail | 3 | $44B |
|
||
| Insurance | 3 | $26B |
|
||
| Media / Entertainment | 2 | $115B |
|
||
| Pharmaceuticals / Biotech | 2 | $62B |
|
||
Property tax history
+6.9%/yrLatest (2025): $6,649 · +2.2% YoY. Source: county tax records.
Cash-flow waterfall
monthlySold comps — $/sqft
last 12 mo · ≤1 miLoading sold comps…