 Duplex
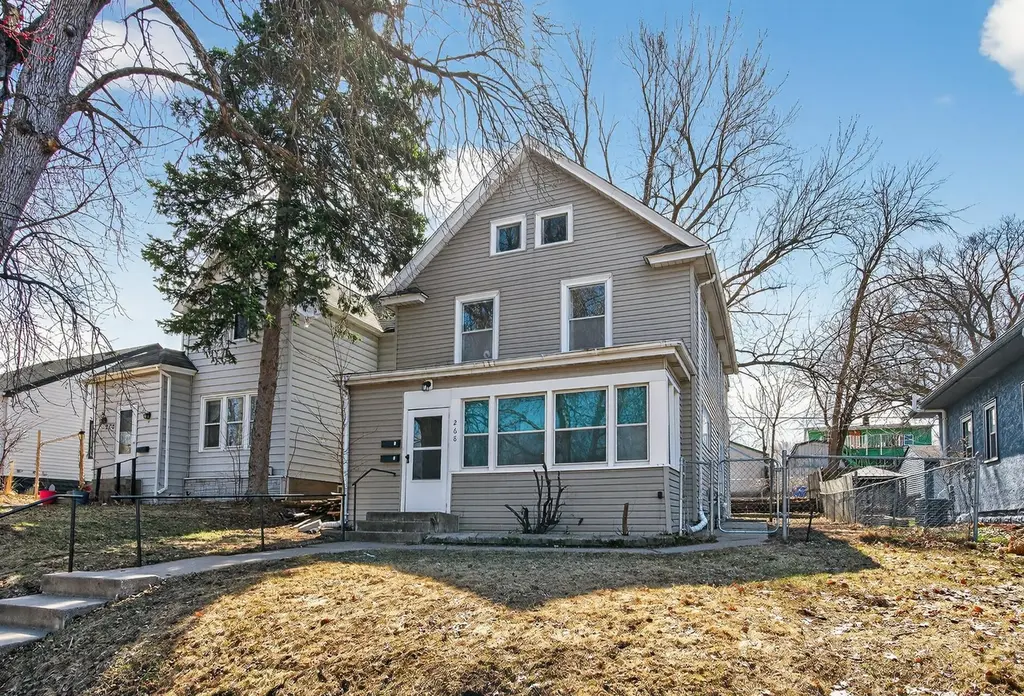
268 Winona St E · St. Paul, MN
Flood risk 1/10 · Minimal
- FEMA flood zone
- X (unshaded)
- Chance of flooding over 30 yrs
- 0.0%
- Est. flood insurance / yr
- $473 – $860
Fire risk 1/10 · Minimal
- Est. fire insurance / yr
- $888 – $1,650
Heat risk 2/10 · Minimal
- Hot days now (above 100°F)
- 7 days/yr
- Hot days in 30 yrs
- 14 days/yr
Wind risk 2/10 · Minimal
- Chance of severe wind over 30 yrs
- —
Air-quality risk 2/10 · Minimal
- Unhealthy air days now
- 1 days/yr
- Unhealthy air days in 30 yrs
- 1 days/yr
Risk factors via First Street. Map © Google.
Why this score? — see what drove the C+ grade
The composite is a weighted blend of 9 inputs, each scored 0–100. Each bar is that input's sub-score; the figure is the points it added to the 100-point composite (weight × sub-score).
- Cash flow +27.5/30.0
- DSCR +9.6/10.0
- 1% rule +7.6/10.0
- ARV discount +7.5/15.0
- Rent growth +5.0/5.0
- Livability +2.5/5.0
- Condition / age +2.5/5.0
- Schools +2.4/10.0
- Appreciation +0.0/10.0
$259,000
🖨 Deal sheet 📄 Offer letter ✓ Due diligence
Multi-family units
County records classify this as Multi-Family (2-4 Unit). Listing-text estimate: 2 units. confirmed
Listing remarks MLS
Opportunity knocks with this well maintained duplex. Own for less than rent. Your new home has great location and proximity to schools, parks, boys and girls club for kids, retail, restaurants and Downtown. Move in and enjoy.
Key facts
- Nice porch
- Updated electric
- New tile
Tags
Property features AI
Finance
- Other: Total of 2 rental units
- Financial info: Owner pays: fuel, insurance, repairs, sewer, taxes, trash collection, water; Estimated fuel expense: $1,300; Estimated water/sewer expense: $850; Estimated trash expense: $784; Estimated insurance expense: $1,800; Estimated maintenance expense: $500; Gross income: $30,840; Property has a standard rental license; tenants pay electricity
- HOA & community: Association provides coin-op laundry (owned)
Exterior
- Parking: Parking lot; 1-car garage (approx. 18 x 14, 7' door height, 9' door width); 2 parking spaces allocated to each unit
- Utilities: City water connected; City sewer connected; Natural gas
- Home design: Residential income property; Duplex (up and down); Two levels; Entry level split across units
- Construction: Stone foundation; Asphalt pitched roof (age 8 years or less)
- Exterior features: Enclosed porch; Front porch; Rear porch; Metal and vinyl exterior; Chain link fencing; Medium tree coverage on lot; City street frontage; Lot dimensions approximately 40 x 125
Interior
- Kitchen: Range; Refrigerator
- Bedrooms: 3 bedrooms total; Unit 1: 2 bedrooms; Unit 2: 1 bedroom
- Bathrooms: Unit 1: 1 full bathroom; Unit 2: 1 three-quarter bathroom
- Heating & cooling: Forced air heating; Window cooling in one unit
- Interior features: Unfinished basement; Natural woodwork; Porch; Kitchen window
- Laundry & utility: Coin-op laundry (association owned); Laundry located in basement
Neighborhood map
What this means for you Summary
Snapshot
- This is a 2 × 3-bed/2.0-bath units multifamily listed at $259k.
Deal economics
- At list price, monthly cash flow is $763 ($9k/yr) — positive. Per door: $381/mo.
- The deal already cash-flows at list — no discount required.
- Meets the 1% rule at list price ($3k rent vs $259k).
- Recommended offer: $255k (1.5% below list) — sets the bar for market timing.
Location & tenants
- Location reads: area grade C — affects rentability + tenant quality, not the cash-flow math above.
- St. Paul Public School District (urban): math 21% / reading 33% proficiency, ranked #270 of 301 in MN (top 90%) — low school quality limits family demand, transient renter base, plan for 1-2y turnover; 64% free/reduced lunch — lower-income household profile, screen leases tightly.
- Market conditions: Rents rising fast (+10.8%/yr); 64 active listings in the ZIP; 11 comparable units currently listed for rent nearby; rentals leasing fast (median 5d on market — plan ~1-2 weeks tenant-placement turnaround); 1,202 units permitted in Ramsey County in 2024 (880 in 5+ unit buildings).
- At $3,260/mo this rent would consume 52% of the median local household income ($75k/yr) (locally 639% of renters already pay >50% of income on rent) — very limited rent-growth headroom before tenants either downsize or default.
Forward outlook
- Local home prices are declining (-3.0%/yr); year-one equity from $2k of loan paydown is wiped out by about $8k of value loss. Plan a longer hold.
- Ramsey County population projected at +27% by 2050 — long-run rental-demand tailwind backs the buy-and-hold thesis.
- At projected returns (-3.0% appreciation + 8.0% rent growth), your $73k cash investment doubles in ~7 years — after that, you're playing with house money.
Negotiation context
- It's been on market 26 days — a 2% lower offer ($255k) is reasonable based on typical stale-listing flexibility.
- 6 sale attempts since 20y ago with the ask held roughly flat each time — persistent listings suggest the price (not the market) is what's stuck; bring a comps-based counter.
- Current owner paid $190k; 36% above their basis — modest negotiation headroom, anchor on the comps not their cost.
Risks & watch-outs
- Watch-outs: built in 1894 — expect roof / HVAC / electrical / plumbing capex.
Questions for the listing agent
- Can we see the unit-by-unit rent roll, current vacancy, and any below-market leases? What's the average tenancy length?
- What capital expenditures (roof, boiler, parking lot, exteriors) have been made in the last 5 years, and what's planned in the next 2?
- Built in 1894 — when were the roof, HVAC, electrical panel, plumbing, and water heater last replaced?
- Is there a deadline driving the sale (1031 exchange, divorce, estate, relocation)? That informs how much negotiation room exists.
- What's the average days-on-market for RENTAL listings here right now (not sales)? A rising rental-DOM trend means longer vacancies and softer asking-rent achievability than the comps imply.
- What's the recent tenant-quality profile in this submarket — average credit score on applications, eviction rate, late-payment / NSF rate, and stable-employment percentage? A property-management company in the area should have these aggregated.
- How much new apartment / multifamily construction is in the pipeline within 1–3 miles? Heavy new supply (>2% of stock underway) typically softens rents 12–24 months out; light construction supports rent growth.
Investment metrics
- 1% rule
- 1.26% ✓
- Cap rate
- 9.83%
- Cash-on-cash
- 12.62%
- DSCR
- 1.56
- GRM
- 6.6
CMA / ARV
No comps found within radius.
Projected returns pro-forma
-3.0% appreciation · 8.0% rent growth · sell at horizon
- IRR
- 7.9%
- Equity multiple
- 1.33×
- Total profit
- $23,892
- Equity at exit
- $38,618
- IRR
- 21.2%
- Equity multiple
- 3.23×
- Total profit
- $162,017
- Equity at exit
- $22,394
Cash invested: $72,520 (down + closing). Projections, not guarantees.
Landlord ↔ Tenant lean methodology
- Overall (STATE)
- 46 Balanced
- State Minnesota
- 46 Balanced · D+2
- County
- — inherits STATE
- City
- — inherits STATE
ZIP-level market 55107
- Home prices YoY
- -16.2%
- Rents YoY
- 10.8%
- Active inventory
- 64
- Price-to-rent
- 13.2×
Monthly cashflow live
- Estimated rent
- $3,260 medium interval (Pro) →
- Mortgage (P&I)
- −$1,358
- Tax from tax record
- −$347 /mo · $4,160/yr
- Insurance
- −$108
- HOA
- −$0
- Vacancy / Maint / Mgmt
- −$685
- Net cashflow
- $763
Break-even live
2-unit breakdown (identical units grouped — click to expand)
| Units | Beds | Baths | Est. rent |
|---|---|---|---|
| 2× units | 3 | 2 | $3,260 |
| #1 | 3 | 2 | $1,630 |
| #2 | 3 | 2 | $1,630 |
| Total (2 units) | $3,260 | ||
UW: 25.0% down · 7.5% · 30yr · 1.5% tax · 5.0% vac · 8.0% maint · 8.0% mgmt
Financing live
Cash to close
- Down payment
- $64,750
- Closing costs
- $7,770
- Reserves months
- —
- Total cash needed
- —
Loan-product check · same deal, 3 products live
Conventional
25% down · 7.5% · 30yr
- Down + closing
- —
- Monthly P&I
- —
- Monthly cashflow
- —
- DSCR
- —
- Eligible?
- —
Personal DTI + credit; lowest rate.
DSCR
20% down · 8.5% · 30yr
- Down + closing
- —
- Monthly P&I
- —
- Monthly cashflow
- —
- DSCR
- —
- Eligible?
- —
No personal income docs; deal must DSCR.
Hard money
10% down · 12.0% · 12mo
- Down + closing
- —
- Monthly P&I
- —
- Monthly cashflow
- —
- DSCR
- —
- Eligible?
- —
Short-term bridge; refi at stabilization.
Rent comps 11 comps
| Address | Beds | Baths | Sqft | Rent | $/sqft | DOM | Units | Dist |
|---|---|---|---|---|---|---|---|---|
| 993 Robert St S Saint Paul, MN | 2.0 | 2.0 | 1214 | $1,765 | $1.45 | 5d | 1 | 0.47mi |
| 422 Arion St E West St Paul, MN | 2.0 | 1.0 | 1072 | $1,395 | $1.30 | 24d | 1 | 0.59mi |
| 421 Stanley St Unit 423 St Paul, MN | 2.0 | 1.0 | 1350 | $1,850 | $1.37 | 5d | 1 | 0.61mi |
| 460 Stanley St Unit 2 West St Paul, MN | 2.0 | 1.0 | 925 | $1,300 | $1.41 | 15d | 1 | 0.69mi |
| 45 Butler Ave E Saint Paul, MN | 1.0–3.0 | 1.0–2.0 | 1040 | $1,682 | $1.62 | 2d | 12 | 0.80mi |
| 140 Belvidere St W Unit 1 St Paul, MN | 2.0 | 1.0 | 1600 | $1,650 | $1.03 | 3d | 1 | 0.86mi |
| 1266 Gorman Ave Saint Paul, MN | 1.0–2.0 | 1.0 | 816 | $1,329 | $1.63 | 16d | 3 | 1.02mi |
| 1905 Parkwood Dr South Saint Paul, MN | 2.0 | 1.0–2.0 | 972 | $1,470 | $1.51 | 3d | 7 | 1.21mi |
| 177 Thompson Ave E West St Paul, MN | 1.0–2.0 | 1.0–1.5 | 850 | $1,450 | $1.71 | 2d | 4 | 1.31mi |
| 100 Imperial Dr W #303 Saint Paul, MN | 3.0 | 2.0 | 1646 | $2,800 | $1.70 | 24d | 1 | 1.33mi |
| 1380 Bidwell St Saint Paul, MN | 2.0 | 2.0 | 1106 | $1,700 | $1.54 | 18d | 1 | 1.37mi |
Listing history 18 events
-
2026-04-28status Pending
-
2026-04-21historical Contingent - Inspection
-
2026-04-02$259,000 Active
-
2019-10-23soldstatus $190,000
-
2019-10-11soldstatus $190,000 Sold 225-char remark
Show marketing remark (225 chars)
Opportunity knocks with this well maintained duplex. Own for less than rent. Your new home has great location and proximity to schools, parks, boys and girls club for kids, retail, restaurants and Downtown. Move in and enjoy.
-
2019-09-09status Pending 225-char remark
Show marketing remark (225 chars)
Opportunity knocks with this well maintained duplex. Own for less than rent. Your new home has great location and proximity to schools, parks, boys and girls club for kids, retail, restaurants and Downtown. Move in and enjoy.
-
2019-09-03historical Contingent - Inspection 225-char remark
Show marketing remark (225 chars)
Opportunity knocks with this well maintained duplex. Own for less than rent. Your new home has great location and proximity to schools, parks, boys and girls club for kids, retail, restaurants and Downtown. Move in and enjoy.
-
2019-08-30$189,900 Active 225-char remark
Show marketing remark (225 chars)
Opportunity knocks with this well maintained duplex. Own for less than rent. Your new home has great location and proximity to schools, parks, boys and girls club for kids, retail, restaurants and Downtown. Move in and enjoy.
-
2007-07-24soldstatus $152,900
-
2007-07-19soldstatus $152,900 265-char remark
Show marketing remark (265 chars)
Quiet neighborhood, newly-remodeled kitchen, hdwd flrs, blt-in buffet w/flanking bookcases. Mother-in-law apt w/separate entrance brings $395/month. High ceilings & formal DR. Close walking distance to Riverview Elementary & West Side Boys & Girls Club.
-
2007-06-29historical 265-char remark
Show marketing remark (265 chars)
Quiet neighborhood, newly-remodeled kitchen, hdwd flrs, blt-in buffet w/flanking bookcases. Mother-in-law apt w/separate entrance brings $395/month. High ceilings & formal DR. Close walking distance to Riverview Elementary & West Side Boys & Girls Club.
-
2007-01-12$152,900 265-char remark
Show marketing remark (265 chars)
Quiet neighborhood, newly-remodeled kitchen, hdwd flrs, blt-in buffet w/flanking bookcases. Mother-in-law apt w/separate entrance brings $395/month. High ceilings & formal DR. Close walking distance to Riverview Elementary & West Side Boys & Girls Club.
-
2006-10-10historical
-
2006-06-05$199,900
-
2006-06-05historical
-
2006-03-07historical
-
2006-03-07$225,000
-
2006-02-16$239,000
ⓘ Source: listings_history table (triggers on properties + properties_extension) + one-shot
backfill from property_details.listing_events for pre-trigger history.
Tax reassessment forecast MN · Partial reset (capped growth)
- Current annual tax
- $4,160 · $347/mo
- Projected year-2 tax
- $4,160 · $347/mo
- Expected delta
- $0/yr ($0/mo · 0.0%)
ⓘ Screening estimate from a state-policy table — verify with the county assessor before closing.
Climate risk First Street
- Flood 1/10 Low FEMA zone X (unshaded) · 0% chance over 30 yrs
- Wildfire 1/10 Low
- Heat 2/10 Low 7 d/yr ≥100°F today · 14 d/yr by 30 yrs out
- Wind 2/10 Low
- Air quality 2/10 Low 1 unhealthy d/yr today · 1 by 30 yrs out
Nearby sold comps map
Loading sold comps map…
Walkable amenities ~0.75 mi
Loading nearby amenities…
Taxation est. · year 1
- Rental income
- $39,120
- − Mortgage interest
- −$14,508
- − Property taxes
- −$4,160
- − Insurance
- −$1,295
- − Repairs & maintenance
- −$3,130
- − Management
- −$3,130
- − Depreciation
- −$7,535
- Taxable income
- $5,363
- Est. tax owed @ 24.0%
- −$1,287
- After-tax cash flow
- $7,864/yr
For passive investors: Depreciation is non-cash, so a rental often shows a tax loss while cash-flowing — sheltering income. Rental losses are passive: they offset passive income freely, and up to $25,000/yr can offset ordinary (W-2) income if you actively participate and your MAGI is under $100k (phasing out to $0 by $150k); unused losses carry forward. On sale, claimed depreciation is recaptured at up to 25%, and gains may owe capital-gains tax (a 1031 exchange can defer both). Figures are a year-1 estimate at your 24.0% rate — not tax advice; consult a CPA.
Schools (NCES district)
- District
- St. Paul Public School District
- NCES district ID
- 2733840
- Math proficiency
- 21% ▼ -11.00%
- Reading proficiency
- 33% ▼ -7.00%
- Median HH income
- $48,316
- Composite
- 23.51/100
- National rank
- #7868
- State rank
- #270 of 301 in MN
Livability — St. Paul
No livability data for this city. (Only ~50 U.S. cities are tracked.)
Census & demographics
- Census place
- St. Paul, MN
- County
- Ramsey County · 542,837 people
- City population
- 280,599
- Metro
- Minneapolis-St. Paul-Bloomington, MN-WI
- Population (ZIP)
- 15,377
- Household income
- $74,531
- Rent vs Own
- Severe rent burden
- 639.0
Population outlook (Ramsey County) Hauer SSP2
- Today (2025)
- 603,431 people
- By 2030
- 636,459 · +5.5%
- By 2040
- 700,596 · +16.1%
- By 2050
- 765,819 · +26.9%
- By 2075
- 929,297 · +54.0%
- By 2100
- 1,053,924 · +74.7%
Race, ethnicity, and origin ACS 2023
- Neighborhood character
- Highly diverse neighborhood (Simpson 0.71)
- Race & ethnicity
- White 47% Hispanic / Latino 23% Two or more races 16% Black 13% Asian 9% Native American 2%
- Hispanic origin (detail)
- Mexican 19%
- Common ancestry
- Portuguese 7% Lithuanian 3% Romanian 2%
- Foreign-born
- 18% · Canada, Philippines, Vietnam
- Languages at home
- 72% English-only · Spanish 15% Other Asian/Pacific 4% Tagalog/Filipino 2%
Political lean MEDSL · Ramsey
- 2024 margin
- Solid D (+43.3) · D 70.5% · R 27.2% · Other 2.3%
- 2008→2024 swing
- +9.4pp toward D · 2008: 33.9pp · 2024: 43.3pp
- All cycles
- 2024: D+43.3 2020: D+45.4 2016: D+39.4 2012: D+35.3 2008: D+33.9
Not yet ingested
- Civics
- —
Market trends
- HPI YoY
- ▼ -57.70%
- Current HPI
- 298.8714
- Rent YoY
- ▲ 10.76%
- Metro
- Minneapolis-St. Paul-Bloomington, MN-WI
- State GDP YoY
- ▲ 2.41%
- F500 in state
- 34
Industry mix (Fortune 500 HQ in MN)
| Industry | F500 HQs | Revenue |
|---|---|---|
| Healthcare | 2 | $407B |
|
||
| Retail | 2 | $150B |
|
||
| Consumer Goods | 2 | $32B |
|
||
| Industrial Machinery | 2 | $6B |
|
||
| Agriculture | 1 | $40B |
|
||
| Healthcare / Medical Devices | 1 | $32B |
|
||
Price history
+8.4% since first listed18 events — show timeline
- 2026-04-28 Pending — NORTHSTARMLS as Distributed by MLS Grid
- 2026-04-21 Contingent — NORTHSTARMLS as Distributed by MLS Grid
- 2026-04-02 Listed $259,000 NORTHSTARMLS as Distributed by MLS Grid
- 2019-10-23 Sold (Public Records) $190,000 Public Records
- 2019-10-11 Sold (MLS) $190,000 NORTHSTARMLS as Distributed by MLS Grid
- 2019-09-09 Pending — NORTHSTARMLS as Distributed by MLS Grid
- 2019-09-03 Contingent — NORTHSTARMLS as Distributed by MLS Grid
- 2019-08-30 Listed $189,900 NORTHSTARMLS as Distributed by MLS Grid
- 2007-07-24 Sold (Public Records) $152,900 Public Records
- 2007-07-19 Sold (MLS) $152,900 NORTHSTARMLS as Distributed by MLS Grid
- 2007-06-29 Listing Removed — NORTHSTARMLS as Distributed by MLS Grid
- 2007-01-12 Listed $152,900 NORTHSTARMLS as Distributed by MLS Grid
- 2006-10-10 Listing Removed — NORTHSTARMLS as Distributed by MLS Grid
- 2006-06-05 Listing Removed — NORTHSTARMLS as Distributed by MLS Grid
- 2006-06-05 Listed $199,900 NORTHSTARMLS as Distributed by MLS Grid
- 2006-03-07 Listed $225,000 NORTHSTARMLS as Distributed by MLS Grid
- 2006-03-07 Listing Removed — NORTHSTARMLS as Distributed by MLS Grid
- 2006-02-16 Listed $239,000 NORTHSTARMLS as Distributed by MLS Grid
Property tax history
+10.5%/yrLatest (2025): $4,160 · +21.5% YoY. Source: county tax records.
Cash-flow waterfall
monthlySold comps — $/sqft
last 12 mo · ≤1 miLoading sold comps…