 🏷️ Likely Rental
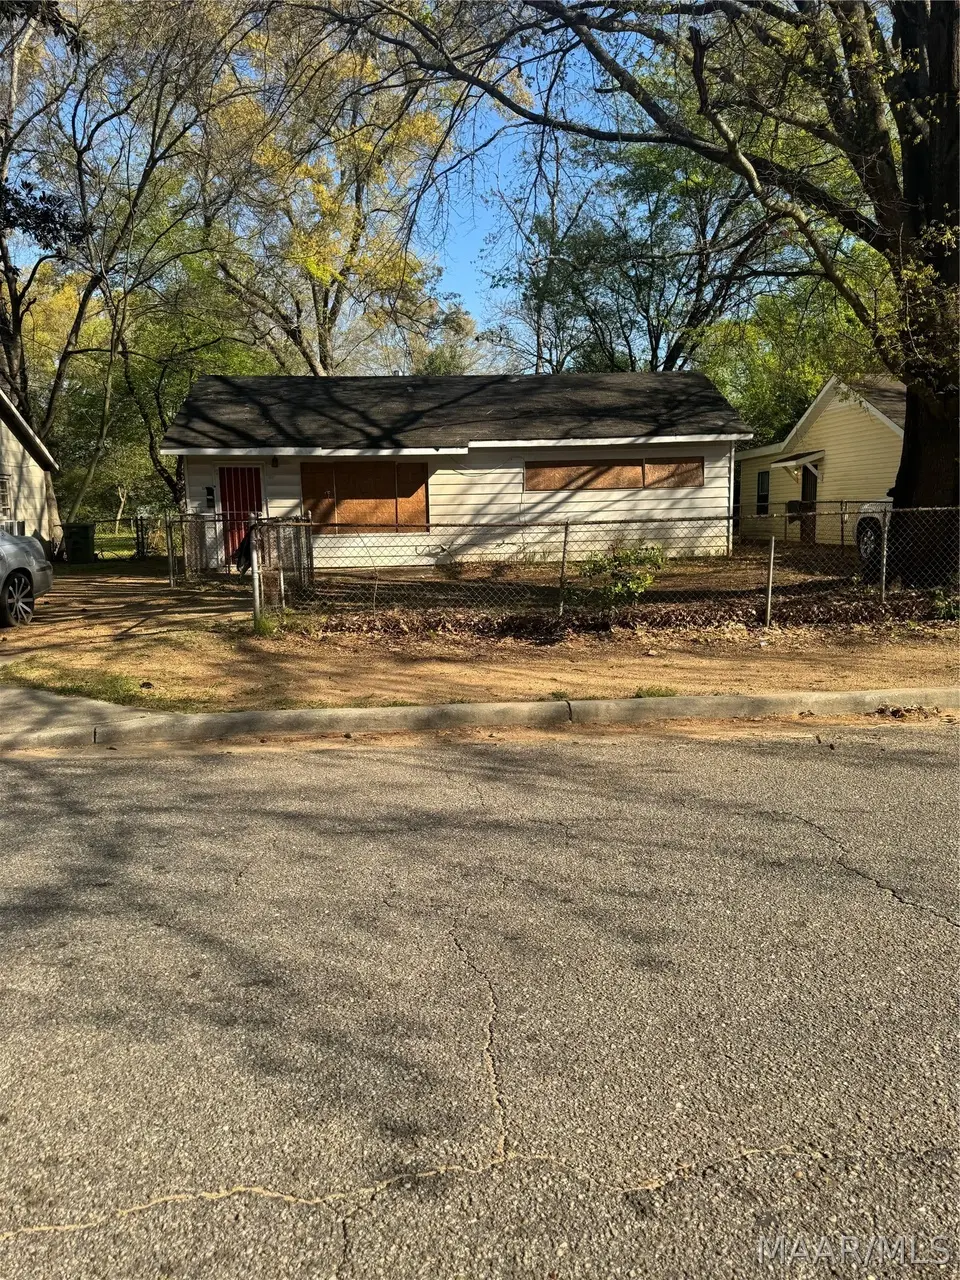
319 E Park Ave · Montgomery, AL
Flood risk 1/10 · Minimal
- FEMA flood zone
- X (unshaded)
- Chance of flooding over 30 yrs
- 0.0%
- Est. flood insurance / yr
- $507 – $1,088
Fire risk 3/10 · Minor
- Est. fire insurance / yr
- $916 – $1,700
Heat risk 7/10 · Major
- Hot days now (above 107°F)
- 7 days/yr
- Hot days in 30 yrs
- 18 days/yr
Wind risk 8/10 · Major
- Chance of severe wind over 30 yrs
- 80.0%
Air-quality risk 3/10 · Minor
- Unhealthy air days now
- 4 days/yr
- Unhealthy air days in 30 yrs
- 4 days/yr
Risk factors via First Street. Map © Google.
Why this score? — see what drove the D+ grade
The composite is a weighted blend of 9 inputs, each scored 0–100. Each bar is that input's sub-score; the figure is the points it added to the 100-point composite (weight × sub-score).
- Cash flow +15.0/30.0
- ARV discount +15.0/15.0
- 1% rule +5.0/10.0
- DSCR +5.0/10.0
- Livability +3.2/5.0
- Rent growth +2.5/5.0
- Condition / age +2.5/5.0
- Schools +1.7/10.0
- Appreciation +0.0/10.0
$20,000
🖨 Deal sheet 📄 Offer letter ✓ Due diligence
Listing remarks MLS
Investor special!! Seller is willing to sell individually or as an 11-property bundle priced at $253,000. Once rehabbed, all eleven properties would make for a great Section 8 portfolio, and are eligible for seller financing, or seller financed rehab loan. Properties included in the bundle are 409 Chisholm St, 212 E Park, 319 E Park, 6000 Oakleigh, 6153 Cherry Hill, 4599 Dover, 39 Davis St, 229 W. Woodland, 3763 Whiting Ave, 3256 Upchurch, and 116 Hobbie.
Key facts
- Parking
- Built 1955
- Listed 31 days
Neighborhood map
What this means for you Summary
Snapshot
- This is a 2-bed/1.0-bath single-family listed at $20k.
Deal economics
- At list price, monthly cash flow is $672 ($8k/yr) — positive.
- The deal already cash-flows at list — no discount required.
- Meets the 1% rule at list price ($1k rent vs $20k).
- Recommended offer: $19k (3.0% below list) — sets the bar for market timing.
- Cap rate 46.6% vs local median 6.0% in Montgomery — top-decile yield for the area; either an underpriced asset or a hidden risk that comps aren't pricing in. Stress-test before assuming the spread holds.
Location & tenants
- Location reads 65/100 on livability (#138 in AL) — a middle-class / working-renter tenant base. Strengths: cost of living A+, housing A+; Watch: schools C-, employment D, crime F.
- Montgomery County (urban): math 9% / reading 31% proficiency, ranked #106 of 129 in AL (top 82%) — low school quality limits family demand, transient renter base, plan for 1-2y turnover; 70% free/reduced lunch — lower-income household profile, screen leases tightly.
- Market conditions: 62 active listings in the ZIP; 30 comparable units currently listed for rent nearby; rentals lingering (median 44d on market — plan ~5-8 weeks vacancy on turnover, expect pricing pressure); 67% of comp listings sitting > 30 days — soft ceiling on asking rent; 460 units permitted in Montgomery County in 2024 (37 in 5+ unit buildings).
Forward outlook
- Local home prices are declining (-3.0%/yr); year-one equity from $138 of loan paydown is wiped out by about $600 of value loss. Plan a longer hold.
- Montgomery County population projected to shrink 8% by 2050 — rents likely to lag national; underwrite the cash flow, not the appreciation.
- At projected returns (-3.0% appreciation + 3.0% rent growth), your $6k cash investment doubles in ~1 year — after that, you're playing with house money.
Negotiation context
- It's been on market 31 days — a 3% lower offer ($19k) is reasonable based on typical stale-listing flexibility.
- 3 sale attempts since 19y ago with the ask held roughly flat each time — persistent listings suggest the price (not the market) is what's stuck; bring a comps-based counter.
Risks & watch-outs
- Watch-outs: built in 1955 — expect roof / HVAC / electrical / plumbing capex.
- Climate carrying-cost: severe wind risk, 80% chance of damaging wind over 30y; extreme-heat days projected 7→18/yr by 2055 (HVAC capex compounding) — expect insurance premiums to compound above CPI over the hold.
Questions for the listing agent
- It's been on market 31 days. Have you received any prior offers? Is the seller open to a 3% concession, seller financing, or rate buy-down credit?
- Built in 1955 — when were the roof, HVAC, electrical panel, plumbing, and water heater last replaced?
- Is there a deadline driving the sale (1031 exchange, divorce, estate, relocation)? That informs how much negotiation room exists.
- Crime grade is F in this area — have there been break-ins, vandalism, or insurance claims at this property in the last 3 years? What carrier currently insures it and at what premium?
- The area grade is low — what's the realistic commute time and amenity access for the typical tenant pool here? Any planned neighborhood developments (good or bad) we should know about?
- What's the average days-on-market for RENTAL listings here right now (not sales)? A rising rental-DOM trend means longer vacancies and softer asking-rent achievability than the comps imply.
- What's the recent tenant-quality profile in this submarket — average credit score on applications, eviction rate, late-payment / NSF rate, and stable-employment percentage? A property-management company in the area should have these aggregated.
- How much new for-sale + rental construction is in the pipeline within 1–3 miles? Heavy new supply typically softens prices + rents 12–24 months out; constrained supply supports both.
Investment metrics
- 1% rule
- 5.05% ✓
- Cap rate
- 46.59%
- Cash-on-cash
- 143.91%
- DSCR
- 7.40
- GRM
- 1.7
CMA / ARV
- ARV (median comp)
- $35,218
- List price
- $20,000
- Delta
- -43.21%
- Verdict
- UNDERPRICED
- Comps
- 20 within 1.0 mi
Show comp detail 12 sales within ~0.75 mi
| Address | Dist | Beds/Ba | Sqft | Sold | Price | $/sf | Match |
|---|---|---|---|---|---|---|---|
| 341 Chisholm St | 0.13mi | 3/1.0 (+1) | 756 (0%) | 11mo | $33,500 | $44 | 80 |
| 121 Kiwanis St | 0.24mi | 3/1.0 (+1) | 735 (-3%) | 1mo | $27,000 | $37 | 78 |
| 462 E Park Ave | 0.28mi | 2/1.0 | 755 (-0%) | 14mo | $12,000 | $16 | 75 |
| 3915 Fairground Rd | 0.30mi | 2/1.0 | 792 (+5%) | 6mo | $39,500 | $50 | 73 |
| 1625 Champion St | 0.48mi | 3/1.0 (+1) | 840 (+11%) | 0mo | $72,500 | $86 | 54 |
| 3463 Cotton St | 0.43mi | 3/1.0 (+1) | 829 (+10%) | 10mo | $37,500 | $45 | 51 |
| 429 Edward St | 0.66mi | 3/1.0 (+1) | 828 (+10%) | 1mo | $55,500 | $67 | 48 |
| 418 Edwards St | 0.66mi | 3/1.0 (+1) | 828 (+10%) | 3mo | $24,500 | $30 | 46 |
| 412 Edward St | 0.65mi | 3/1.0 (+1) | 828 (+10%) | 6mo | $35,000 | $42 | 44 |
| 1818 Rigby St | 0.65mi | 3/1.0 (+1) | 832 (+10%) | 7mo | $26,500 | $32 | 42 |
| 31 Michigan Ave | 0.59mi | 3/1.0 (+1) | 840 (+11%) | 13mo | $38,000 | $45 | 39 |
| 1703 Gibson St | 0.72mi | 2/1.0 | 868 (+15%) | 13mo | $26,000 | $30 | 31 |
Match score weights: distance 35% · size 25% · config 20% · recency 20%. Top-matched comps best support the ARV.
Projected returns pro-forma
-3.0% appreciation · 3.0% rent growth · sell at horizon
- IRR
- —
- Equity multiple
- 8.06×
- Total profit
- $39,540
- Equity at exit
- $2,982
- IRR
- —
- Equity multiple
- 16.99×
- Total profit
- $89,540
- Equity at exit
- $1,729
Cash invested: $5,600 (down + closing). Projections, not guarantees.
Landlord ↔ Tenant lean methodology
- Overall (STATE)
- 90 Strongly Landlord-Friendly
- State Alabama
- 90 Strongly Landlord-Friendly · R+15
- County
- — inherits STATE
- City
- — inherits STATE
ZIP-level market 36110
- Home prices YoY
- -34.8%
- Active inventory
- 62
- Price-to-rent
- 1.7×
Monthly cashflow live
- Estimated rent
- $1,010 high interval (Pro) →
- Mortgage (P&I)
- −$105
- Tax from tax record
- −$13 /mo · $153/yr
- Insurance
- −$8
- HOA
- −$0
- Vacancy / Maint / Mgmt
- −$212
- Net cashflow
- $672
Break-even live
UW: 25.0% down · 7.5% · 30yr · 1.5% tax · 5.0% vac · 8.0% maint · 8.0% mgmt
Financing live
Cash to close
- Down payment
- $5,000
- Closing costs
- $600
- Reserves months
- —
- Total cash needed
- —
Loan-product check · same deal, 3 products live
Conventional
25% down · 7.5% · 30yr
- Down + closing
- —
- Monthly P&I
- —
- Monthly cashflow
- —
- DSCR
- —
- Eligible?
- —
Personal DTI + credit; lowest rate.
DSCR
20% down · 8.5% · 30yr
- Down + closing
- —
- Monthly P&I
- —
- Monthly cashflow
- —
- DSCR
- —
- Eligible?
- —
No personal income docs; deal must DSCR.
Hard money
10% down · 12.0% · 12mo
- Down + closing
- —
- Monthly P&I
- —
- Monthly cashflow
- —
- DSCR
- —
- Eligible?
- —
Short-term bridge; refi at stabilization.
Rent comps 30 comps
| Address | Beds | Baths | Sqft | Rent | $/sqft | DOM | Units | Dist |
|---|---|---|---|---|---|---|---|---|
| 4010 Vandiver Ct Montgomery, AL | 2.0 | 2.0 | 630 | $1,050 | $1.67 | 43d | 1 | 0.03mi |
| 341 Chisholm St Montgomery, AL | 3.0 | 1.0 | 756 | $1,195 | $1.58 | 20d | 1 | 0.15mi |
| 216 Gardendale Dr Montgomery, AL | 3.0 | 1.0 | 900 | $850 | $0.94 | 20d | 1 | 0.19mi |
| 4029 Chelsea Dr Montgomery, AL | 3.0 | 1.0 | 1000 | $1,200 | $1.20 | 43d | 1 | 0.22mi |
| 218 Broadway St Montgomery, AL | 2.0 | 1.0 | 960 | $895 | $0.93 | 13d | 1 | 0.25mi |
| 298 Broadway St Montgomery, AL | 2.0 | 1.0 | 896 | $900 | $1.00 | 43d | 1 | 0.25mi |
| 3329 Texas St Montgomery, AL | 3.0 | 1.0 | 1000 | $1,100 | $1.10 | 43d | 1 | 0.47mi |
| 16 Garden St Montgomery, AL | 3.0 | 1.5 | 1008 | $775 | $0.77 | 44d | 1 | 0.49mi |
| 2107 Yarbrough Cir Montgomery, AL | 3.0 | 1.0 | 910 | $925 | $1.02 | 43d | 1 | 0.53mi |
| 2111 Yarbrough St Montgomery, AL | 3.0 | 1.0 | 962 | $795 | $0.83 | 43d | 1 | 0.57mi |
| 412 Edward St Montgomery, AL | 3.0 | 1.0 | 828 | $800 | $0.97 | 43d | 1 | 0.65mi |
| 207 Destin St Montgomery, AL | 3.0 | 1.0 | 966 | $695 | $0.72 | 20d | 1 | 0.66mi |
| 429 Edward St Montgomery, AL | 3.0 | 1.0 | 828 | $1,080 | $1.30 | 13d | 1 | 0.66mi |
| 3114 Cotton St Montgomery, AL | 3.0 | 1.0 | 888 | $1,100 | $1.24 | 43d | 1 | 0.73mi |
| 3613 Erwin Dr Montgomery, AL | 3.0 | 2.0 | 1092 | $1,250 | $1.14 | 43d | 1 | 0.74mi |
| 142 W Michigan Ave Montgomery, AL | 3.0 | 1.0 | 840 | $995 | $1.18 | 13d | 1 | 0.80mi |
| 1817 Texas Ct Montgomery, AL | 3.0 | 1.0 | 925 | $1,050 | $1.14 | 20d | 1 | 0.85mi |
| 3042 George B Edmondson Dr Montgomery, AL | 3.0 | 1.0 | 900 | $860 | $0.96 | 43d | 1 | 0.85mi |
| 3024 Tyler Rd Montgomery, AL | 3.0 | 1.0 | 892 | $725 | $0.81 | 20d | 1 | 0.92mi |
| 325 3rd St Montgomery, AL | 2.0 | 1.0 | 925 | $850 | $0.92 | 43d | 1 | 0.93mi |
| 2056 Midway St Montgomery, AL | 3.0 | 1.0 | 1110 | $985 | $0.89 | 43d | 1 | 0.93mi |
| 2076 Midway St Montgomery, AL | 3.0 | 1.0 | 1068 | $1,000 | $0.94 | 43d | 1 | 0.94mi |
| 105 Dyas Ct Montgomery, AL | 3.0 | 1.0 | 1025 | $1,095 | $1.07 | 43d | 1 | 0.96mi |
| 3070 Tremont St Montgomery, AL | 3.0 | 1.0 | 1102 | $1,450 | $1.32 | 43d | 1 | 1.09mi |
| 3090 Alabama River Pkwy Montgomery, AL | 1.0 | 1.0 | 986 | $1,100 | $1.12 | 13d | 1 | 1.14mi |
| 408 Briarbrook Dr Montgomery, AL | 3.0 | 2.0 | 1025 | $960 | $0.94 | 20d | 1 | 1.22mi |
| 408 Briarbrook Dr #204 Montgomery, AL | 3.0 | 2.0 | 1025 | $1,000 | $0.98 | 43d | 1 | 1.22mi |
| 1324 Federal Dr Montgomery, AL | 2.0 | 1.0 | 1000 | $1,100 | $1.10 | 43d | 1 | 1.37mi |
| 2503 Skyline Ave Montgomery, AL | 3.0 | 1.0 | 1015 | $1,150 | $1.13 | 43d | 1 | 1.38mi |
| 2006 Harmon St Unit 3 Montgomery, AL | 3.0 | 1.0 | 800 | $500 | $0.62 | 43d | 1 | 1.46mi |
Listing history 17 events
-
2026-06-15status $20,000 Pending 31 DOM
-
2026-06-15days on market $20,000 Active 31 DOM
-
2026-06-14days on market $20,000 Active 29 DOM
-
2026-06-13days on market $20,000 Active 28 DOM
-
2026-06-10days on market $20,000 Active 26 DOM
-
2026-06-09days on market $20,000 Active 25 DOM
-
2026-06-08days on market $20,000 Active 24 DOM
-
2026-06-07days on market $20,000 Active 23 DOM
-
2026-06-03days on market $20,000 Active 19 DOM
-
2026-06-02days on market $20,000 Active 18 DOM
-
2026-06-01days on market $20,000 Active 17 DOM
-
2026-05-31days on market $20,000 Active 16 DOM
-
2026-05-30days on market $20,000 Active 15 DOM
-
2026-05-15status Active 459-char remark
Show marketing remark (459 chars)
Investor special!! Seller is willing to sell individually or as an 11-property bundle priced at $253,000. Once rehabbed, all eleven properties would make for a great Section 8 portfolio, and are eligible for seller financing, or seller financed rehab loan. Properties included in the bundle are 409 Chisholm St, 212 E Park, 319 E Park, 6000 Oakleigh, 6153 Cherry Hill, 4599 Dover, 39 Davis St, 229 W. Woodland, 3763 Whiting Ave, 3256 Upchurch, and 116 Hobbie.
-
2026-04-03historical 459-char remark
Show marketing remark (459 chars)
Investor special!! Seller is willing to sell individually or as an 11-property bundle priced at $253,000. Once rehabbed, all eleven properties would make for a great Section 8 portfolio, and are eligible for seller financing, or seller financed rehab loan. Properties included in the bundle are 409 Chisholm St, 212 E Park, 319 E Park, 6000 Oakleigh, 6153 Cherry Hill, 4599 Dover, 39 Davis St, 229 W. Woodland, 3763 Whiting Ave, 3256 Upchurch, and 116 Hobbie.
-
2026-04-02$20,000 Active 459-char remark
Show marketing remark (459 chars)
Investor special!! Seller is willing to sell individually or as an 11-property bundle priced at $253,000. Once rehabbed, all eleven properties would make for a great Section 8 portfolio, and are eligible for seller financing, or seller financed rehab loan. Properties included in the bundle are 409 Chisholm St, 212 E Park, 319 E Park, 6000 Oakleigh, 6153 Cherry Hill, 4599 Dover, 39 Davis St, 229 W. Woodland, 3763 Whiting Ave, 3256 Upchurch, and 116 Hobbie.
-
2007-02-26$29,900
ⓘ Source: listings_history table (triggers on properties + properties_extension) + one-shot
backfill from property_details.listing_events for pre-trigger history.
Tax reassessment forecast AL · Resets to sale price
- Current annual tax
- $153 · $13/mo
- Projected year-2 tax
- $153 · $13/mo
- Expected delta
- $0/yr ($0/mo · 0.0%)
ⓘ Screening estimate from a state-policy table — verify with the county assessor before closing.
Climate risk First Street
- Flood 1/10 Low FEMA zone X (unshaded) · 0% chance over 30 yrs
- Wildfire 3/10 Moderate
- Heat 7/10 Severe 7 d/yr ≥107°F today · 18 d/yr by 30 yrs out
- Wind 8/10 Severe 80% chance of damaging wind over 30 yrs
- Air quality 3/10 Moderate 4 unhealthy d/yr today · 4 by 30 yrs out
Nearby sold comps map
Loading sold comps map…
Walkable amenities ~0.75 mi
Loading nearby amenities…
Taxation est. · year 1
- Rental income
- $12,115
- − Mortgage interest
- −$1,120
- − Property taxes
- −$153
- − Insurance
- −$100
- − Repairs & maintenance
- −$969
- − Management
- −$969
- − Depreciation
- −$582
- Taxable income
- $8,221
- Est. tax owed @ 24.0%
- −$1,973
- After-tax cash flow
- $6,086/yr
For passive investors: Depreciation is non-cash, so a rental often shows a tax loss while cash-flowing — sheltering income. Rental losses are passive: they offset passive income freely, and up to $25,000/yr can offset ordinary (W-2) income if you actively participate and your MAGI is under $100k (phasing out to $0 by $150k); unused losses carry forward. On sale, claimed depreciation is recaptured at up to 25%, and gains may owe capital-gains tax (a 1031 exchange can defer both). Figures are a year-1 estimate at your 24.0% rate — not tax advice; consult a CPA.
Schools (NCES district)
- District
- Montgomery County
- NCES district ID
- 0102430
- Math proficiency
- 9% ▼ -21.00%
- Reading proficiency
- 31% ▼ -1.00%
- Median HH income
- $43,902
- Composite
- 17.24/100
- National rank
- #9093
- State rank
- #106 of 129 in AL
Livability — Montgomery
- Score
- 65/100
- State rank
- #138
- US rank
- #13416
Category grades
Schools grade is shown separately in the Schools card above.
Census & demographics
- Census place
- Montgomery, AL
- County
- Montgomery County · 190,016 people
- City population
- 175,913
- Metro
- Montgomery, AL
- Population (ZIP)
- 12,102
- Household income
- $47,315
- Rent vs Own
- Severe rent burden
- 753.0
Population outlook (Montgomery County) Hauer SSP2
- Today (2025)
- 224,008 people
- By 2030
- 221,460 · -1.1%
- By 2040
- 214,179 · -4.4%
- By 2050
- 204,912 · -8.5%
- By 2075
- 177,821 · -20.6%
- By 2100
- 145,134 · -35.2%
Race, ethnicity, and origin ACS 2023
- Neighborhood character
- Predominantly Black (83%)
- Race & ethnicity
- Black 83% White 11% Two or more races 3% Asian 2% Hispanic / Latino 1%
- Common ancestry
- Hispanic 1%
- Foreign-born
- 2% · China, Canada
- Languages at home
- 96% English-only · Spanish 2% Other Asian/Pacific 1%
Political lean MEDSL · Montgomery
- 2024 margin
- Solid D (+30.7) · D 64.8% · R 34.1% · Other 1.1%
- 2008→2024 swing
- +11.5pp toward D · 2008: 19.2pp · 2024: 30.7pp
- All cycles
- 2024: D+30.7 2020: D+31.5 2016: D+26.2 2012: D+24.3 2008: D+19.2
Not yet ingested
- Civics
- —
Market trends
- HPI YoY
- ▼ -35.37%
- Current HPI
- 66.3114
- Rent YoY
- —
- Metro
- Montgomery, AL
- State GDP YoY
- ▲ 2.94%
- F500 in state
- 4
Industry mix (Fortune 500 HQ in AL)
| Industry | F500 HQs | Revenue |
|---|---|---|
| Financial Services | 1 | $8B |
|
||
| Healthcare | 1 | $5B |
|
||
Price history
-33.1% since first listed4 events — show timeline
- 2026-05-15 Relisted — MAAR
- 2026-04-03 Delisted — MAAR
- 2026-04-02 Listed $20,000 MAAR
- 2007-02-26 Listed $29,900 MAAR
Property tax history
+17.2%/yrLatest (2025): $153 · +6.8% YoY. Source: county tax records.
Cash-flow waterfall
monthlySold comps — $/sqft
last 12 mo · ≤1 miLoading sold comps…