 🏗️ New Construction
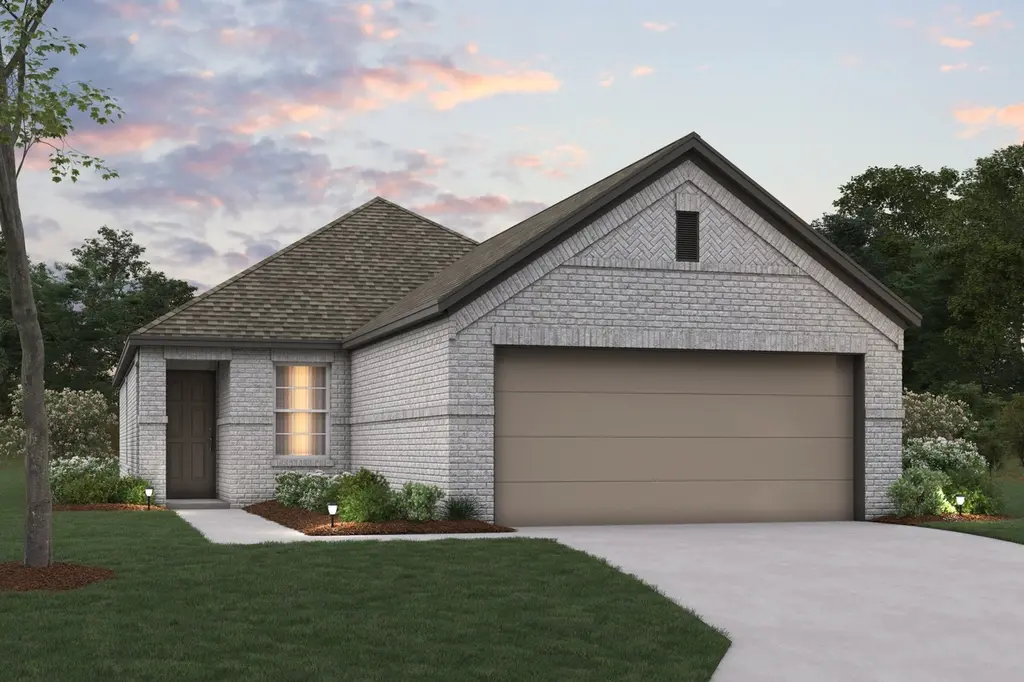
Primrose Plan · Lavon, TX
Flood risk No data
- FEMA flood zone
- —
- Chance of flooding over 30 yrs
- —
- Est. flood insurance / yr
- —
Fire risk No data
- Est. fire insurance / yr
- —
Heat risk No data
- Hot days now (above threshold)
- —
- Hot days in 30 yrs
- —
Wind risk No data
- Chance of severe wind over 30 yrs
- —
Air-quality risk No data
- Unhealthy air days now
- —
- Unhealthy air days in 30 yrs
- —
Risk factors via First Street. Map © Google.
Why this score? — see what drove the F grade
The composite is a weighted blend of 9 inputs, each scored 0–100. Each bar is that input's sub-score; the figure is the points it added to the 100-point composite (weight × sub-score).
- ARV discount +7.5/15.0
- Cash flow +6.3/30.0
- Livability +3.3/5.0
- Schools +3.2/10.0
- Rent growth +2.5/5.0
- Condition / age +2.5/5.0
- 1% rule +1.5/10.0
- DSCR +0.6/10.0
- Appreciation +0.0/10.0
$261,990
🖨 Deal sheet 📄 Offer letter ✓ Due diligence
Listing remarks MLS
The Primrose is one of M/I Homes' newest 30' Smart Series plans, offering the flexibility you are looking for in a new home design and providing the ease of style found in our Interior and Exterior Design packages. This plan delivers 3 bedrooms, 2 bathrooms, and 1,349-1,397 square feet of living space.
Key facts
- Smart series plans
- 2 garage spots
- Listed 739 days
Tags
Neighborhood map
What this means for you Summary
Snapshot
- This is a 3-bed/2.0-bath single-family listed at $262k.
Deal economics
- At list price, monthly cash flow is $-565 ($-7k/yr) — negative.
- To cash-flow at today's rent, offer at most $233k (11.0% below list).
- To meet the 1% rule (rent ≥ 1% of price), the offer needs to be $204k (22.2% below list).
- Recommended offer: $204k (22.2% below list) — sets the bar for 1% rule.
Location & tenants
- Location reads 66/100 on livability (#588 in TX) — a middle-class / working-renter tenant base. Strengths: employment A+, housing A+, cost of living B; Watch: amenities F, commute F, health & safety F.
- Community ISD (rural): math 30% / reading 38% proficiency, ranked #479 of 826 in TX (top 58%) — families likely to look elsewhere, expect single-tenant / working-renter base with shorter leases.
- Market conditions: 634 active listings in the ZIP; 15 comparable units currently listed for rent nearby; rentals leasing fast (median 13d on market — plan ~1-2 weeks tenant-placement turnaround); high-income renter base; 19,194 units permitted in Collin County in 2024 (3,988 in 5+ unit buildings).
Forward outlook
- Local home prices are declining (-3.0%/yr); year-one equity from $2k of loan paydown is wiped out by about $9k of value loss. Plan a longer hold.
- Collin County population projected at +60% by 2050 — long-run rental-demand tailwind backs the buy-and-hold thesis.
Negotiation context
- It's been on market 740 days — a 12% lower offer ($231k) is reasonable based on typical stale-listing flexibility.
Questions for the listing agent
- What do current leases actually rent for vs. the listed asking? Can we see a recent rent roll and the last 12 months of T-12 income?
- It's been on market 740 days. Have you received any prior offers? Is the seller open to a 22% concession, seller financing, or rate buy-down credit?
- Why hasn't it sold? Are there any deal-killer items the seller is aware of (foundation, flood, title, zoning, code violations)?
- Is there a deadline driving the sale (1031 exchange, divorce, estate, relocation)? That informs how much negotiation room exists.
- The area grade is low — what's the realistic commute time and amenity access for the typical tenant pool here? Any planned neighborhood developments (good or bad) we should know about?
- What's the average days-on-market for RENTAL listings here right now (not sales)? A rising rental-DOM trend means longer vacancies and softer asking-rent achievability than the comps imply.
- What's the recent tenant-quality profile in this submarket — average credit score on applications, eviction rate, late-payment / NSF rate, and stable-employment percentage? A property-management company in the area should have these aggregated.
- How much new for-sale + rental construction is in the pipeline within 1–3 miles? Heavy new supply typically softens prices + rents 12–24 months out; constrained supply supports both.
Investment metrics
- 1% rule
- 0.65% ✗
- Cap rate
- 4.14%
- Cash-on-cash
- -7.69%
- DSCR
- 0.66
- GRM
- 12.9
CMA / ARV
- ARV (median comp)
- $314,876
- List price
- $261,990
- Delta
- -16.80%
- Verdict
- UNDERPRICED
- Comps
- 20 within 1.0 mi
Show comp detail 12 sales within ~0.75 mi
| Address | Dist | Beds/Ba | Sqft | Sold | Price | $/sf | Match |
|---|---|---|---|---|---|---|---|
| 730 Hidden Feather | 0.49mi | 3/2.0 | 1,397 (+4%) | 3mo | $247,990 | $178 | 69 |
| 701 Chipper Trl | 0.59mi | 3/2.0 | 1,429 (+6%) | 4mo | $278,990 | $195 | 59 |
| 656 Chipper Trl | 0.56mi | 3/2.0 | 1,451 (+8%) | 4mo | $274,990 | $190 | 58 |
| 635 Dove Haven Way | 0.65mi | 3/2.0 | 1,448 (+7%) | 0mo | $295,990 | $204 | 58 |
| 703 Walkabout Pl | 0.66mi | 3/2.0 | 1,429 (+6%) | 3mo | $304,490 | $213 | 57 |
| 560 Clear Rain St | 0.57mi | 3/2.0 | 1,451 (+8%) | 5mo | $324,990 | $224 | 57 |
| 769 Sunglow Way | 0.70mi | 3/2.0 | 1,451 (+8%) | 1mo | $294,995 | $203 | 54 |
| 753 Sunglow Way | 0.69mi | 3/2.0 | 1,451 (+8%) | 2mo | $295,990 | $204 | 54 |
| 587 Cherish Day Dr | 0.64mi | 3/2.0 | 1,537 (+14%) | 3mo | $283,990 | $185 | 44 |
| 651 Walkabout Pl | 0.66mi | 3/2.0 | 1,537 (+14%) | 4mo | $289,990 | $189 | 43 |
| 470 Dreamers Ln | 0.70mi | 3/2.5 | 1,525 (+13%) | 2mo | $259,970 | $170 | 42 |
| 471 Sweet Spring Dr | 0.72mi | 3/2.5 | 1,525 (+13%) | 1mo | $259,970 | $170 | 42 |
Match score weights: distance 35% · size 25% · config 20% · recency 20%. Top-matched comps best support the ARV.
Projected returns pro-forma
-3.0% appreciation · 3.0% rent growth · sell at horizon
- IRR
- -29.7%
- Equity multiple
- 0.01×
- Total profit
- $-86,973
- Equity at exit
- $46,949
- IRR
- -30.7%
- Equity multiple
- -0.38×
- Total profit
- $-121,939
- Equity at exit
- $27,225
Cash invested: $88,165 (down + closing). Projections, not guarantees.
Landlord ↔ Tenant lean methodology
- Overall (STATE)
- 87 Strongly Landlord-Friendly
- State Texas
- 87 Strongly Landlord-Friendly · R+5
- County
- — inherits STATE
- City
- — inherits STATE
ZIP-level market 75166
- Home prices YoY
- -9.9%
- Active inventory
- 634
- Price-to-rent
- 10.7×
Monthly cashflow live
- Estimated rent
- $2,039 high interval (Pro) →
- Mortgage (P&I)
- −$1,651
- Tax est. 1.5%
- −$394 /mo · $4,723/yr
- Insurance
- −$131
- HOA
- −$0
- Vacancy / Maint / Mgmt
- −$428
- Net cashflow
- $-565
Break-even live
UW: 25.0% down · 7.5% · 30yr · 1.5% tax · 5.0% vac · 8.0% maint · 8.0% mgmt
Financing live
Cash to close
- Down payment
- $78,719
- Closing costs
- $9,446
- Reserves months
- —
- Total cash needed
- —
Loan-product check · same deal, 3 products live
Conventional
25% down · 7.5% · 30yr
- Down + closing
- —
- Monthly P&I
- —
- Monthly cashflow
- —
- DSCR
- —
- Eligible?
- —
Personal DTI + credit; lowest rate.
DSCR
20% down · 8.5% · 30yr
- Down + closing
- —
- Monthly P&I
- —
- Monthly cashflow
- —
- DSCR
- —
- Eligible?
- —
No personal income docs; deal must DSCR.
Hard money
10% down · 12.0% · 12mo
- Down + closing
- —
- Monthly P&I
- —
- Monthly cashflow
- —
- DSCR
- —
- Eligible?
- —
Short-term bridge; refi at stabilization.
Rent comps 15 comps
| Address | Beds | Baths | Sqft | Rent | $/sqft | DOM | Units | Dist |
|---|---|---|---|---|---|---|---|---|
| 445 Elevon Pkwy Unit 819 Nevada, TX | 2.0 | 2.0 | 1205 | $1,372 | $1.14 | 43d | 1 | 0.07mi |
| 445 Elevon Pkwy Lavon, TX | 1.0–3.0 | 1.0–2.0 | 1143 | $2,029 | $1.77 | 3d | 26 | 0.44mi |
| 544 Oak Creek Dr Lavon, TX | 4.0 | 2.0 | 1800 | $2,150 | $1.19 | 18d | 1 | 0.71mi |
| 455 Elevon Pkwy Lavon, TX | 1.0–3.0 | 1.0–2.0 | 1011 | $2,033 | $2.01 | 1d | 80 | 0.76mi |
| 600 Blooming Glade Lavon, TX | 3.0 | 2.0 | 1405 | $1,900 | $1.35 | 6d | 1 | 0.89mi |
| 849 Good Cheer Ln Lavon, TX | 3.0 | 2.0 | 1458 | $2,200 | $1.51 | 12d | 1 | 0.90mi |
| 906 Ramble Rd Lavon, TX | 3.0 | 2.0 | 1458 | $2,675 | $1.83 | 2d | 1 | 0.91mi |
| 918 Ramble Rd Lavon, TX | 3.0 | 2.0 | 1604 | $1,900 | $1.18 | 43d | 1 | 0.93mi |
| 579 White Water Dr Lavon, TX | 3.0 | 2.0 | 1838 | $2,000 | $1.09 | 24d | 1 | 1.11mi |
| 151 Villas Dr Lavon, TX | 3.0 | 1.0–3.0 | 871 | $2,345 | $2.69 | 1d | 108 | 1.24mi |
| 200 Villas Dr Lavon, TX | 1.0–2.0 | 1.0–2.0 | 873 | $1,918 | $2.20 | 1d | 5 | 1.27mi |
| 436 Grant Ln Lavon, TX | 3.0 | 2.0 | 1755 | $2,299 | $1.31 | 3d | 1 | 1.41mi |
| 590 Arthur Dr Lavon, TX | 3.0 | 2.0 | 1556 | $1,850 | $1.19 | 43d | 1 | 1.41mi |
| 476 Eisenhower Ln Lavon, TX | 3.0 | 2.0 | 1544 | $1,875 | $1.21 | 20d | 1 | 1.43mi |
| 471 Harding Ln Lavon, TX | 4.0 | 2.0 | 1645 | $1,950 | $1.19 | 43d | 1 | 1.48mi |
Listing history 20 events
-
2026-06-18days on market $261,990 Active 740 DOM
-
2026-06-17days on market $261,990 Active 739 DOM
-
2026-06-16days on market $261,990 Active 738 DOM
-
2026-06-15days on market $261,990 Active 737 DOM
-
2026-06-13days on market $261,990 Active 735 DOM
-
2026-06-13days on market $261,990 Active 734 DOM
-
2026-06-09days on market $261,990 Active 731 DOM
-
2026-06-08days on market $261,990 Active 730 DOM
-
2026-06-07days on market $261,990 Active 729 DOM
-
2026-06-04days on market $261,990 Active 726 DOM
-
2026-06-03days on market $261,990 Active 725 DOM
-
2026-06-02days on market $261,990 Active 724 DOM
-
2026-06-01days on market $261,990 Active 723 DOM
-
2026-05-31days on market $261,990 Active 722 DOM
-
2026-01-08price $261,990 303-char remark
Show marketing remark (303 chars)
The Primrose is one of M/I Homes' newest 30' Smart Series plans, offering the flexibility you are looking for in a new home design and providing the ease of style found in our Interior and Exterior Design packages. This plan delivers 3 bedrooms, 2 bathrooms, and 1,349-1,397 square feet of living space.
-
2025-10-23price $260,990 303-char remark
Show marketing remark (303 chars)
The Primrose is one of M/I Homes' newest 30' Smart Series plans, offering the flexibility you are looking for in a new home design and providing the ease of style found in our Interior and Exterior Design packages. This plan delivers 3 bedrooms, 2 bathrooms, and 1,349-1,397 square feet of living space.
-
2025-09-05price $259,990 303-char remark
Show marketing remark (303 chars)
The Primrose is one of M/I Homes' newest 30' Smart Series plans, offering the flexibility you are looking for in a new home design and providing the ease of style found in our Interior and Exterior Design packages. This plan delivers 3 bedrooms, 2 bathrooms, and 1,349-1,397 square feet of living space.
-
2025-03-21price $274,990 303-char remark
Show marketing remark (303 chars)
The Primrose is one of M/I Homes' newest 30' Smart Series plans, offering the flexibility you are looking for in a new home design and providing the ease of style found in our Interior and Exterior Design packages. This plan delivers 3 bedrooms, 2 bathrooms, and 1,349-1,397 square feet of living space.
-
2024-08-14price $289,990 303-char remark
Show marketing remark (303 chars)
The Primrose is one of M/I Homes' newest 30' Smart Series plans, offering the flexibility you are looking for in a new home design and providing the ease of style found in our Interior and Exterior Design packages. This plan delivers 3 bedrooms, 2 bathrooms, and 1,349-1,397 square feet of living space.
-
2024-06-08$299,990 Active 303-char remark
Show marketing remark (303 chars)
The Primrose is one of M/I Homes' newest 30' Smart Series plans, offering the flexibility you are looking for in a new home design and providing the ease of style found in our Interior and Exterior Design packages. This plan delivers 3 bedrooms, 2 bathrooms, and 1,349-1,397 square feet of living space.
ⓘ Source: listings_history table (triggers on properties + properties_extension) + one-shot
backfill from property_details.listing_events for pre-trigger history.
Nearby sold comps map
Loading sold comps map…
Walkable amenities ~0.75 mi
Loading nearby amenities…
Taxation est. · year 1
- Rental income
- $24,473
- − Mortgage interest
- −$17,638
- − Property taxes
- −$4,723
- − Insurance
- −$1,574
- − Repairs & maintenance
- −$1,958
- − Management
- −$1,958
- − Depreciation
- −$9,160
- Taxable loss
- −$12,538
- Est. tax savings @ 24.0%
- +$3,009
- After-tax cash flow
- $-3,770/yr
For passive investors: Depreciation is non-cash, so a rental often shows a tax loss while cash-flowing — sheltering income. Rental losses are passive: they offset passive income freely, and up to $25,000/yr can offset ordinary (W-2) income if you actively participate and your MAGI is under $100k (phasing out to $0 by $150k); unused losses carry forward. On sale, claimed depreciation is recaptured at up to 25%, and gains may owe capital-gains tax (a 1031 exchange can defer both). Figures are a year-1 estimate at your 24.0% rate — not tax advice; consult a CPA.
Schools (NCES district)
- District
- Community ISD
- NCES district ID
- 4814850
- Math proficiency
- 30% ▼ -23.00%
- Reading proficiency
- 38% ▼ -11.00%
- Median HH income
- $71,841
- Composite
- 31.58/100
- National rank
- #5951
- State rank
- #479 of 826 in TX
Livability — Lavon
- Score
- 66/100
- State rank
- #588
- US rank
- #11230
Category grades
Schools grade is shown separately in the Schools card above.
Census & demographics
- County
- Collin County · 1,159,394 people
- City population
- 6,989
- Metro
- Dallas-Fort Worth-Arlington, TX
- Population (ZIP)
- 6,989
- Household income
- $132,101
- Rent vs Own
- Severe rent burden
- 41.0
Population outlook (Collin County) Hauer SSP2
- Today (2025)
- 1,210,074 people
- By 2030
- 1,358,201 · +12.2%
- By 2040
- 1,654,061 · +36.7%
- By 2050
- 1,937,359 · +60.1%
- By 2075
- 2,567,039 · +112.1%
- By 2100
- 2,952,048 · +144.0%
Race, ethnicity, and origin ACS 2023
- Neighborhood character
- Diverse neighborhood (Simpson 0.63)
- Race & ethnicity
- White 55% Hispanic / Latino 24% Two or more races 15% Black 7% Asian 4% Native American 2% Pacific Islander 1%
- Hispanic origin (detail)
- Mexican 15% Puerto Rican 3%
- Common ancestry
- Slovak 2% Serbian 2% Lithuanian 2%
- Foreign-born
- 8% · Canada
- Languages at home
- 84% English-only · Spanish 11% Other Indo-European 3% Arabic 1%
Political lean MEDSL · Collin
- 2024 margin
- R (+11.1) · D 43.1% · R 54.3% · Other 2.6%
- 2008→2024 swing
- +14.4pp toward D · 2008: -25.6pp · 2024: -11.1pp
- All cycles
- 2024: R+11.1 2020: R+4.3 2016: R+17.0 2012: R+31.6 2008: R+25.6
Not yet ingested
- Civics
- —
Market trends
- HPI YoY
- ▼ -24.22%
- Current HPI
- 221.0
- Rent YoY
- —
- Metro
- Dallas-Fort Worth-Arlington, TX
- State GDP YoY
- ▲ 3.95%
- F500 in state
- 110
Industry mix (Fortune 500 HQ in TX)
| Industry | F500 HQs | Revenue |
|---|---|---|
| Energy | 16 | $1,198B |
|
||
| Technology | 5 | $198B |
|
||
| Engineering / Construction | 4 | $72B |
|
||
| Energy Services | 3 | $60B |
|
||
| Utilities | 3 | $41B |
|
||
| Healthcare | 2 | $330B |
|
||
Price history
-12.7% since first listed6 events — show timeline
- 2026-01-08 Price Changed $261,990 Zillow
- 2025-10-23 Price Changed $260,990 Zillow
- 2025-09-05 Price Changed $259,990 Zillow
- 2025-03-21 Price Changed $274,990 Zillow
- 2024-08-14 Price Changed $289,990 Zillow
- 2024-06-08 Listed $299,990 Zillow
Cash-flow waterfall
monthlySold comps — $/sqft
last 12 mo · ≤1 miLoading sold comps…