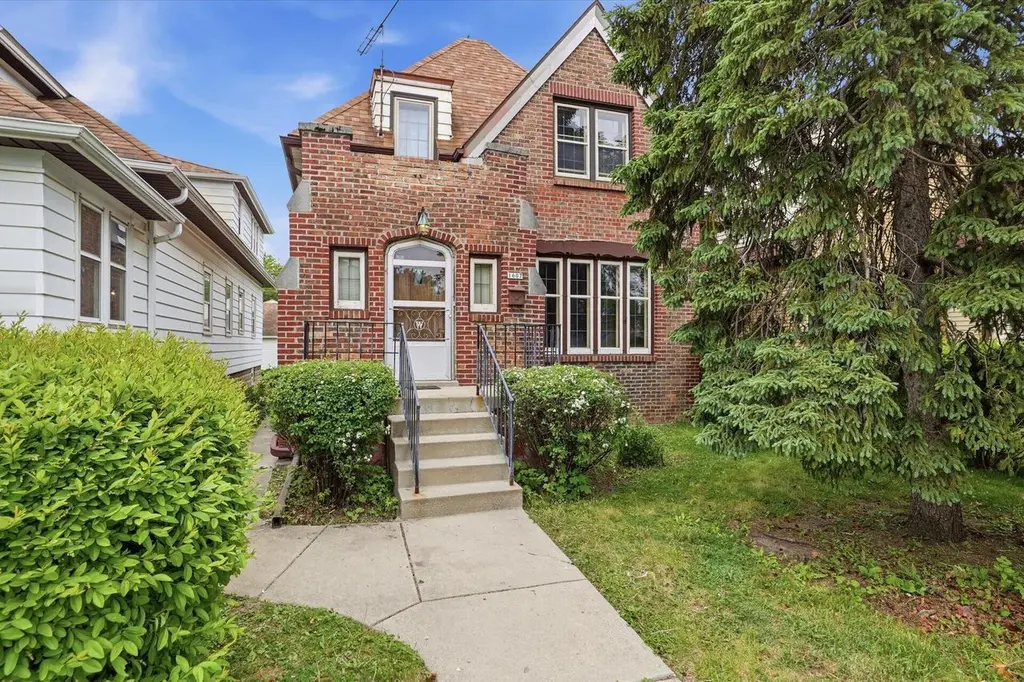
1607 S 55th St · West Milwaukee, WI
Flood risk 1/10 · Minimal
- FEMA flood zone
- X (unshaded)
- Chance of flooding over 30 yrs
- 0.0%
- Est. flood insurance / yr
- $473 – $860
Fire risk 1/10 · Minimal
- Est. fire insurance / yr
- $636 – $1,182
Heat risk 2/10 · Minimal
- Hot days now (above 99°F)
- 7 days/yr
- Hot days in 30 yrs
- 13 days/yr
Wind risk 2/10 · Minimal
- Chance of severe wind over 30 yrs
- —
Air-quality risk 2/10 · Minimal
- Unhealthy air days now
- 1 days/yr
- Unhealthy air days in 30 yrs
- 1 days/yr
Risk factors via First Street. Map © Google.
Why this score? — see what drove the D+ grade
The composite is a weighted blend of 9 inputs, each scored 0–100. Each bar is that input's sub-score; the figure is the points it added to the 100-point composite (weight × sub-score).
- ARV discount +15.0/15.0
- Cash flow +13.8/30.0
- Rent growth +4.6/5.0
- DSCR +4.2/10.0
- Livability +4.0/5.0
- 1% rule +3.9/10.0
- Condition / age +2.5/5.0
- Schools +1.9/10.0
- Appreciation +0.0/10.0
$199,900
🖨 Deal sheet 📄 Offer letter ✓ Due diligence
Listing remarks
Owner has lived in home for 96 YEARS! ONE OWNER!Did not want to leave. This home is a spacious well preserved and cared for. Home in need of updating & repair. Hardwood floors throughout. Enormous LR with open staircase FAUX FP (AI added a flame), large DR with BICC. Large kitchen. There is not a bath on main level. Full bath on upper. Three very spacious bedrooms on upper. Airing porch off of primary is in disrepair and locked. One car garage is usable but rough. New furnace in Dec 2025. Tons of potential for DIY or investor.
Key facts
- Enormous lr
- One car garage
- Large kitchen
Tags
Property features AI
Finance
- Other: - Zoned residential
Neighborhood map
What this means for you Summary
Snapshot
- This is a 3-bed/1.5-bath single-family listed at $200k.
Deal economics
- At list price, monthly cash flow is $17 ($206/yr) — positive.
- The deal already cash-flows at list — no discount required.
- To meet the 1% rule (rent ≥ 1% of price), the offer needs to be $177k (11.3% below list).
- Recommended offer: $177k (11.3% below list) — sets the bar for 1% rule.
Location & tenants
- Location reads 80/100 on livability (#73 in WI, #1,964 nationally) — a professional / high-income tenant draw. Strengths: commute A+, cost of living A+, health & safety A+; Watch: schools D-, crime F, employment D-.
- West Allis-West Milwaukee School District (urban): math 17% / reading 26% proficiency, ranked #328 of 342 in WI (top 96%) — low school quality limits family demand, transient renter base, plan for 1-2y turnover.
- Market conditions: Rents rising fast (+8.3%/yr); 55 active listings in the ZIP; 15 comparable units currently listed for rent nearby; rentals at typical pace (median 17d on market — plan ~3-4 weeks tenant-placement turnaround); 1,017 units permitted in Milwaukee County in 2024 (803 in 5+ unit buildings).
- This rent runs 35% of the median local income ($61k/yr) — at the standard rent-burdened threshold; future hikes will face affordability resistance.
Forward outlook
- Local home prices are declining (-3.0%/yr); year-one equity from $1k of loan paydown is wiped out by about $6k of value loss. Plan a longer hold.
- Milwaukee County population projected at +4% by 2050 — modest demand growth; plan on rents tracking national, not racing it.
Negotiation context
- Only 2 days on market — expect competitive offers; lowballing is unlikely to land.
Risks & watch-outs
- Watch-outs: built in 1930 — expect roof / HVAC / electrical / plumbing capex.
Questions for the listing agent
- Built in 1930 — when were the roof, HVAC, electrical panel, plumbing, and water heater last replaced?
- Is there a deadline driving the sale (1031 exchange, divorce, estate, relocation)? That informs how much negotiation room exists.
- Schools are D-rated, which usually means shorter tenancies and higher turnover. Who's the typical renter profile here, and what's been the actual vacancy rate?
- Crime grade is F in this area — have there been break-ins, vandalism, or insurance claims at this property in the last 3 years? What carrier currently insures it and at what premium?
- The area grade is low — what's the realistic commute time and amenity access for the typical tenant pool here? Any planned neighborhood developments (good or bad) we should know about?
- What's the average days-on-market for RENTAL listings here right now (not sales)? A rising rental-DOM trend means longer vacancies and softer asking-rent achievability than the comps imply.
- What's the recent tenant-quality profile in this submarket — average credit score on applications, eviction rate, late-payment / NSF rate, and stable-employment percentage? A property-management company in the area should have these aggregated.
- How much new for-sale + rental construction is in the pipeline within 1–3 miles? Heavy new supply typically softens prices + rents 12–24 months out; constrained supply supports both.
Investment metrics
- 1% rule
- 0.89% ✗
- Cap rate
- 6.40%
- Cash-on-cash
- 0.37%
- DSCR
- 1.02
- GRM
- 9.4
CMA / ARV
- ARV (on-the-fly)
- $279,350
- Comps found
- 12
Show comp detail 12 sales within ~0.75 mi
| Address | Dist | Beds/Ba | Sqft | Sold | Price | $/sf | Match |
|---|---|---|---|---|---|---|---|
| 1607 S 55th St | 0.00mi | 3/1.5 | 1,510 (0%) | 0mo | $185,000 | $123 | 100 |
| 1717 S 56th St | 0.15mi | 3/1.0 | 1,401 (-7%) | 2mo | $245,000 | $175 | 78 |
| 5529 W Rogers St | 0.39mi | 3/2.0 | 1,550 (+3%) | 4mo | $287,500 | $185 | 72 |
| 1708 S 53rd St | 0.19mi | 4/2.5 (+1) | 1,410 (-7%) | 1mo | $355,000 | $252 | 70 |
| 1537 S 56th St | 0.10mi | 4/1.5 (+1) | 1,288 (-15%) | 7mo | $307,000 | $238 | 60 |
| 2051 S 55th St | 0.45mi | 3/1.0 | 1,672 (+11%) | 0mo | $235,000 | $141 | 59 |
| 2101 S 60th St | 0.57mi | 3/2.0 | 1,422 (-6%) | 5mo | $185,000 | $130 | 58 |
| 1136 S 57th St | 0.39mi | 4/2.0 (+1) | 1,379 (-9%) | 4mo | $280,001 | $203 | 57 |
| 2214 S 60th St | 0.71mi | 3/1.0 | 1,564 (+4%) | 4mo | $335,000 | $214 | 56 |
| 1203 S 49th St | 0.48mi | 4/1.5 (+1) | 1,391 (-8%) | 5mo | $252,000 | $181 | 56 |
| 1114 S 47th St | 0.61mi | 4/2.0 (+1) | 1,434 (-5%) | 2mo | $320,000 | $223 | 54 |
| 821 S 57th St | 0.66mi | 4/1.0 (+1) | 1,450 (-4%) | 8mo | $250,000 | $172 | 49 |
Match score weights: distance 35% · size 25% · config 20% · recency 20%. Top-matched comps best support the ARV.
Projected returns pro-forma
-3.0% appreciation · 8.0% rent growth · sell at horizon
- IRR
- -10.2%
- Equity multiple
- 0.61×
- Total profit
- $-21,894
- Equity at exit
- $29,806
- IRR
- 5.0%
- Equity multiple
- 1.45×
- Total profit
- $25,132
- Equity at exit
- $17,284
Cash invested: $55,972 (down + closing). Projections, not guarantees.
Landlord ↔ Tenant lean methodology
- Overall (STATE)
- 73 Landlord-Friendly
- State Wisconsin
- 73 Landlord-Friendly · R+2
- County
- — inherits STATE
- City
- — inherits STATE
ZIP-level market 53214
- Home prices YoY
- -28.9%
- Rents YoY
- 8.3%
- Active inventory
- 55
- Price-to-rent
- 9.4×
Monthly cashflow live
- Estimated rent
- $1,774 high interval (Pro) →
- Mortgage (P&I)
- −$1,048
- Tax from tax record
- −$253 /mo · $3,032/yr
- Insurance
- −$83
- HOA
- −$0
- Vacancy / Maint / Mgmt
- −$373
- Net cashflow
- $17
Break-even live
UW: 25.0% down · 7.5% · 30yr · 1.5% tax · 5.0% vac · 8.0% maint · 8.0% mgmt
Financing live
Cash to close
- Down payment
- $49,975
- Closing costs
- $5,997
- Reserves months
- —
- Total cash needed
- —
Loan-product check · same deal, 3 products live
Conventional
25% down · 7.5% · 30yr
- Down + closing
- —
- Monthly P&I
- —
- Monthly cashflow
- —
- DSCR
- —
- Eligible?
- —
Personal DTI + credit; lowest rate.
DSCR
20% down · 8.5% · 30yr
- Down + closing
- —
- Monthly P&I
- —
- Monthly cashflow
- —
- DSCR
- —
- Eligible?
- —
No personal income docs; deal must DSCR.
Hard money
10% down · 12.0% · 12mo
- Down + closing
- —
- Monthly P&I
- —
- Monthly cashflow
- —
- DSCR
- —
- Eligible?
- —
Short-term bridge; refi at stabilization.
Rent comps 15 comps
| Address | Beds | Baths | Sqft | Rent | $/sqft | DOM | Units | Dist |
|---|---|---|---|---|---|---|---|---|
| 1301 S 63rd St Uppr -6307 West Allis, WI | 3.0 | 1.0 | 1150 | $1,650 | $1.43 | 23d | 1 | 0.55mi |
| 6516 W National Ave Unit 1441-105 West Allis, WI | 2.0 | 2.0 | 1143 | $1,745 | $1.53 | 23d | 1 | 0.60mi |
| 6516 W National Ave Unit 6519-101 West Allis, WI | 2.0 | 2.0 | 1204 | $1,945 | $1.62 | 16d | 1 | 0.60mi |
| 6516 W National Ave Unit 1460-110 West Allis, WI | 2.0 | 1.0 | 1080 | $1,815 | $1.68 | 16d | 1 | 0.60mi |
| 6516 W National Ave Unit 6501-209 West Allis, WI | 2.0 | 2.0 | 1150 | $1,695 | $1.47 | 3d | 1 | 0.60mi |
| 6516 W National Ave Unit 1441-309 West Allis, WI | 2.0 | 2.0 | 1150 | $1,575 | $1.37 | 21d | 1 | 0.60mi |
| 6516 W National Ave Unit 1460-102 West Allis, WI | 2.0 | 2.0 | 1143 | $1,775 | $1.55 | 3d | 1 | 0.60mi |
| 6516 W National Ave Unit 6501-310 West Allis, WI | 2.0 | 2.0 | 1289 | $1,995 | $1.55 | 23d | 1 | 0.60mi |
| 6516 W National Ave Unit 6501-212 West Allis, WI | 2.0 | 2.0 | 1204 | $1,945 | $1.62 | 23d | 1 | 0.60mi |
| 2329 S 51st St Unit 2349 204 Milwaukee, WI | 2.0 | 2.0 | 1060 | $1,395 | $1.32 | 4d | 1 | 0.84mi |
| 2329 S 51st St Unit 2359 202 Milwaukee, WI | 2.0 | 2.0 | 1100 | $1,350 | $1.23 | 43d | 1 | 0.84mi |
| 642 S 66th St Milwaukee, WI | 3.0 | 1.0 | 1059 | $1,770 | $1.67 | 17d | 1 | 1.00mi |
| 638 S 66th St Milwaukee, WI | 3.0 | 1.0 | 1104 | $1,795 | $1.63 | 14d | 1 | 1.00mi |
| 2122 S 77th St Milwaukee, WI | 4.0 | 1.5 | 1434 | $1,895 | $1.32 | 14d | 1 | 1.45mi |
| 2640 S 69th St #2642 Milwaukee, WI | 2.0 | 1.0 | 1200 | $1,549 | $1.29 | 43d | 1 | 1.48mi |
Listing history 2 events
-
2026-05-31status $199,900 Pending 2 DOM
-
2026-05-28$199,900 Active
ⓘ Source: listings_history table (triggers on properties + properties_extension) + one-shot
backfill from property_details.listing_events for pre-trigger history.
Tax reassessment forecast WI · Partial reset (capped growth)
- Current annual tax
- $3,032 · $253/mo
- Projected year-2 tax
- $3,365 · $280/mo
- Expected delta
- +$333/yr (+$28/mo · 11.0%)
ⓘ Screening estimate from a state-policy table — verify with the county assessor before closing.
Climate risk First Street
- Flood 1/10 Low FEMA zone X (unshaded) · 0% chance over 30 yrs
- Wildfire 1/10 Low
- Heat 2/10 Low 7 d/yr ≥99°F today · 13 d/yr by 30 yrs out
- Wind 2/10 Low
- Air quality 2/10 Low 1 unhealthy d/yr today · 1 by 30 yrs out
Nearby sold comps map
Loading sold comps map…
Walkable amenities ~0.75 mi
Loading nearby amenities…
Taxation est. · year 1
- Rental income
- $21,288
- − Mortgage interest
- −$11,198
- − Property taxes
- −$3,032
- − Insurance
- −$1,000
- − Repairs & maintenance
- −$1,703
- − Management
- −$1,703
- − Depreciation
- −$5,815
- Taxable loss
- −$3,163
- Est. tax savings @ 24.0%
- +$759
- After-tax cash flow
- $965/yr
For passive investors: Depreciation is non-cash, so a rental often shows a tax loss while cash-flowing — sheltering income. Rental losses are passive: they offset passive income freely, and up to $25,000/yr can offset ordinary (W-2) income if you actively participate and your MAGI is under $100k (phasing out to $0 by $150k); unused losses carry forward. On sale, claimed depreciation is recaptured at up to 25%, and gains may owe capital-gains tax (a 1031 exchange can defer both). Figures are a year-1 estimate at your 24.0% rate — not tax advice; consult a CPA.
Schools (NCES district)
- District
- West Allis-West Milwaukee School District
- NCES district ID
- 5516260
- Math proficiency
- 17% ▼ -16.00%
- Reading proficiency
- 26% ▼ -12.00%
- Median HH income
- $45,620
- Composite
- 18.71/100
- National rank
- #8881
- State rank
- #328 of 342 in WI
Livability — West Milwaukee
- Score
- 80/100
- State rank
- #73
- US rank
- #1964
Category grades
Schools grade is shown separately in the Schools card above.
Census & demographics
- Census place
- West Milwaukee, WI
- County
- Milwaukee County · 926,379 people
- Metro
- Milwaukee-Waukesha, WI
- Population (ZIP)
- 34,480
- Household income
- $60,962
- Rent vs Own
- Severe rent burden
- 1377.0
Population outlook (Milwaukee County) Hauer SSP2
- Today (2025)
- 995,758 people
- By 2030
- 1,009,124 · +1.3%
- By 2040
- 1,028,128 · +3.3%
- By 2050
- 1,040,066 · +4.4%
- By 2075
- 1,057,849 · +6.2%
- By 2100
- 1,039,774 · +4.4%
Race, ethnicity, and origin ACS 2023
- Neighborhood character
- Predominantly White (66%)
- Race & ethnicity
- White 66% Hispanic / Latino 18% Two or more races 12% Black 7% Asian 3%
- Hispanic origin (detail)
- Mexican 12% Puerto Rican 4%
- Common ancestry
- Romanian 11% Lithuanian 3% Portuguese 2%
- Foreign-born
- 7% · Canada, China, Philippines
- Languages at home
- 86% English-only · Spanish 10% Other Asian/Pacific 1% Russian/Polish/Slavic 1%
Political lean MEDSL · Milwaukee
- 2024 margin
- Solid D (+38.5) · D 68.3% · R 29.8% · Other 1.8%
- 2008→2024 swing
- +2.7pp toward D · 2008: 35.9pp · 2024: 38.5pp
- All cycles
- 2024: D+38.5 2020: D+39.9 2016: D+37.5 2012: D+34.6 2008: D+35.9
Not yet ingested
- Civics
- —
Market trends
- HPI YoY
- ▼ -112.31%
- Current HPI
- 276.0476
- Rent YoY
- ▲ 8.30%
- Metro
- Milwaukee-Waukesha, WI
- State GDP YoY
- ▲ 2.10%
- F500 in state
- 20
Industry mix (Fortune 500 HQ in WI)
| Industry | F500 HQs | Revenue |
|---|---|---|
| Industrial Machinery | 4 | $23B |
|
||
| Industrial Technology | 2 | $36B |
|
||
| Insurance | 1 | $36B |
|
||
| Professional Services | 1 | $19B |
|
||
| Utilities | 1 | $9B |
|
||
| Consumer Goods | 1 | $3B |
|
||
Price history
1 event — show timeline
- 2026-05-28 Listed $199,900 METROMLS
Property tax history
-3.2%/yrLatest (2024): $3,032 · +24.7% YoY. Source: county tax records.
Cash-flow waterfall
monthlySold comps — $/sqft
last 12 mo · ≤1 miLoading sold comps…