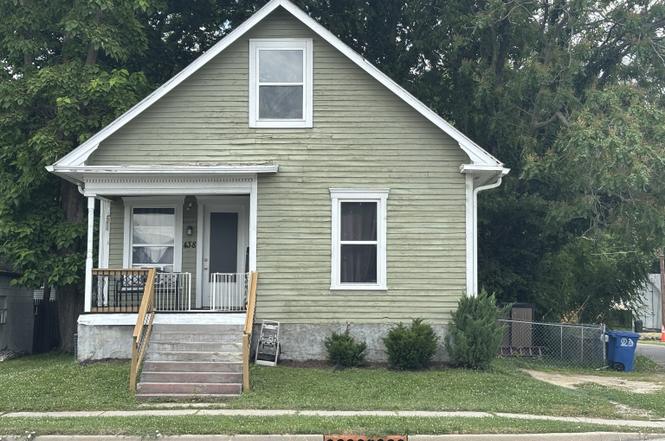
438 Colescott St · Shelbyville, IN
Flood risk 1/10 · Minimal
- FEMA flood zone
- X (unshaded)
- Chance of flooding over 30 yrs
- 0.0%
- Est. flood insurance / yr
- $473 – $860
Fire risk 1/10 · Minimal
- Est. fire insurance / yr
- $717 – $1,331
Heat risk 4/10 · Minor
- Hot days now (above 102°F)
- 7 days/yr
- Hot days in 30 yrs
- 19 days/yr
Wind risk 2/10 · Minimal
- Chance of severe wind over 30 yrs
- 1.0%
Air-quality risk 2/10 · Minimal
- Unhealthy air days now
- 1 days/yr
- Unhealthy air days in 30 yrs
- 2 days/yr
Risk factors via First Street. Map © Google.
Why this score? — see what drove the C grade
The composite is a weighted blend of 9 inputs, each scored 0–100. Each bar is that input's sub-score; the figure is the points it added to the 100-point composite (weight × sub-score).
- Cash flow +23.7/30.0
- ARV discount +9.5/15.0
- DSCR +7.6/10.0
- 1% rule +4.9/10.0
- Schools +3.4/10.0
- Livability +3.2/5.0
- Rent growth +2.5/5.0
- Condition / age +2.5/5.0
- Appreciation +0.0/10.0
$159,900
🖨 Deal sheet (PDF) 📄 Offer letter ✓ Due diligence
Listing remarks MLS
Completely updated 3 bedroom 2 bath home for just under $100,000. As you walk up to your new house, you are welcomed by new porch and outdoor carpeting. As you walk through the front door, you will notice all new carpet, tall ceilings with fresh paint, and painted trim. The living room and eat-in kitchen have an open concept. The kitchen has been updated and has long window bench with black stainless steel appliances and new flooring. Off the kitchen leads you to back entrance with new door and also down to the basement. As you walk upstairs you will notice the wooden handrail with iron spindles. Two more bedrooms upstairs with their own bath. The master is on main level with it's own big suite bathroom. Too many updates to list.
Key facts
- Delightful porch
- 2,585 sq ft lot
- Built 1930
Tags
Property features AI
Finance
- HOA & community: Not a low-maintenance lifestyle community
Exterior
- Utilities: Public water; Municipal sewer connected
- Home design: Single family residence; Two levels
- Construction: Wood siding; Cellar foundation
- Exterior features: Lot under 1/4 acre (approximately 0.06 acre)
Interior
- Kitchen: Dishwasher; Electric oven; Refrigerator
- Bedrooms: Three bedrooms total — one on the main level and two on the upper level; Primary bedroom: see remarks
- Bathrooms: Two full bathrooms (one on main level, one on upper level); Primary bathroom includes a full tub
- Heating & cooling: Natural gas heating; Central air conditioning
- Interior features: Eat-in kitchen; Finished basement (cellar)
- Laundry & utility: No specific laundry details provided
Neighborhood map
What this means for you Summary
Snapshot
- This is a 3-bed/2.0-bath single-family listed at $160k.
Deal economics
- At list price, monthly cash flow is $305 ($4k/yr) — positive.
- The deal already cash-flows at list — no discount required.
- To meet the 1% rule (rent ≥ 1% of price), the offer needs to be $158k (1.0% below list).
- Recommended offer: $158k (1.0% below list) — sets the bar for 1% rule.
- Cap rate 8.6% vs local median 4.0% in Shelbyville — top-decile yield for the area; either an underpriced asset or a hidden risk that comps aren't pricing in. Stress-test before assuming the spread holds.
Location & tenants
- Location reads 63/100 on livability (#450 in IN) — a middle-class / working-renter tenant base. Strengths: cost of living A+, housing A+, crime B; Watch: employment C-, schools D+, amenities F.
- Shelbyville Central Schools (town): math 40% / reading 39% proficiency, ranked #148 of 301 in IN (top 49%) — families likely to look elsewhere, expect single-tenant / working-renter base with shorter leases.
- Market conditions: 238 active listings in the ZIP; 3 comparable units currently listed for rent nearby; rentals at typical pace (median 23d on market — plan ~3-4 weeks tenant-placement turnaround); 285 units permitted in Shelby County in 2024 (147 in 5+ unit buildings).
Forward outlook
- Local home prices are declining (-3.0%/yr); year-one equity from $1k of loan paydown is wiped out by about $5k of value loss. Plan a longer hold.
- Shelby County population projected to shrink 6% by 2050 — rents likely to lag national; underwrite the cash flow, not the appreciation.
Negotiation context
- Only 11 days on market — expect competitive offers; lowballing is unlikely to land.
- 3 sale attempts since 8y ago with the ask held roughly flat each time — persistent listings suggest the price (not the market) is what's stuck; bring a comps-based counter.
- Current owner paid $102k; list at $160k implies a 57% gain — meaningful room to come down on a strong offer.
Risks & watch-outs
- Watch-outs: built in 1930 — expect roof / HVAC / electrical / plumbing capex.
Questions for the listing agent
- Built in 1930 — when were the roof, HVAC, electrical panel, plumbing, and water heater last replaced?
- Is there a deadline driving the sale (1031 exchange, divorce, estate, relocation)? That informs how much negotiation room exists.
- Schools are D-rated, which usually means shorter tenancies and higher turnover. Who's the typical renter profile here, and what's been the actual vacancy rate?
- What's the average days-on-market for RENTAL listings here right now (not sales)? A rising rental-DOM trend means longer vacancies and softer asking-rent achievability than the comps imply.
- What's the recent tenant-quality profile in this submarket — average credit score on applications, eviction rate, late-payment / NSF rate, and stable-employment percentage? A property-management company in the area should have these aggregated.
- How much new for-sale + rental construction is in the pipeline within 1–3 miles? Heavy new supply typically softens prices + rents 12–24 months out; constrained supply supports both.
Investment metrics
- 1% rule
- 0.99% ✗
- Cap rate
- 8.58%
- Cash-on-cash
- 8.16%
- DSCR
- 1.36
- GRM
- 8.4
CMA / ARV
- ARV (on-the-fly)
- $167,505
- Comps found
- 12
Show comp detail 12 sales within ~0.75 mi
| Address | Dist | Beds/Ba | Sqft | Sold | Price | $/sf | Match |
|---|---|---|---|---|---|---|---|
| 315 W South St | 0.15mi | 2/1.0 (-1) | 856 (-0%) | 5mo | $163,000 | $190 | 80 |
| 429 Colescott St | 0.03mi | 3/1.0 | 938 (+9%) | 10mo | $193,500 | $206 | 71 |
| 21 Mildred St | 0.52mi | 3/1.0 | 912 (+6%) | 2mo | $145,000 | $159 | 60 |
| 734 5th St | 0.37mi | 2/1.0 (-1) | 931 (+8%) | 0mo | $182,000 | $195 | 59 |
| 825 Moriseni St | 0.32mi | 2/1.0 (-1) | 768 (-11%) | 1mo | $50,000 | $65 | 58 |
| 725 2nd St | 0.24mi | 2/1.0 (-1) | 929 (+8%) | 11mo | $157,000 | $169 | 57 |
| 252 W South St | 0.20mi | 3/1.5 | 952 (+11%) | 20mo | $111,000 | $117 | 54 |
| 304 Sunset Dr | 0.73mi | 2/1.0 (-1) | 864 (+1%) | 6mo | $183,000 | $212 | 51 |
| 1222 Lincoln St | 0.47mi | 2/1.0 (-1) | 750 (-13%) | 1mo | $154,900 | $207 | 47 |
| 709 Center St | 0.48mi | 2/1.0 (-1) | 799 (-7%) | 14mo | $159,900 | $200 | 45 |
| 320 Sunset Dr | 0.73mi | 2/1.0 (-1) | 768 (-11%) | 9mo | $130,000 | $169 | 32 |
| 625 9th St | 0.73mi | 2/1.0 (-1) | 768 (-11%) | 20mo | $159,900 | $208 | 23 |
Match score weights: distance 35% · size 25% · config 20% · recency 20%. Top-matched comps best support the ARV.
Projected returns pro-forma
-3.0% appreciation · 3.0% rent growth · sell at horizon
- IRR
- -3.9%
- Equity multiple
- 0.85×
- Total profit
- $-6,585
- Equity at exit
- $23,842
- IRR
- 5.7%
- Equity multiple
- 1.42×
- Total profit
- $18,947
- Equity at exit
- $13,825
Cash invested: $44,772 (down + closing). Projections, not guarantees.
Landlord ↔ Tenant lean methodology
- Overall (STATE)
- 90 Strongly Landlord-Friendly
- State Indiana
- 90 Strongly Landlord-Friendly · R+11
- County
- — inherits STATE
- City
- — inherits STATE
ZIP-level market 46176
- Home prices YoY
- -33.9%
- Active inventory
- 238
- Price-to-rent
- 8.4×
Monthly cashflow live
- Estimated rent
- $1,584 medium interval (Pro) →
- Mortgage (P&I)
- −$839
- Tax from tax record
- −$41 /mo · $497/yr
- Insurance
- −$67
- HOA
- −$0
- Vacancy / Maint / Mgmt
- −$333
- Net cashflow
- $305
Break-even live
Sensitivity live
| Price | -10% $395 | -5% $350 | +0% $305 | +5% $259 | +10% $214 |
|---|---|---|---|---|---|
| Rent | -10% $179 | -5% $242 | +0% $305 | +5% $367 | +10% $430 |
| Rate | -1.0pp $385 | -0.5pp $345 | base $305 | +0.5pp $263 | +1.0pp $221 |
UW: 25.0% down · 7.5% · 30yr · 1.5% tax · 5.0% vac · 8.0% maint · 8.0% mgmt
Financing live
Cash to close
- Down payment
- $39,975
- Closing costs
- $4,797
- Reserves months
- —
- Total cash needed
- —
Loan-product check · same deal, 3 products live
Conventional
25% down · 7.5% · 30yr
- Down + closing
- —
- Monthly P&I
- —
- Monthly cashflow
- —
- DSCR
- —
- Eligible?
- —
Personal DTI + credit; lowest rate.
DSCR
20% down · 8.5% · 30yr
- Down + closing
- —
- Monthly P&I
- —
- Monthly cashflow
- —
- DSCR
- —
- Eligible?
- —
No personal income docs; deal must DSCR.
Hard money
10% down · 12.0% · 12mo
- Down + closing
- —
- Monthly P&I
- —
- Monthly cashflow
- —
- DSCR
- —
- Eligible?
- —
Short-term bridge; refi at stabilization.
Rent comps 3 comps
| Address | Beds | Baths | Sqft | Rent | $/sqft | DOM | Units | Dist |
|---|---|---|---|---|---|---|---|---|
| 425 N Harrison St Shelbyville, IN | 1.0–3.0 | 1.0–2.0 | 987 | $1,882 | $1.91 | 0d | 5 | 0.74mi |
| 348 E Franklin St Shelbyville, IN | 2.0 | 1.0 | 934 | $1,295 | $1.39 | 23d | 1 | 0.92mi |
| 713 Indiana Ave Shelbyville, IN | 2.0 | 1.0 | 1077 | $1,100 | $1.02 | 45d | 1 | 1.10mi |
Listing history 8 events
-
2026-06-21days on market $159,900 Active 11 DOM
-
2026-06-18days on market $159,900 Active 8 DOM
-
2026-06-17days on market $159,900 Active 7 DOM
-
2026-06-16days on market $159,900 Active 6 DOM
-
2026-06-15days on market $159,900 Active 5 DOM
-
2026-06-13days on market $159,900 Active 3 DOM
-
2026-06-13remarks 699-char remark
-
2026-06-13$159,900 Active 2 DOM
ⓘ Source: listings_history table (triggers on properties + properties_extension) + one-shot
backfill from property_details.listing_events for pre-trigger history.
Tax reassessment forecast IN · Partial reset (capped growth)
- Current annual tax
- $497 · $41/mo
- Projected year-2 tax
- $928 · $77/mo
- Expected delta
- +$431/yr (+$36/mo · 86.6%)
ⓘ Screening estimate from a state-policy table — verify with the county assessor before closing.
Climate risk First Street
- Flood 1/10 Low FEMA zone X (unshaded) · 0% chance over 30 yrs
- Wildfire 1/10 Low
- Heat 4/10 Moderate 7 d/yr ≥102°F today · 19 d/yr by 30 yrs out
- Wind 2/10 Low 100% chance of damaging wind over 30 yrs
- Air quality 2/10 Low 1 unhealthy d/yr today · 2 by 30 yrs out
Nearby sold comps map
Loading sold comps map…
Walkable amenities ~0.75 mi
Loading nearby amenities…
Taxation est. · year 1
- Rental income
- $19,005
- − Mortgage interest
- −$8,957
- − Property taxes
- −$497
- − Insurance
- −$800
- − Repairs & maintenance
- −$1,520
- − Management
- −$1,520
- − Depreciation
- −$4,652
- Taxable income
- $1,059
- Est. tax owed @ 24.0%
- −$254
- After-tax cash flow
- $3,401/yr
For passive investors: Depreciation is non-cash, so a rental often shows a tax loss while cash-flowing — sheltering income. Rental losses are passive: they offset passive income freely, and up to $25,000/yr can offset ordinary (W-2) income if you actively participate and your MAGI is under $100k (phasing out to $0 by $150k); unused losses carry forward. On sale, claimed depreciation is recaptured at up to 25%, and gains may owe capital-gains tax (a 1031 exchange can defer both). Figures are a year-1 estimate at your 24.0% rate — not tax advice; consult a CPA.
Schools (NCES district)
- District
- Shelbyville Central Schools
- NCES district ID
- 1810140
- Math proficiency
- 40% ▼ -10.00%
- Reading proficiency
- 39% ▼ -9.00%
- Median HH income
- $45,199
- Composite
- 33.63/100
- National rank
- #5402
- State rank
- #148 of 301 in IN
Livability — Shelbyville
- Score
- 63/100
- State rank
- #450
- US rank
- #16051
Category grades
Schools grade is shown separately in the Schools card above.
Census & demographics
- Census place
- Shelbyville, IN
- County
- Shelby County · 28,782 people
- City population
- 28,782
- Metro
- Indianapolis-Carmel-Anderson, IN
- Population (ZIP)
- 28,782
- Household income
- $65,182
- Rent vs Own
- Severe rent burden
- 921.0
Population outlook (Shelby County) Hauer SSP2
- Today (2025)
- 45,020 people
- By 2030
- 44,962 · -0.1%
- By 2040
- 44,126 · -2.0%
- By 2050
- 42,110 · -6.5%
- By 2075
- 37,131 · -17.5%
- By 2100
- 29,714 · -34.0%
Race, ethnicity, and origin ACS 2023
- Neighborhood character
- Predominantly White (88%)
- Race & ethnicity
- White 88% Hispanic / Latino 7% Two or more races 4% Black 2% Asian 1%
- Hispanic origin (detail)
- Mexican 5%
- Common ancestry
- Italian 2% Slovak 1% Lithuanian 1%
- Foreign-born
- 5% · Canada
- Languages at home
- 92% English-only · Spanish 5% German/W. Germanic 1% Other Asian/Pacific 1%
Political lean MEDSL · Shelby
- 2024 margin
- Solid R (+48.0) · D 25.1% · R 73.1% · Other 1.8%
- 2008→2024 swing
- -29.0pp toward R · 2008: -19.0pp · 2024: -48.0pp
- All cycles
- 2024: R+48.0 2020: R+47.7 2016: R+47.2 2012: R+33.5 2008: R+19.0
Not yet ingested
- Civics
- —
Market trends
- HPI YoY
- ▼ -116.59%
- Current HPI
- 227.6747
- Rent YoY
- —
- Metro
- Indianapolis-Carmel-Anderson, IN
- State GDP YoY
- ▲ 2.90%
- F500 in state
- 18
Industry mix (Fortune 500 HQ in IN)
| Industry | F500 HQs | Revenue |
|---|---|---|
| Industrial Machinery | 2 | $37B |
|
||
| Healthcare | 1 | $177B |
|
||
| Pharmaceuticals | 1 | $45B |
|
||
| Metals / Steel | 1 | $18B |
|
||
| Agriculture | 1 | $17B |
|
||
| Packaging | 1 | $12B |
|
||
Price history
+453.3% since first listed8 events — show timeline
- 2026-06-10 Listed $159,900 MIBOR as Distributed by MLS Grid
- 2019-06-21 Sold (MLS) $102,000 MIBOR as Distributed by MLS Grid
- 2019-05-28 Pending — MIBOR as Distributed by MLS Grid
- 2019-05-20 Price Changed $99,900 MIBOR as Distributed by MLS Grid
- 2019-05-11 Listed $105,000 MIBOR as Distributed by MLS Grid
- 2018-06-22 Sold (MLS) $18,000 MIBOR as Distributed by MLS Grid
- 2018-06-13 Pending — MIBOR as Distributed by MLS Grid
- 2018-05-31 Listed $28,900 MIBOR as Distributed by MLS Grid
Property tax history
+7.0%/yrLatest (2025): $497 · -6.7% YoY. Source: county tax records.
Cash-flow waterfall
monthlySold comps — $/sqft
last 12 mo · ≤1 miLoading sold comps…