 🔨 Auction
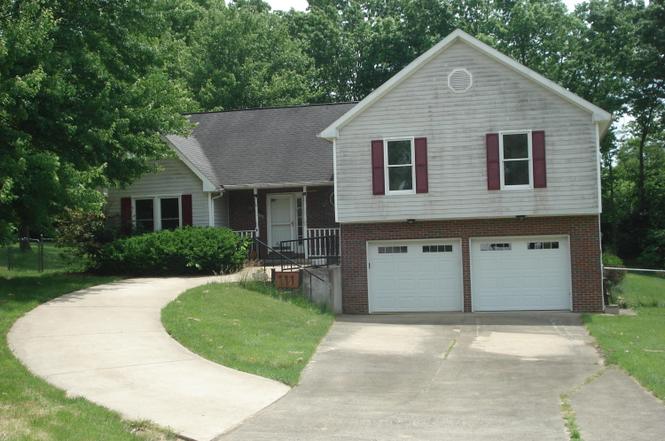
111 Sheppard Ct · Georgetown, KY
Flood risk 1/10 · Minimal
- FEMA flood zone
- X (unshaded)
- Chance of flooding over 30 yrs
- 0.0%
- Est. flood insurance / yr
- $507 – $1,088
Fire risk 3/10 · Minor
- Est. fire insurance / yr
- $839 – $1,559
Heat risk 4/10 · Minor
- Hot days now (above 102°F)
- 7 days/yr
- Hot days in 30 yrs
- 19 days/yr
Wind risk 2/10 · Minimal
- Chance of severe wind over 30 yrs
- 1.0%
Air-quality risk 2/10 · Minimal
- Unhealthy air days now
- 1 days/yr
- Unhealthy air days in 30 yrs
- 2 days/yr
Risk factors via First Street. Map © Google.
Why this score? — see what drove the F grade
The composite is a weighted blend of 9 inputs, each scored 0–100. Each bar is that input's sub-score; the figure is the points it added to the 100-point composite (weight × sub-score).
- ARV discount +7.5/15.0
- Cash flow +5.4/30.0
- Livability +3.9/5.0
- Schools +3.4/10.0
- Rent growth +3.2/5.0
- Condition / age +2.5/5.0
- 1% rule +1.0/10.0
- DSCR +0.0/10.0
- Appreciation +0.0/10.0
$1
🖨 Deal sheet 📄 Offer letter ✓ Due diligence
Listing remarks
Absolute Auction Saturday June 20th at 10:00AM on location! Preview dates are June 14th from 2:00-4:00PM and Thursday June 18th from 5:00-7:00PM. No other showing times are available. Buyers to verify all aspects of the property.
Key facts
- 0.53 acre lot
- 2 garage spots
- Built 1992
Property features AI
Finance
- Other: Located in Moon Lake subdivision; County: Scott
Exterior
- Parking: Garage faces front; Has garage
- Utilities: Public sewer
- Home design: House; Multi/split levels
- Construction: Brick veneer and vinyl siding exterior; Block foundation; Shingle roof; Building area approximately 1,506
- Exterior features: Shed(s); Chain link fencing; Public water
Interior
- Bedrooms: 3 total rooms
- Flooring: Carpet; Vinyl
- Bathrooms: 2 full bathrooms; 1 half bathroom
- Heating & cooling: Electric heating; Electric cooling
- Interior features: Partial basement; No fireplace
Neighborhood map
What this means for you Summary
Snapshot
- This is a 3-bed/2.0-bath single-family listed at $1.
Deal economics
- At list price, monthly cash flow is $-672 ($-8k/yr) — negative.
- The deal already cash-flows at list — no discount required.
- Meets the 1% rule at list price ($2k rent vs $1).
Location & tenants
- Location reads 78/100 on livability (#75 in KY, #2,338 nationally) — a middle-class / working-renter tenant base. Strengths: cost of living A+, housing A+, health & safety A+; Watch: amenities D, commute F.
- Scott County (town): math 32% / reading 44% proficiency, ranked #31 of 165 in KY (top 19%) — families likely to look elsewhere, expect single-tenant / working-renter base with shorter leases.
- Zoned schools: Northern Elementary School (math 43% / reading 48%, grade D-, #142 of 676 statewide, top 21%, 454 students, 34% FRL); Scott County Middle School (math 38% / reading 53%, grade D+, #32 of 217 statewide, top 15%, 864 students, 35% FRL); Scott County High School (math 34% / reading 37%, grade F, #73 of 254 statewide, top 28%, 1,197 students, 40% FRL) — zoned schools at 37% FRL track the district average.
- Market conditions: Rents rising (+3.0%/yr); 441 active listings in the ZIP; solid renter incomes; 546 units permitted in Scott County in 2024 (98 in 5+ unit buildings).
Forward outlook
- Local home prices are declining (-3.0%/yr); year-one equity from $2k of loan paydown is wiped out by about $9k of value loss. Plan a longer hold.
- Scott County population projected at +45% by 2050 — long-run rental-demand tailwind backs the buy-and-hold thesis.
Negotiation context
- Only 7 days on market — expect competitive offers; lowballing is unlikely to land.
Risks & watch-outs
- Watch-outs: property tax is 460836.0% of price.
Questions for the listing agent
- What do current leases actually rent for vs. the listed asking? Can we see a recent rent roll and the last 12 months of T-12 income?
- Property tax is high relative to price — has the assessment been appealed recently, and will the sale trigger a re-assessment?
- Is there a deadline driving the sale (1031 exchange, divorce, estate, relocation)? That informs how much negotiation room exists.
- Schools are D-rated, which usually means shorter tenancies and higher turnover. Who's the typical renter profile here, and what's been the actual vacancy rate?
- The area grade is low — what's the realistic commute time and amenity access for the typical tenant pool here? Any planned neighborhood developments (good or bad) we should know about?
- What's the average days-on-market for RENTAL listings here right now (not sales)? A rising rental-DOM trend means longer vacancies and softer asking-rent achievability than the comps imply.
- What's the recent tenant-quality profile in this submarket — average credit score on applications, eviction rate, late-payment / NSF rate, and stable-employment percentage? A property-management company in the area should have these aggregated.
- How much new for-sale + rental construction is in the pipeline within 1–3 miles? Heavy new supply typically softens prices + rents 12–24 months out; constrained supply supports both.
Investment metrics
- 1% rule
- 0.60% ✗
- Cap rate
- 3.67%
- Cash-on-cash
- -9.38%
- DSCR
- 0.58
- GRM
- 13.9
CMA / ARV
- ARV (on-the-fly)
- $307,224
- Comps found
- 5
Show comp detail 5 sales within ~0.75 mi
| Address | Dist | Beds/Ba | Sqft | Sold | Price | $/sf | Match |
|---|---|---|---|---|---|---|---|
| 108 Agena Dr | 0.44mi | 3/2.0 | 1,512 (+0%) | 4mo | $303,000 | $200 | 76 |
| 120 Gemini Trl | 0.25mi | 3/2.0 | 1,440 (-4%) | 18mo | $275,000 | $191 | 66 |
| 187 Gemini Trl | 0.47mi | 3/2.0 | 1,614 (+7%) | 15mo | $330,000 | $204 | 54 |
| 2495 Cincinnati Rd | 0.64mi | 4/2.0 (+1) | 1,338 (-11%) | 6mo | $285,000 | $213 | 41 |
| 220 Gemini Trl | 0.75mi | 3/2.0 | 1,284 (-15%) | 23mo | $304,000 | $237 | 22 |
Match score weights: distance 35% · size 25% · config 20% · recency 20%. Top-matched comps best support the ARV.
Projected returns pro-forma
-3.0% appreciation · 3.0% rent growth · sell at horizon
- IRR
- -33.0%
- Equity multiple
- -0.08×
- Total profit
- $-92,574
- Equity at exit
- $45,808
- IRR
- -39.6%
- Equity multiple
- -0.58×
- Total profit
- $-135,634
- Equity at exit
- $26,563
Cash invested: $86,023 (down + closing). Projections, not guarantees.
Landlord ↔ Tenant lean methodology
- Overall (STATE)
- 83 Strongly Landlord-Friendly
- State Kentucky
- 83 Strongly Landlord-Friendly · R+16
- County
- — inherits STATE
- City
- — inherits STATE
ZIP-level market 40324
- Rents YoY
- 3.0%
- Active inventory
- 441
Monthly cashflow live
- Estimated rent
- $1,837 medium interval (Pro) →
- Mortgage (P&I)
- −$1,611
- Tax est. 1.5%
- −$384 /mo · $4,608/yr
- Insurance
- −$128
- HOA
- −$0
- Vacancy / Maint / Mgmt
- −$386
- Net cashflow
- $-672
Break-even live
UW: 25.0% down · 7.5% · 30yr · 1.5% tax · 5.0% vac · 8.0% maint · 8.0% mgmt
Financing live
Cash to close
- Down payment
- $76,806
- Closing costs
- $9,217
- Reserves months
- —
- Total cash needed
- —
Loan-product check · same deal, 3 products live
Conventional
25% down · 7.5% · 30yr
- Down + closing
- —
- Monthly P&I
- —
- Monthly cashflow
- —
- DSCR
- —
- Eligible?
- —
Personal DTI + credit; lowest rate.
DSCR
20% down · 8.5% · 30yr
- Down + closing
- —
- Monthly P&I
- —
- Monthly cashflow
- —
- DSCR
- —
- Eligible?
- —
No personal income docs; deal must DSCR.
Hard money
10% down · 12.0% · 12mo
- Down + closing
- —
- Monthly P&I
- —
- Monthly cashflow
- —
- DSCR
- —
- Eligible?
- —
Short-term bridge; refi at stabilization.
Listing history 6 events
-
2026-06-18days on market $1 Active 7 DOM
-
2026-06-17days on market $1 Active 6 DOM
-
2026-06-16days on market $1 Active 5 DOM
-
2026-06-15days on market $1 Active 4 DOM
-
2026-06-14remarks 229-char remark
-
2026-06-14$1 Active 2 DOM
ⓘ Source: listings_history table (triggers on properties + properties_extension) + one-shot
backfill from property_details.listing_events for pre-trigger history.
Climate risk First Street
- Flood 1/10 Low FEMA zone X (unshaded) · 0% chance over 30 yrs
- Wildfire 3/10 Moderate
- Heat 4/10 Moderate 7 d/yr ≥102°F today · 19 d/yr by 30 yrs out
- Wind 2/10 Low 100% chance of damaging wind over 30 yrs
- Air quality 2/10 Low 1 unhealthy d/yr today · 2 by 30 yrs out
Nearby sold comps map
Loading sold comps map…
Walkable amenities ~0.75 mi
Loading nearby amenities…
Taxation est. · year 1
- Rental income
- $22,039
- − Mortgage interest
- −$17,209
- − Property taxes
- −$4,608
- − Insurance
- −$1,536
- − Repairs & maintenance
- −$1,763
- − Management
- −$1,763
- − Depreciation
- −$8,937
- Taxable loss
- −$13,779
- Est. tax savings @ 24.0%
- +$3,307
- After-tax cash flow
- $-4,760/yr
For passive investors: Depreciation is non-cash, so a rental often shows a tax loss while cash-flowing — sheltering income. Rental losses are passive: they offset passive income freely, and up to $25,000/yr can offset ordinary (W-2) income if you actively participate and your MAGI is under $100k (phasing out to $0 by $150k); unused losses carry forward. On sale, claimed depreciation is recaptured at up to 25%, and gains may owe capital-gains tax (a 1031 exchange can defer both). Figures are a year-1 estimate at your 24.0% rate — not tax advice; consult a CPA.
Schools (NCES district)
- District
- Scott County
- NCES district ID
- 2105260
- Math proficiency
- 32% ▼ -14.00%
- Reading proficiency
- 44% ▼ -16.00%
- Median HH income
- $61,324
- Composite
- 33.87/100
- National rank
- #5348
- State rank
- #31 of 165 in KY
Livability — Georgetown
- Score
- 78/100
- State rank
- #75
- US rank
- #2338
Category grades
Schools grade is shown separately in the Schools card above.
Census & demographics
- County
- Scott County · 53,406 people
- City population
- 53,406
- Metro
- Lexington-Fayette, KY
- Population (ZIP)
- 53,406
- Household income
- $85,110
- Rent vs Own
- Severe rent burden
- 993.0
Population outlook (Scott County) Hauer SSP2
- Today (2025)
- 63,814 people
- By 2030
- 69,637 · +9.1%
- By 2040
- 81,315 · +27.4%
- By 2050
- 92,677 · +45.2%
- By 2075
- 118,956 · +86.4%
- By 2100
- 136,792 · +114.4%
Race, ethnicity, and origin ACS 2023
- Neighborhood character
- Predominantly White (83%)
- Race & ethnicity
- White 83% Hispanic / Latino 6% Two or more races 6% Black 5%
- Hispanic origin (detail)
- Mexican 4%
- Common ancestry
- Italian 2% Serbian 2% Slovak 2%
- Foreign-born
- 3% · Canada
- Languages at home
- 94% English-only · Spanish 4%
Political lean MEDSL · Scott
- 2024 margin
- Strong R (+27.7) · D 35.3% · R 63.0% · Other 1.7%
- 2008→2024 swing
- -7.1pp toward R · 2008: -20.6pp · 2024: -27.7pp
- All cycles
- 2024: R+27.7 2020: R+24.9 2016: R+30.4 2012: R+25.0 2008: R+20.6
Not yet ingested
- Civics
- —
Market trends
- HPI YoY
- ▼ -105.49%
- Current HPI
- 187.89
- Rent YoY
- ▲ 3.00%
- Metro
- Lexington-Fayette, KY
- State GDP YoY
- ▲ 1.81%
- F500 in state
- 4
Industry mix (Fortune 500 HQ in KY)
| Industry | F500 HQs | Revenue |
|---|---|---|
| Healthcare | 1 | $118B |
|
||
| Food / Beverage | 1 | $7B |
|
||
Property tax history
+8.2%/yrLatest (2025): $1,780 · +18.8% YoY. Source: county tax records.
Cash-flow waterfall
monthlySold comps — $/sqft
last 12 mo · ≤1 miLoading sold comps…