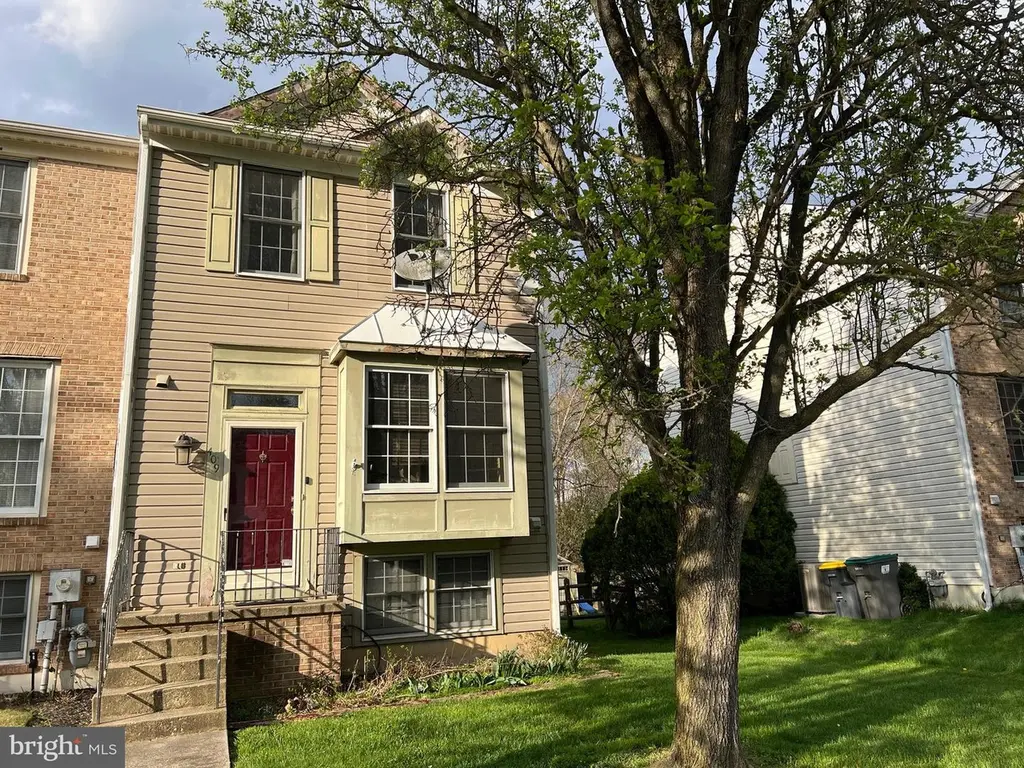
409 Corato Ct · Glasgow, DE
Flood risk 1/10 · Minimal
- FEMA flood zone
- X (unshaded)
- Chance of flooding over 30 yrs
- 0.0%
- Est. flood insurance / yr
- $473 – $860
Fire risk 2/10 · Minimal
- Est. fire insurance / yr
- $476 – $884
Heat risk 7/10 · Major
- Hot days now (above 103°F)
- 7 days/yr
- Hot days in 30 yrs
- 15 days/yr
Wind risk 6/10 · Moderate
- Chance of severe wind over 30 yrs
- 27.0%
Air-quality risk 4/10 · Minor
- Unhealthy air days now
- 3 days/yr
- Unhealthy air days in 30 yrs
- 5 days/yr
Risk factors via First Street. Map © Google.
Why this score? — see what drove the C+ grade
The composite is a weighted blend of 9 inputs, each scored 0–100. Each bar is that input's sub-score; the figure is the points it added to the 100-point composite (weight × sub-score).
- Cash flow +22.0/30.0
- ARV discount +15.0/15.0
- DSCR +7.0/10.0
- 1% rule +5.1/10.0
- Rent growth +4.8/5.0
- Livability +3.9/5.0
- Schools +2.5/10.0
- Condition / age +2.5/5.0
- Appreciation +0.0/10.0
$250,000
🖨 Deal sheet 📄 Offer letter ✓ Due diligence
Listing remarks
This home is a diamond in the rough. The 3 bedroom, 2.5 bath end-unit townhome in Pinewoods is worth a look. With TLC , some elbow grease and updating you could bring it back to it's glory and shine! This home is being sold AS-IS. Buyer may perform any inspections for informational purposes, but seller will make no repairs. Gain instant equity - priced according to condition. Come on out and tour this home - See what your imagination will do! Cash or Conventional offers only.
Key facts
- 2 parking spots
- Built 1991
- Listed 6 days
Property features AI
Finance
- Other: Ownership: Fee simple; Lease not considered; Pets allowed with no restrictions
Exterior
- Parking: Two assigned off-street parking spaces
- Utilities: Public water; Public sewer (public septic); Electric for heating, cooling and hot water
- Home design: End of row townhouse; Entry level is floor 2
- Construction: Vinyl siding exterior; Asphalt roof; Concrete perimeter foundation; Year built source: Assessor
- Exterior features: Lot dimensions approximately 31.00 x 161.30; Not in a federal flood zone; Above-grade and below-grade structures; Tidal water: none
Interior
- Kitchen: Kitchen (appliances not specified)
- Bedrooms: Two bedrooms on the upper level; One bedroom on the lower level
- Bathrooms: Two full bathrooms (one on upper level, one on lower level); One half bathroom on main level
- Heating & cooling: Forced air heating (electric); Central air conditioning (electric); Electric hot water
- Interior features: Drywall walls and ceilings; Fully finished basement with outside entrance (approximately 89% finished); Level entry to main floor
- Laundry & utility: Laundry located in the basement
Neighborhood map
What this means for you Summary
Snapshot
- This is a 2-bed/2.5-bath townhouse listed at $250k.
Deal economics
- At list price, monthly cash flow is $399 ($5k/yr) — positive.
- The deal already cash-flows at list — no discount required.
- Meets the 1% rule at list price ($3k rent vs $250k).
- Cap rate 8.2% vs local median 3.5% in Glasgow — top-decile yield for the area; either an underpriced asset or a hidden risk that comps aren't pricing in. Stress-test before assuming the spread holds.
Location & tenants
- Location reads 77/100 on livability (#4 in DE, #3,151 nationally) — a middle-class / working-renter tenant base. Strengths: employment A+, housing A+, health & safety A+; Watch: amenities F, commute F.
- Christina School District (suburban): math 22% / reading 33% proficiency, ranked #18 of 26 in DE (top 69%) — low school quality limits family demand, transient renter base, plan for 1-2y turnover.
- Market conditions: Rents rising fast (+9.0%/yr); 103 active listings in the ZIP; 6 comparable units currently listed for rent nearby; rentals leasing fast (median 1d on market — plan ~1-2 weeks tenant-placement turnaround); high-income renter base; 1,367 units permitted in New Castle County in 2024 (201 in 5+ unit buildings).
Forward outlook
- Local home prices are declining (-3.0%/yr); year-one equity from $2k of loan paydown is wiped out by about $8k of value loss. Plan a longer hold.
- New Castle County population projected at +9% by 2050 — modest demand growth; plan on rents tracking national, not racing it.
- At projected returns (-3.0% appreciation + 8.0% rent growth), your $70k cash investment doubles in ~9 years — after that, you're playing with house money.
Negotiation context
- Only 6 days on market — expect competitive offers; lowballing is unlikely to land.
Risks & watch-outs
- Climate carrying-cost: major wind risk, 27% chance of damaging wind over 30y; extreme-heat days projected 7→15/yr by 2055 (HVAC capex compounding) — expect insurance premiums to compound above CPI over the hold.
Questions for the listing agent
- Is there a deadline driving the sale (1031 exchange, divorce, estate, relocation)? That informs how much negotiation room exists.
- What's the average days-on-market for RENTAL listings here right now (not sales)? A rising rental-DOM trend means longer vacancies and softer asking-rent achievability than the comps imply.
- What's the recent tenant-quality profile in this submarket — average credit score on applications, eviction rate, late-payment / NSF rate, and stable-employment percentage? A property-management company in the area should have these aggregated.
- How much new for-sale + rental construction is in the pipeline within 1–3 miles? Heavy new supply typically softens prices + rents 12–24 months out; constrained supply supports both.
Investment metrics
- 1% rule
- 1.01% ✓
- Cap rate
- 8.21%
- Cash-on-cash
- 6.84%
- DSCR
- 1.30
- GRM
- 8.2
CMA / ARV
- ARV (on-the-fly)
- $310,275
- Comps found
- 12
Show comp detail 12 sales within ~0.75 mi
| Address | Dist | Beds/Ba | Sqft | Sold | Price | $/sf | Match |
|---|---|---|---|---|---|---|---|
| 409 Corato Ct | 0.00mi | 3/2.5 (+1) | 1,575 (0%) | 0mo | $250,000 | $159 | 95 |
| 650 Corsica Ave | 0.10mi | 2/2.5 | 1,532 (-3%) | 8mo | $309,900 | $202 | 85 |
| 667 Corsica Ave | 0.14mi | 3/1.5 (+1) | 1,550 (-2%) | 2mo | $299,900 | $193 | 81 |
| 840 Sabina Cir | 0.24mi | 2/1.5 | 1,644 (+4%) | 2mo | $320,000 | $195 | 76 |
| 714 Naples Way | 0.16mi | 2/1.5 | 1,425 (-10%) | 4mo | $239,000 | $168 | 70 |
| 221 Vercelli Dr | 0.23mi | 2/2.5 | 1,400 (-11%) | 2mo | $290,000 | $207 | 70 |
| 658 Corsica Ave | 0.11mi | 2/1.5 | 1,425 (-10%) | 7mo | $242,000 | $170 | 69 |
| 685 Corsica Ave | 0.17mi | 2/2.5 | 1,400 (-11%) | 8mo | $299,999 | $214 | 66 |
| 705 Naples Way | 0.17mi | 3/2.5 (+1) | 1,425 (-10%) | 7mo | $282,500 | $198 | 65 |
| 22 Monferrato Ct | 0.23mi | 2/1.5 | 1,400 (-11%) | 5mo | $303,000 | $216 | 63 |
| 7 Forest Glen Ct | 0.42mi | 3/2.5 (+1) | 1,650 (+5%) | 9mo | $325,000 | $197 | 60 |
| 14 Pimlico Ln | 0.60mi | 3/2.5 (+1) | 1,725 (+10%) | 6mo | $335,000 | $194 | 46 |
Match score weights: distance 35% · size 25% · config 20% · recency 20%. Top-matched comps best support the ARV.
Projected returns pro-forma
-3.0% appreciation · 8.0% rent growth · sell at horizon
- IRR
- -0.6%
- Equity multiple
- 0.98×
- Total profit
- $-1,731
- Equity at exit
- $37,276
- IRR
- 13.5%
- Equity multiple
- 2.31×
- Total profit
- $92,013
- Equity at exit
- $21,615
Cash invested: $70,000 (down + closing). Projections, not guarantees.
Landlord ↔ Tenant lean methodology
- Overall (STATE)
- 70 Landlord-Friendly
- State Delaware
- 70 Landlord-Friendly · D+7
- County
- — inherits STATE
- City
- — inherits STATE
ZIP-level market 19701
- Rents YoY
- 9.0%
- Active inventory
- 103
- Price-to-rent
- 8.2×
Monthly cashflow live
- Estimated rent
- $2,533 high interval (Pro) →
- Mortgage (P&I)
- −$1,311
- Tax from tax record
- −$187 /mo · $2,241/yr
- Insurance
- −$104
- HOA
- −$0
- Vacancy / Maint / Mgmt
- −$532
- Net cashflow
- $399
Break-even live
UW: 25.0% down · 7.5% · 30yr · 1.5% tax · 5.0% vac · 8.0% maint · 8.0% mgmt
Financing live
Cash to close
- Down payment
- $62,500
- Closing costs
- $7,500
- Reserves months
- —
- Total cash needed
- —
Loan-product check · same deal, 3 products live
Conventional
25% down · 7.5% · 30yr
- Down + closing
- —
- Monthly P&I
- —
- Monthly cashflow
- —
- DSCR
- —
- Eligible?
- —
Personal DTI + credit; lowest rate.
DSCR
20% down · 8.5% · 30yr
- Down + closing
- —
- Monthly P&I
- —
- Monthly cashflow
- —
- DSCR
- —
- Eligible?
- —
No personal income docs; deal must DSCR.
Hard money
10% down · 12.0% · 12mo
- Down + closing
- —
- Monthly P&I
- —
- Monthly cashflow
- —
- DSCR
- —
- Eligible?
- —
Short-term bridge; refi at stabilization.
Rent comps 6 comps
| Address | Beds | Baths | Sqft | Rent | $/sqft | DOM | Units | Dist |
|---|---|---|---|---|---|---|---|---|
| 50 Turnberry Ct Bear, DE | 1.0–3.0 | 1.0–3.0 | 1598 | $2,652 | $1.66 | 1d | 194 | 0.47mi |
| 1906 Porter Rd Bear, DE | 3.0 | 2.5 | 2150 | $3,200 | $1.49 | 19d | 1 | 0.86mi |
| 1 Kennedy Cir Bear, DE | 1.0–3.0 | 1.0–3.0 | 1582 | $2,568 | $1.62 | 1d | 39 | 1.05mi |
| 900 Woodchuck Pl Bear, DE | 1.0–3.0 | 1.0–2.0 | 935 | $1,950 | $2.09 | 1d | 46 | 1.09mi |
| 308 Skeet Ave Bear, DE | 3.0 | 2.0 | 1100 | $2,300 | $2.09 | 24d | 1 | 1.15mi |
| 49 Willow Pl Newark, DE | 3.0–4.0 | 2.0–3.5 | 1844 | $2,725 | $1.48 | 1d | 1 | 1.15mi |
Listing history 4 events
-
2026-04-30status Pending
-
2026-04-30historical
-
2026-04-25$250,000 Active
-
2026-04-22historical $250,000
ⓘ Source: listings_history table (triggers on properties + properties_extension) + one-shot
backfill from property_details.listing_events for pre-trigger history.
Tax reassessment forecast DE · Partial reset (capped growth)
- Current annual tax
- $2,241 · $187/mo
- Projected year-2 tax
- $2,241 · $187/mo
- Expected delta
- $0/yr ($0/mo · 0.0%)
ⓘ Screening estimate from a state-policy table — verify with the county assessor before closing.
Climate risk First Street
- Flood 1/10 Low FEMA zone X (unshaded) · 0% chance over 30 yrs
- Wildfire 2/10 Low
- Heat 7/10 Severe 7 d/yr ≥103°F today · 15 d/yr by 30 yrs out
- Wind 6/10 Major 27% chance of damaging wind over 30 yrs
- Air quality 4/10 Moderate 3 unhealthy d/yr today · 5 by 30 yrs out
Nearby sold comps map
Loading sold comps map…
Walkable amenities ~0.75 mi
Loading nearby amenities…
Taxation est. · year 1
- Rental income
- $30,399
- − Mortgage interest
- −$14,004
- − Property taxes
- −$2,241
- − Insurance
- −$1,250
- − Repairs & maintenance
- −$2,432
- − Management
- −$2,432
- − Depreciation
- −$7,273
- Taxable income
- $767
- Est. tax owed @ 24.0%
- −$184
- After-tax cash flow
- $4,607/yr
For passive investors: Depreciation is non-cash, so a rental often shows a tax loss while cash-flowing — sheltering income. Rental losses are passive: they offset passive income freely, and up to $25,000/yr can offset ordinary (W-2) income if you actively participate and your MAGI is under $100k (phasing out to $0 by $150k); unused losses carry forward. On sale, claimed depreciation is recaptured at up to 25%, and gains may owe capital-gains tax (a 1031 exchange can defer both). Figures are a year-1 estimate at your 24.0% rate — not tax advice; consult a CPA.
Schools (NCES district)
- District
- Christina School District
- NCES district ID
- 1000200
- Math proficiency
- 22% ▼ -12.00%
- Reading proficiency
- 33% ▼ -5.00%
- Median HH income
- $58,838
- Composite
- 24.93/100
- National rank
- #7567
- State rank
- #18 of 26 in DE
Livability — Glasgow
- Score
- 77/100
- State rank
- #4
- US rank
- #3151
Category grades
Schools grade is shown separately in the Schools card above.
Census & demographics
- Census place
- Glasgow, DE
- County
- New Castle County · 483,412 people
- City population
- 56,049
- Metro
- Philadelphia-Camden-Wilmington, PA-NJ-DE-MD
- Population (ZIP)
- 42,984
- Household income
- $111,198
- Rent vs Own
- Severe rent burden
- 619.0
Population outlook (New Castle County) Hauer SSP2
- Today (2025)
- 594,686 people
- By 2030
- 609,164 · +2.4%
- By 2040
- 632,154 · +6.3%
- By 2050
- 649,068 · +9.1%
- By 2075
- 687,771 · +15.7%
- By 2100
- 694,961 · +16.9%
Race, ethnicity, and origin ACS 2023
- Neighborhood character
- Diverse neighborhood (Simpson 0.67)
- Race & ethnicity
- White 50% Black 26% Hispanic / Latino 11% Asian 10% Two or more races 7%
- Hispanic origin (detail)
- Mexican 4% Puerto Rican 4%
- Common ancestry
- Romanian 4% Lithuanian 2% Slovak 1%
- Foreign-born
- 17% · Canada, China, Vietnam
- Languages at home
- 78% English-only · Spanish 8% Other Asian/Pacific 3% Other Indo-European 3%
Political lean MEDSL · New Castle
- 2024 margin
- Solid D (+32.6) · D 65.5% · R 32.9% · Other 1.6%
- 2008→2024 swing
- -8.1pp toward R · 2008: 40.6pp · 2024: 32.6pp
- All cycles
- 2024: D+32.6 2020: D+37.1 2016: D+29.6 2012: D+34.1 2008: D+40.6
Not yet ingested
- Civics
- —
Market trends
- HPI YoY
- ▼ -159.00%
- Current HPI
- 261.2988
- Rent YoY
- ▲ 9.03%
- Metro
- Philadelphia-Camden-Wilmington, PA-NJ-DE-MD
- State GDP YoY
- —
- F500 in state
- 0
Price history
+0.0% since first listed4 events — show timeline
- 2026-04-30 Pending — BRIGHT MLS
- 2026-04-30 Listing Removed — BRIGHT MLS
- 2026-04-25 Listed $250,000 BRIGHT MLS
- 2026-04-22 Coming Soon $250,000 BRIGHT MLS
Property tax history
+3.5%/yrLatest (2024): $2,241 · +2.7% YoY. Source: county tax records.
Cash-flow waterfall
monthlySold comps — $/sqft
last 12 mo · ≤1 miLoading sold comps…