 🏷️ Likely Rental
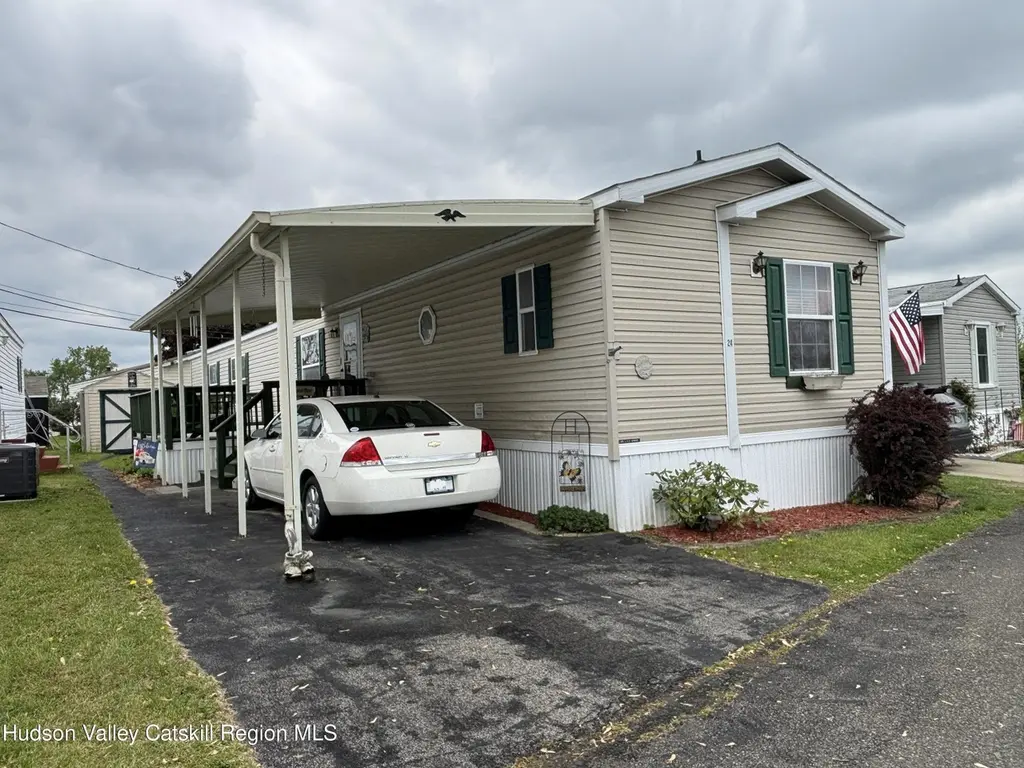
3459 Route 9 #24 · Claverack-Red Mills, NY
Flood risk No data
- FEMA flood zone
- —
- Chance of flooding over 30 yrs
- —
- Est. flood insurance / yr
- —
Fire risk No data
- Est. fire insurance / yr
- —
Heat risk No data
- Hot days now (above threshold)
- —
- Hot days in 30 yrs
- —
Wind risk No data
- Chance of severe wind over 30 yrs
- —
Air-quality risk No data
- Unhealthy air days now
- —
- Unhealthy air days in 30 yrs
- —
Risk factors via First Street. Map © Google.
Why this score? — see what drove the A grade
The composite is a weighted blend of 9 inputs, each scored 0–100. Each bar is that input's sub-score; the figure is the points it added to the 100-point composite (weight × sub-score).
- Cash flow +30.0/30.0
- ARV discount +15.0/15.0
- 1% rule +10.0/10.0
- DSCR +10.0/10.0
- Appreciation +10.0/10.0
- Rent growth +5.0/5.0
- Schools +3.6/10.0
- Condition / age +2.8/5.0
- Livability +2.5/5.0
$96,000
🖨 Deal sheet 📄 Offer letter ✓ Due diligence
Listing remarks
Located in the 55+ Community at Bells Pond, this 2002 Champion (16x76) offers 3 beds, 2 baths, an open floor plan, covered porch/carport & shed. Furnace & AC replaced 2 years ago plus new microwave. Lot rent is 362/month. Buyer must receive park approval.
Key facts
- Built 2002
- Listed 4 days
Property features AI
Exterior
- Parking: Attached carport
- Utilities: Public water; Public sewer
- Home design: Manufactured house (mobile home); Single wide
- Construction: Slab foundation
- Exterior features: Shed(s); Has a view
Interior
- Kitchen: Dishwasher; Gas oven; Refrigerator
- Bedrooms: Single wide manufactured home (bedroom count not specified)
- Bathrooms: 2 full bathrooms
- Heating & cooling: Forced air heating; Propane fuel
- Interior features: Dishwasher; Gas oven; Refrigerator
- Laundry & utility: Washer and dryer included
Neighborhood map
What this means for you Summary
Snapshot
- This is a 3-bed/2.0-bath manufactured listed at $96k. Condition is rated average.
Deal economics
- At list price, monthly cash flow is $1k ($18k/yr) — positive.
- The deal already cash-flows at list — no discount required.
- Meets the 1% rule at list price ($3k rent vs $96k).
- Cap rate 25.0% vs local median 3.9% in Claverack-Red Mills — top-decile yield for the area; either an underpriced asset or a hidden risk that comps aren't pricing in. Stress-test before assuming the spread holds.
Location & tenants
- Location reads: area grade A — affects rentability + tenant quality, not the cash-flow math above.
- Hudson City School District (town): math 38% / reading 47% proficiency, ranked #494 of 590 in NY (top 84%) — families likely to look elsewhere, expect single-tenant / working-renter base with shorter leases.
- Market conditions: Rents rising fast (+10.9%/yr); 161 active listings in the ZIP; 136 units permitted in Columbia County in 2024 (0 in 5+ unit buildings).
- At $2,729/mo this rent would consume 45% of the median local household income ($73k/yr) (locally 1083% of renters already pay >50% of income on rent) — very limited rent-growth headroom before tenants either downsize or default.
Forward outlook
- In year one you build about $10k of equity ($664 loan paydown + $10k appreciation (10.0% local appreciation)).
- Columbia County population projected at -22% by 2050 — secular population decline; favor cash flow + early exit over multi-decade hold.
- At projected returns (10.0% appreciation + 8.0% rent growth), your $27k cash investment doubles in ~1 year — after that, you're playing with house money.
- By year 4, paydown + projected appreciation supports a ~$36k cash-out refi (75% LTV) — recoverable capital for the next deal without selling this one.
Negotiation context
- Only 4 days on market — expect competitive offers; lowballing is unlikely to land.
Questions for the listing agent
- Is there a deadline driving the sale (1031 exchange, divorce, estate, relocation)? That informs how much negotiation room exists.
- What's the average days-on-market for RENTAL listings here right now (not sales)? A rising rental-DOM trend means longer vacancies and softer asking-rent achievability than the comps imply.
- What's the recent tenant-quality profile in this submarket — average credit score on applications, eviction rate, late-payment / NSF rate, and stable-employment percentage? A property-management company in the area should have these aggregated.
- How much new for-sale + rental construction is in the pipeline within 1–3 miles? Heavy new supply typically softens prices + rents 12–24 months out; constrained supply supports both.
Investment metrics
- 1% rule
- 2.84% ✓
- Cap rate
- 24.95%
- Cash-on-cash
- 66.64%
- DSCR
- 3.97
- GRM
- 2.9
CMA / ARV
- ARV (median comp)
- $124,160
- List price
- $96,000
- Delta
- -22.68%
- Verdict
- UNDERPRICED
- Comps
- 1 within 2.0 mi
Projected returns pro-forma
10.0% appreciation · 8.0% rent growth · sell at horizon
- IRR
- 82.3%
- Equity multiple
- 7.02×
- Total profit
- $161,825
- Equity at exit
- $86,484
- IRR
- 78.3%
- Equity multiple
- 17.28×
- Total profit
- $437,597
- Equity at exit
- $186,507
Cash invested: $26,880 (down + closing). Projections, not guarantees.
Landlord ↔ Tenant lean methodology
- Overall (STATE)
- 15 Strongly Tenant-Friendly
- State New York
- 15 Strongly Tenant-Friendly · D+10
- County
- — inherits STATE
- City
- — inherits STATE
ZIP-level market 12534
- Home prices YoY
- 5.6%
- Rents YoY
- 10.9%
- Active inventory
- 161
- Price-to-rent
- 2.9×
Monthly cashflow live
- Estimated rent
- $2,729 medium interval (Pro) →
- Mortgage (P&I)
- −$503
- Tax est. 1.5%
- −$120 /mo · $1,440/yr
- Insurance
- −$40
- HOA
- −$0
- Vacancy / Maint / Mgmt
- −$573
- Net cashflow
- $1,493
Break-even live
UW: 25.0% down · 7.5% · 30yr · 1.5% tax · 5.0% vac · 8.0% maint · 8.0% mgmt
Financing live
Cash to close
- Down payment
- $24,000
- Closing costs
- $2,880
- Reserves months
- —
- Total cash needed
- —
Loan-product check · same deal, 3 products live
Conventional
25% down · 7.5% · 30yr
- Down + closing
- —
- Monthly P&I
- —
- Monthly cashflow
- —
- DSCR
- —
- Eligible?
- —
Personal DTI + credit; lowest rate.
DSCR
20% down · 8.5% · 30yr
- Down + closing
- —
- Monthly P&I
- —
- Monthly cashflow
- —
- DSCR
- —
- Eligible?
- —
No personal income docs; deal must DSCR.
Hard money
10% down · 12.0% · 12mo
- Down + closing
- —
- Monthly P&I
- —
- Monthly cashflow
- —
- DSCR
- —
- Eligible?
- —
Short-term bridge; refi at stabilization.
Listing history 1 events
-
2026-05-15$96,000 Active 267-char remark
ⓘ Source: listings_history table (triggers on properties + properties_extension) + one-shot
backfill from property_details.listing_events for pre-trigger history.
Nearby sold comps map
Loading sold comps map…
Walkable amenities ~0.75 mi
Loading nearby amenities…
Taxation est. · year 1
- Rental income
- $32,753
- − Mortgage interest
- −$5,377
- − Property taxes
- −$1,440
- − Insurance
- −$480
- − Repairs & maintenance
- −$2,620
- − Management
- −$2,620
- − Depreciation
- −$2,793
- Taxable income
- $17,422
- Est. tax owed @ 24.0%
- −$4,181
- After-tax cash flow
- $13,732/yr
For passive investors: Depreciation is non-cash, so a rental often shows a tax loss while cash-flowing — sheltering income. Rental losses are passive: they offset passive income freely, and up to $25,000/yr can offset ordinary (W-2) income if you actively participate and your MAGI is under $100k (phasing out to $0 by $150k); unused losses carry forward. On sale, claimed depreciation is recaptured at up to 25%, and gains may owe capital-gains tax (a 1031 exchange can defer both). Figures are a year-1 estimate at your 24.0% rate — not tax advice; consult a CPA.
Condition & rehab AI · 12 photos
This 2002 mobile home requires moderate repairs and maintenance to improve its curb appeal and value. Painting and landscaping will enhance its appearance, while updating the kitchen and bathroom will significantly boost its resale value.
Repairs flagged
- Minor Paint — Light wear and tear visible on exterior
- Minor Landscaping — Some overgrown areas
Value-add opportunities
- Both Paint exterior and landscaping — Enhances curb appeal and value
- Resale Replace dated kitchen backsplash — Modernizes kitchen and adds value
- Resale Replace dated bathroom tile — Modernizes bathroom and adds value
Renovation cost estimate screening
| Repair item | Severity | Est. cost |
|---|---|---|
| Paint · Light wear and tear visible on exterior | Minor | $500–3,000 |
| Landscaping · Some overgrown areas | Minor | $500–3,000 |
| Total estimated repair cost · 2 items | $1,000–6,000 |
Value-add ROI direction
- Both Paint exterior and landscaping — Enhances curb appeal and value ↑
- Resale Replace dated kitchen backsplash — Modernizes kitchen and adds value ↑
- Resale Replace dated bathroom tile — Modernizes bathroom and adds value ↑
ⓘ Cost ranges are severity-bucket heuristics (US national rule-of-thumb). Get contractor quotes + a written scope before underwriting a rehab budget.
Schools (NCES district)
- District
- Hudson City School District
- NCES district ID
- 3614940
- Math proficiency
- 38% ▲ 4.00%
- Reading proficiency
- 47% ▲ 7.00%
- Median HH income
- $44,663
- Composite
- 36.03/100
- National rank
- #4779
- State rank
- #494 of 590 in NY
Livability — Claverack-Red Mills
No livability data for this city. (Only ~50 U.S. cities are tracked.)
Census & demographics
- County
- Columbia County · 17,176 people
- City population
- 198
- Metro
- Hudson, NY
- Population (ZIP)
- 17,176
- Household income
- $72,741
- Rent vs Own
- Severe rent burden
- 1083.0
Population outlook (Columbia County) Hauer SSP2
- Today (2025)
- 58,662 people
- By 2030
- 56,557 · -3.6%
- By 2040
- 51,324 · -12.5%
- By 2050
- 45,790 · -21.9%
- By 2075
- 35,232 · -39.9%
- By 2100
- 25,846 · -55.9%
Race, ethnicity, and origin ACS 2023
- Neighborhood character
- Predominantly White (74%)
- Race & ethnicity
- White 74% Two or more races 7% Black 7% Hispanic / Latino 7% Asian 6%
- Hispanic origin (detail)
- Mexican 2% Puerto Rican 1%
- Common ancestry
- Lithuanian 4% Romanian 4% Iranian 3%
- Foreign-born
- 10% · Canada, China
- Languages at home
- 88% English-only · Spanish 5% Other Indo-European 3% Chinese 1%
Political lean MEDSL · Columbia
- 2024 margin
- D (+14.7) · D 57.4% · R 42.6%
- 2008→2024 swing
- +1.3pp toward D · 2008: 13.4pp · 2024: 14.7pp
- All cycles
- 2024: D+14.7 2020: D+16.7 2016: D+1.4 2012: D+11.7 2008: D+13.4
Not yet ingested
- Civics
- —
Market trends
- HPI YoY
- ▲ 25.98%
- Current HPI
- 490.0412
- Rent YoY
- ▲ 10.88%
- Metro
- Hudson, NY
- State GDP YoY
- ▲ 2.60%
- F500 in state
- 92
Industry mix (Fortune 500 HQ in NY)
| Industry | F500 HQs | Revenue |
|---|---|---|
| Financial Services | 10 | $950B |
|
||
| Consumer Goods | 9 | $162B |
|
||
| Insurance | 4 | $225B |
|
||
| Telecommunications | 2 | $144B |
|
||
| Pharmaceuticals | 2 | $112B |
|
||
| Media / Entertainment | 2 | $69B |
|
||
Price history
2 events — show timeline
- 2026-05-19 Pending — HVCRMLS
- 2026-05-15 Listed $96,000 HVCRMLS
Cash-flow waterfall
monthlySold comps — $/sqft
last 12 mo · ≤1 miLoading sold comps…