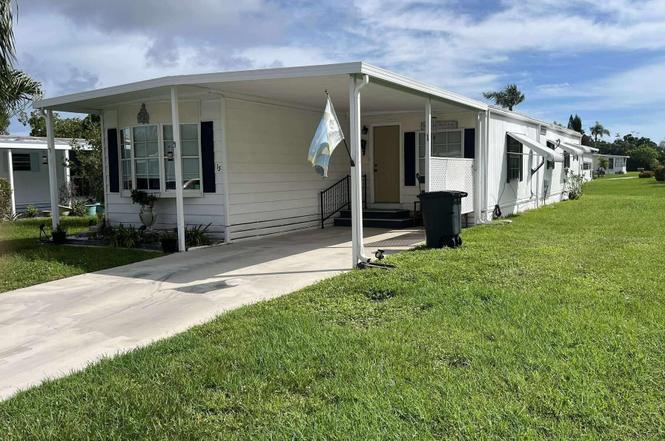
15 La Costa Ln · Port St. Lucie, FL
Flood risk 1/10 · Minimal
- FEMA flood zone
- X (unshaded)
- Chance of flooding over 30 yrs
- 0.0%
- Est. flood insurance / yr
- $507 – $1,088
Fire risk 3/10 · Minor
- Est. fire insurance / yr
- $947 – $1,759
Heat risk 10/10 · Severe
- Hot days now (above 106°F)
- 7 days/yr
- Hot days in 30 yrs
- 22 days/yr
Wind risk 10/10 · Severe
- Chance of severe wind over 30 yrs
- 99.0%
Air-quality risk 2/10 · Minimal
- Unhealthy air days now
- 1 days/yr
- Unhealthy air days in 30 yrs
- 1 days/yr
Risk factors via First Street. Map © Google.
Why this score? — see what drove the B+ grade
The composite is a weighted blend of 9 inputs, each scored 0–100. Each bar is that input's sub-score; the figure is the points it added to the 100-point composite (weight × sub-score).
- Cash flow +30.0/30.0
- ARV discount +15.0/15.0
- 1% rule +10.0/10.0
- DSCR +10.0/10.0
- Schools +3.7/10.0
- Rent growth +3.0/5.0
- Livability +2.5/5.0
- Condition / age +2.5/5.0
- Appreciation +0.0/10.0
$57,000
🖨 Deal sheet 📄 Offer letter ✓ Due diligence
Listing remarks
Welcome to 15 La Costa Lane, a charming 2-bedroom, 2-bath residence nestled in the active 55+ community of Spanish Lakes Golf Village in Port St. Lucie. Spanning approximately 1,080 square feet, this home offers a thoughtfully laid-out floor plan with split bedrooms and an abundance of natural light. The large screened Florida/sunroom adds flexible living space perfect for relaxing or entertaining in comfort. Inside, find an indoor laundry area, ample storage, and generous living zones that serve both everyday life and social occasions.
Key facts
- Indoor laundry area
- Ample storage
- Parking
Tags
Property features AI
Finance
- Other: Living area reported as 1,248 (owner source)
- Financial info: Pets not allowed; Senior community
- HOA & community: Has association with monthly fee; Association amenities include billiard room, fitness center, golf course, game room, sauna, spa/hot tub, tennis courts, workshop area, manager on site, cafe/restaurant, library, street lights; Association fee paid monthly
Exterior
- Parking: Attached carport (1 covered space)
- Security: Security patrol
- Utilities: Public water; Public sewer; Three-phase electric; Sewer available; Underground utilities; Water available
- Home design: Manufactured home; Single-story; Faces west; Resale condition; Road frontage east of US-1
- Construction: Modular construction; Metal roof; Aluminum skirt
- Exterior features: Porch; Shed(s); Not waterfront
Interior
- Kitchen: Electric range; Microwave; Refrigerator; Electric water heater
- Bedrooms: 2 bedrooms on the main level
- Flooring: Carpet; Laminate
- Bathrooms: 2 full bathrooms on the main level
- Heating & cooling: Central heating; Central air
- Interior features: No additional interior features listed
- Laundry & utility: Laundry inside
Neighborhood map
What this means for you Summary
Snapshot
- This is a 2-bed/2.0-bath manufactured listed at $57k.
Deal economics
- At list price, monthly cash flow is $420 ($5k/yr) — positive.
- The deal already cash-flows at list — no discount required.
- Meets the 1% rule at list price ($2k rent vs $57k).
- Recommended offer: $50k (12.0% below list) — sets the bar for market timing.
- Cap rate 15.1% vs local median 3.9% in Port St. Lucie — top-decile yield for the area; either an underpriced asset or a hidden risk that comps aren't pricing in. Stress-test before assuming the spread holds.
Location & tenants
- Location reads: area grade B — affects rentability + tenant quality, not the cash-flow math above.
- St. Lucie (urban): math 40% / reading 48% proficiency, ranked #51 of 73 in FL (top 70%) — families likely to look elsewhere, expect single-tenant / working-renter base with shorter leases.
- Market conditions: Rents rising (+1.9%/yr); 639 active listings in the ZIP; 31 comparable units currently listed for rent nearby; rentals at typical pace (median 14d on market — plan ~3-4 weeks tenant-placement turnaround); 4,868 units permitted in St. Lucie County in 2024 (268 in 5+ unit buildings).
- This rent runs 38% of the median local income ($62k/yr) — at the standard rent-burdened threshold; future hikes will face affordability resistance.
Forward outlook
- Local home prices are declining (-3.0%/yr); year-one equity from $394 of loan paydown is wiped out by about $2k of value loss. Plan a longer hold.
- St. Lucie County population projected at +20% by 2050 — long-run rental-demand tailwind backs the buy-and-hold thesis.
- At projected returns (-3.0% appreciation + 1.9% rent growth), your $16k cash investment doubles in ~4 years — after that, you're playing with house money.
Negotiation context
- It's been on market 252 days — a 12% lower offer ($50k) is reasonable based on typical stale-listing flexibility.
- 4 sale attempts since 3y ago; this cycle's ask has dropped $13k (18%) from the opening price — seller is motivated, your offer sets the floor, not the list.
Risks & watch-outs
- Watch-outs: HOA is 37% of rent.
- Climate carrying-cost: severe wind risk, 99% chance of damaging wind over 30y; extreme-heat days projected 7→22/yr by 2055 (HVAC capex compounding) — expect insurance premiums to compound above CPI over the hold.
Questions for the listing agent
- It's been on market 252 days. Have you received any prior offers? Is the seller open to a 12% concession, seller financing, or rate buy-down credit?
- What does the HOA fee cover, when was the last increase, and are there any pending special assessments or reserve-fund shortfalls?
- Why hasn't it sold? Are there any deal-killer items the seller is aware of (foundation, flood, title, zoning, code violations)?
- Is there a deadline driving the sale (1031 exchange, divorce, estate, relocation)? That informs how much negotiation room exists.
- What's the average days-on-market for RENTAL listings here right now (not sales)? A rising rental-DOM trend means longer vacancies and softer asking-rent achievability than the comps imply.
- What's the recent tenant-quality profile in this submarket — average credit score on applications, eviction rate, late-payment / NSF rate, and stable-employment percentage? A property-management company in the area should have these aggregated.
- How much new for-sale + rental construction is in the pipeline within 1–3 miles? Heavy new supply typically softens prices + rents 12–24 months out; constrained supply supports both.
Investment metrics
- 1% rule
- 3.41% ✓
- Cap rate
- 15.14%
- Cash-on-cash
- 31.60%
- DSCR
- 2.41
- GRM
- 2.4
CMA / ARV
- ARV (on-the-fly)
- $77,376
- Comps found
- 10
Show comp detail 10 sales within ~0.75 mi
| Address | Dist | Beds/Ba | Sqft | Sold | Price | $/sf | Match |
|---|---|---|---|---|---|---|---|
| 7 Giralda | 0.38mi | 2/2.0 | 1,200 (-4%) | 4mo | $21,000 | $18 | 72 |
| 10 Padre | 0.61mi | 2/2.0 | 1,280 (+3%) | 4mo | $38,000 | $30 | 64 |
| 8504 Gallberry Cir | 0.75mi | 2/2.0 | 1,264 (+1%) | 4mo | $178,000 | $141 | 60 |
| 110 W Caribbean | 0.37mi | 2/2.0 | 1,416 (+14%) | 5mo | $77,500 | $55 | 56 |
| 7 Oliva Rd | 0.50mi | 2/2.0 | 1,350 (+8%) | 18mo | $90,000 | $67 | 48 |
| 192 W Caribbean | 0.55mi | 2/2.0 | 1,416 (+14%) | 6mo | $49,000 | $35 | 47 |
| 2960 Fiddlewood Cir | 0.75mi | 2/2.0 | 1,246 (-0%) | 22mo | $225,000 | $181 | 46 |
| 8164 Buckthorn Cir | 0.64mi | 2/2.0 | 1,338 (+7%) | 18mo | $83,000 | $62 | 43 |
| 8526 Lidflower Ct | 0.57mi | 3/2.5 (+1) | 1,404 (+12%) | 6mo | $70,900 | $50 | 40 |
| 188 W West Caribbean W | 0.55mi | 2/2.0 | 1,400 (+12%) | 17mo | $106,000 | $76 | 40 |
Match score weights: distance 35% · size 25% · config 20% · recency 20%. Top-matched comps best support the ARV.
Projected returns pro-forma
-3.0% appreciation · 1.92% rent growth · sell at horizon
- IRR
- 24.7%
- Equity multiple
- 2.00×
- Total profit
- $15,917
- Equity at exit
- $8,499
- IRR
- 31.5%
- Equity multiple
- 3.62×
- Total profit
- $41,860
- Equity at exit
- $4,928
Cash invested: $15,960 (down + closing). Projections, not guarantees.
Landlord ↔ Tenant lean methodology
- Overall (STATE)
- 87 Strongly Landlord-Friendly
- State Florida
- 87 Strongly Landlord-Friendly · R+3
- County
- — inherits STATE
- City
- — inherits STATE
ZIP-level market 34952
- Home prices YoY
- -29.6%
- Rents YoY
- 1.9%
- Active inventory
- 639
- Price-to-rent
- 2.4×
Monthly cashflow live
- Estimated rent
- $1,945 high interval (Pro) →
- Mortgage (P&I)
- −$299
- Tax est. 1.5%
- −$71 /mo · $855/yr
- Insurance
- −$24
- HOA
- −$722
- Vacancy / Maint / Mgmt
- −$408
- Net cashflow
- $420
Break-even live
UW: 25.0% down · 7.5% · 30yr · 1.5% tax · 5.0% vac · 8.0% maint · 8.0% mgmt
Financing live
Cash to close
- Down payment
- $14,250
- Closing costs
- $1,710
- Reserves months
- —
- Total cash needed
- —
Loan-product check · same deal, 3 products live
Conventional
25% down · 7.5% · 30yr
- Down + closing
- —
- Monthly P&I
- —
- Monthly cashflow
- —
- DSCR
- —
- Eligible?
- —
Personal DTI + credit; lowest rate.
DSCR
20% down · 8.5% · 30yr
- Down + closing
- —
- Monthly P&I
- —
- Monthly cashflow
- —
- DSCR
- —
- Eligible?
- —
No personal income docs; deal must DSCR.
Hard money
10% down · 12.0% · 12mo
- Down + closing
- —
- Monthly P&I
- —
- Monthly cashflow
- —
- DSCR
- —
- Eligible?
- —
Short-term bridge; refi at stabilization.
Rent comps 31 comps
| Address | Beds | Baths | Sqft | Rent | $/sqft | DOM | Units | Dist |
|---|---|---|---|---|---|---|---|---|
| 71 W Caribbean Port St. Lucie, FL | 2.0 | 2.0 | 1417 | $1,700 | $1.20 | 23d | 1 | 0.11mi |
| 1811 SE Walton Lakes Dr Port Saint Lucie, FL | 2.0 | 1.0–2.0 | 1117 | $1,926 | $1.72 | 14d | 6 | 0.16mi |
| 1810 SE Pinewood Trl Port Saint Lucie, FL | 1.0–2.0 | 1.0–2.0 | 1013 | $2,055 | $2.03 | 14d | 7 | 0.36mi |
| 2058 SE Wild Meadow Cir #101 Port St Lucie, FL | 2.0 | 2.5 | 1425 | $2,200 | $1.54 | 14d | 1 | 0.46mi |
| 2130 SE Wild Meadow Cir Port Saint Lucie, FL | 2.0 | 2.0 | 1440 | $1,695 | $1.18 | 14d | 1 | 0.55mi |
| 1131 SE Parrish Ct Port Saint Lucie, FL | 2.0 | 1.0 | 902 | $2,000 | $2.22 | 23d | 1 | 0.57mi |
| 1503 SE Royal Green Cir Unit V104 Port St. Lucie, FL | 2.0 | 2.0 | 865 | $1,750 | $2.02 | 23d | 1 | 0.68mi |
| 1565 SE Royal Green Cir #108 Port St Lucie, FL | 1.0 | 1.0 | 705 | $1,595 | $2.26 | 14d | 1 | 0.72mi |
| 1516 SE Royal Green Cir #202 Port St Lucie, FL | 3.0 | 2.0 | 921 | $2,100 | $2.28 | 23d | 1 | 0.73mi |
| 1520 SE Royal Green Cir Unit K-203 Port St. Lucie, FL | 2.0 | 2.0 | 886 | $1,800 | $2.03 | 23d | 1 | 0.74mi |
| 1455 SE Colchester Cir Port Saint Lucie, FL | 2.0 | 2.0 | 921 | $1,795 | $1.95 | 14d | 1 | 0.74mi |
| 1550 SE Royal Green Cir Port St. Lucie, FL | 2.0 | 2.0 | 782 | $1,850 | $2.37 | 14d | 1 | 0.75mi |
| 1524 SE Royal Green Cir Unit Q102 Port St. Lucie, FL | 2.0 | 2.0 | 865 | $1,800 | $2.08 | 14d | 1 | 0.75mi |
| 1562 SE Royal Green Cir Unit T-204 Port St. Lucie, FL | 2.0 | 2.0 | 782 | $1,900 | $2.43 | 23d | 1 | 0.76mi |
| 1566 SE Royal Green Cir #203 Port St Lucie, FL | 2.0 | 2.0 | 782 | $2,000 | $2.56 | 14d | 1 | 0.78mi |
| 2209 SE East Dunbrooke Cir Port Saint Lucie, FL | 3.0 | 2.0 | 1212 | $2,950 | $2.43 | 14d | 1 | 0.79mi |
| 1500 SE Tiffany Club Pl Port Saint Lucie, FL | 1.0–3.0 | 1.0–2.0 | 895 | $1,922 | $2.15 | 14d | 7 | 0.80mi |
| 3784 Sapodilla Ct Port Saint Lucie, FL | 2.0 | 2.0 | 1121 | $2,300 | $2.05 | 23d | 1 | 0.81mi |
| 1537 SE Royal Green Cir Unit E204 Port St. Lucie, FL | 2.0 | 2.0 | 886 | $1,750 | $1.98 | 14d | 1 | 0.84mi |
| 1900 Bella Vista Way Port Saint Lucie, FL | 1.0–2.0 | 1.0–2.0 | 995 | $1,764 | $1.77 | 14d | 15 | 0.87mi |
| 1550 SE Royal Green Cir Unit P-203 Port St. Lucie, FL | 2.0 | 2.0 | 782 | $1,750 | $2.24 | 23d | 1 | 0.87mi |
| 1536 SE Royal Green Cir #101 Port St Lucie, FL | 2.0 | 2.0 | 782 | $1,750 | $2.24 | 23d | 1 | 0.89mi |
| 1548 SE Royal Green Cir Unit M-103 Port St. Lucie, FL | 2.0 | 2.0 | 886 | $1,800 | $2.03 | 23d | 1 | 0.90mi |
| 1548 SE Royal Green Cir #108 Port St Lucie, FL | 1.0 | 1.0 | 705 | $1,650 | $2.34 | 14d | 1 | 0.90mi |
| 1618 SE Elkhart Ter Port Saint Lucie, FL | 3.0 | 2.0 | 1176 | $2,200 | $1.87 | 23d | 1 | 0.99mi |
| 2051 SE Hillmoor Dr Port Saint Lucie, FL | 1.0–2.0 | 1.0–2.0 | 1014 | $2,539 | $2.50 | 23d | 15 | 1.29mi |
| 1350 SE La Haven Ct Port Saint Lucie, FL | 2.0 | 2.0 | 1041 | $2,100 | $2.02 | 23d | 1 | 1.29mi |
| 1456 SE Rivergreen Cir Port Saint Lucie, FL | 2.0 | 2.0 | 921 | $1,825 | $1.98 | 14d | 1 | 1.29mi |
| 9905 S US Highway 1 Port Saint Lucie, FL | 1.0–2.0 | 1.0–2.0 | 966 | $2,239 | $2.32 | 14d | 15 | 1.29mi |
| 1900 SE Hillmoor Dr Port Saint Lucie, FL | 2.0–3.0 | 2.0–2.5 | 1182 | $1,799 | $1.52 | 14d | 14 | 1.30mi |
| 2061 SE Glen Ridge Dr Port Saint Lucie, FL | 2.0 | 2.5 | 1350 | $1,925 | $1.43 | 23d | 1 | 1.37mi |
HOA detail
- Monthly dues
- $722 · $8,664/yr
Listing history 24 events
-
2026-06-18days on market $57,000 Active 252 DOM
-
2026-06-17days on market $57,000 Active 251 DOM
-
2026-06-16days on market $57,000 Active 250 DOM
-
2026-06-15days on market $57,000 Active 249 DOM
-
2026-06-14days on market $57,000 Active 247 DOM
-
2026-06-13days on market $57,000 Active 246 DOM
-
2026-06-10days on market $57,000 Active 244 DOM
-
2026-06-09days on market $57,000 Active 243 DOM
-
2026-06-08days on market $57,000 Active 242 DOM
-
2026-06-07days on market $57,000 Active 241 DOM
-
2026-06-05days on market $57,000 Active 238 DOM
-
2026-06-03days on market $57,000 Active 237 DOM
-
2026-06-02days on market $57,000 Active 236 DOM
-
2026-06-01days on market $57,000 Active 235 DOM
-
2026-05-31days on market $57,000 Active 234 DOM
-
2026-05-30days on market $57,000 Active 233 DOM
-
2026-04-22price $57,000
-
2025-10-09$69,900 Active
-
2025-02-01historical
-
2024-11-08$59,900 Active
-
2023-12-01historical
-
2023-11-24status Active
-
2023-08-19historical
-
2023-08-18$78,000 Active
ⓘ Source: listings_history table (triggers on properties + properties_extension) + one-shot
backfill from property_details.listing_events for pre-trigger history.
Climate risk First Street
- Flood 1/10 Low FEMA zone X (unshaded) · 0% chance over 30 yrs
- Wildfire 3/10 Moderate
- Heat 10/10 Extreme 7 d/yr ≥106°F today · 22 d/yr by 30 yrs out
- Wind 10/10 Extreme 99% chance of damaging wind over 30 yrs
- Air quality 2/10 Low 1 unhealthy d/yr today · 1 by 30 yrs out
Nearby sold comps map
Loading sold comps map…
Walkable amenities ~0.75 mi
Loading nearby amenities…
Taxation est. · year 1
- Rental income
- $23,335
- − Mortgage interest
- −$3,193
- − Property taxes
- −$855
- − Insurance
- −$285
- − Repairs & maintenance
- −$1,867
- − Management
- −$1,867
- − HOA
- −$8,664
- − Depreciation
- −$1,658
- Taxable income
- $4,947
- Est. tax owed @ 24.0%
- −$1,187
- After-tax cash flow
- $3,857/yr
For passive investors: Depreciation is non-cash, so a rental often shows a tax loss while cash-flowing — sheltering income. Rental losses are passive: they offset passive income freely, and up to $25,000/yr can offset ordinary (W-2) income if you actively participate and your MAGI is under $100k (phasing out to $0 by $150k); unused losses carry forward. On sale, claimed depreciation is recaptured at up to 25%, and gains may owe capital-gains tax (a 1031 exchange can defer both). Figures are a year-1 estimate at your 24.0% rate — not tax advice; consult a CPA.
Schools (NCES district)
- District
- St. Lucie
- NCES district ID
- 1201770
- Math proficiency
- 40% ▼ -11.00%
- Reading proficiency
- 48% ▼ -4.00%
- Median HH income
- $44,737
- Composite
- 37.28/100
- National rank
- #4449
- State rank
- #51 of 73 in FL
Livability — Port St. Lucie
No livability data for this city. (Only ~50 U.S. cities are tracked.)
Census & demographics
- Census place
- Port St. Lucie, FL
- County
- Saint Lucie County · 337,150 people
- City population
- 221,051
- Metro
- Port St. Lucie, FL
- Population (ZIP)
- 42,655
- Household income
- $61,628
- Rent vs Own
- Severe rent burden
- 1759.0
Population outlook (St. Lucie County) Hauer SSP2
- Today (2025)
- 338,016 people
- By 2030
- 355,687 · +5.2%
- By 2040
- 385,521 · +14.1%
- By 2050
- 406,106 · +20.1%
- By 2075
- 441,054 · +30.5%
- By 2100
- 436,885 · +29.2%
Race, ethnicity, and origin ACS 2023
- Neighborhood character
- Diverse neighborhood (Simpson 0.57)
- Race & ethnicity
- White 62% Hispanic / Latino 19% Two or more races 14% Black 10% Asian 3%
- Hispanic origin (detail)
- Mexican 4% Puerto Rican 4% Cuban 2% Dominican 2%
- Common ancestry
- Romanian 3% Lithuanian 2% Hispanic 1%
- Foreign-born
- 18% · Canada, Jamaica, China
- Languages at home
- 76% English-only · Spanish 16% French/Haitian/Cajun 3% Tagalog/Filipino 2%
Political lean MEDSL · St. Lucie
- 2024 margin
- Lean R (+9.1) · D 45.1% · R 54.2%
- 2008→2024 swing
- -21.2pp toward R · 2008: 12.1pp · 2024: -9.1pp
- All cycles
- 2024: R+9.1 2020: R+1.6 2016: R+2.5 2012: D+7.9 2008: D+12.1
Not yet ingested
- Civics
- —
Market trends
- HPI YoY
- ▼ -155.80%
- Current HPI
- 371.0573
- Rent YoY
- ▲ 1.92%
- Metro
- Port St. Lucie, FL
- State GDP YoY
- ▲ 3.28%
- F500 in state
- 36
Industry mix (Fortune 500 HQ in FL)
| Industry | F500 HQs | Revenue |
|---|---|---|
| Industrial Technology | 2 | $29B |
|
||
| Insurance | 2 | $17B |
|
||
| Retail | 1 | $60B |
|
||
| Technology Distribution | 1 | $58B |
|
||
| Homebuilding | 1 | $35B |
|
||
| Technology Manufacturing | 1 | $35B |
|
||
Price history
-26.9% since first listed8 events — show timeline
- 2026-04-22 Price Changed $57,000 Beaches MLS
- 2025-10-09 Listed $69,900 Beaches MLS
- 2025-02-01 Listing Removed — Beaches MLS
- 2024-11-08 Listed $59,900 Beaches MLS
- 2023-12-01 Listing Removed — Beaches MLS
- 2023-11-24 Relisted — Beaches MLS
- 2023-08-19 Listing Removed — Beaches MLS
- 2023-08-18 Listed $78,000 Beaches MLS
Cash-flow waterfall
monthlySold comps — $/sqft
last 12 mo · ≤1 miLoading sold comps…