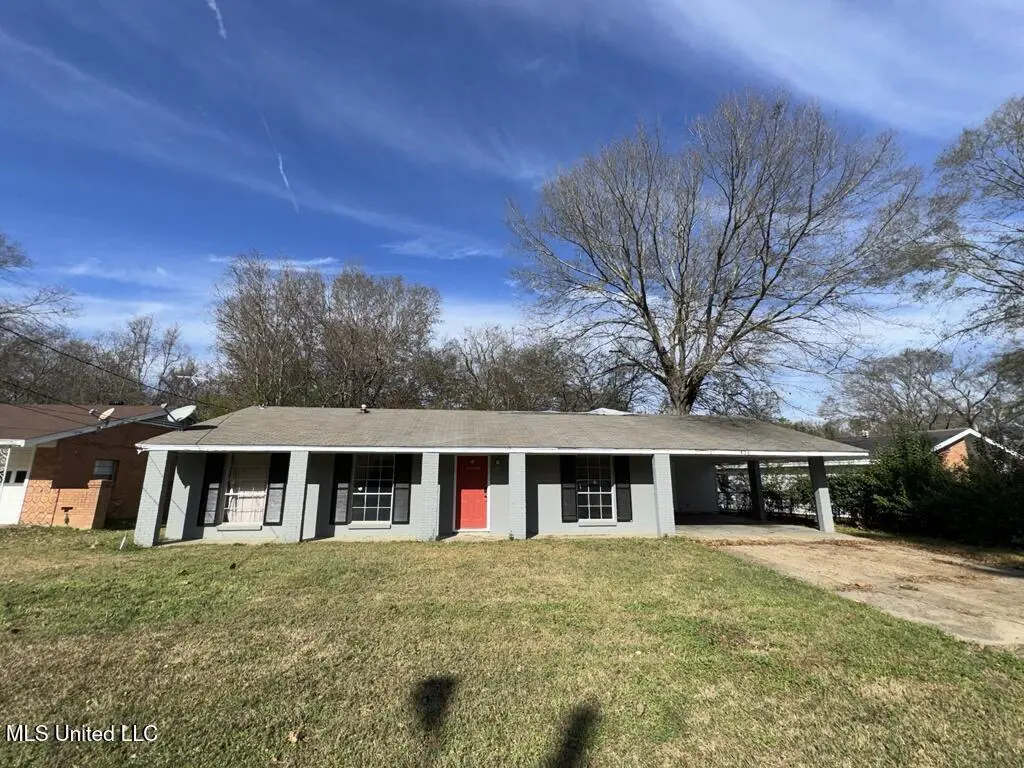
936 Westway St · Jackson, MS
Flood risk 1/10 · Minimal
- FEMA flood zone
- X (shaded)
- Chance of flooding over 30 yrs
- 0.0%
- Est. flood insurance / yr
- $507 – $1,088
Fire risk 2/10 · Minimal
- Est. fire insurance / yr
- $1,241 – $2,305
Heat risk 7/10 · Major
- Hot days now (above 108°F)
- 7 days/yr
- Hot days in 30 yrs
- 20 days/yr
Wind risk 8/10 · Major
- Chance of severe wind over 30 yrs
- 80.0%
Air-quality risk 1/10 · Minimal
- Unhealthy air days now
- 0 days/yr
- Unhealthy air days in 30 yrs
- 0 days/yr
Risk factors via First Street. Map © Google.
Why this score? — see what drove the C+ grade
The composite is a weighted blend of 9 inputs, each scored 0–100. Each bar is that input's sub-score; the figure is the points it added to the 100-point composite (weight × sub-score).
- Cash flow +30.0/30.0
- 1% rule +10.0/10.0
- DSCR +10.0/10.0
- Rent growth +3.6/5.0
- Livability +3.4/5.0
- Condition / age +2.5/5.0
- Schools +1.1/10.0
- ARV discount +0.0/15.0
- Appreciation +0.0/10.0
$69,000
🖨 Deal sheet 📄 Offer letter ✓ Due diligence
Listing remarks MLS
Investment Opportunity! This property offers strong potential for renovation or rental portfolio expansion. Call your Realtor today! Property is sold as-is with all faults. Seller has never been an owner-occupant; therefore, Seller's information is limited. Seller has never been an owner-occupant; therefore, Seller's information is limited. Seller will not assume responsibility for any required repairs to the home to qualify for financing. Seller Addendum is required and must be delivered along with the Purchase Offer, disclosures, and proof of funds/pre-approval. See MLS docs. Utilities are inactive, and the home is winterized. Property is being sold in Receivership and requires approval from the United States District Court for the Southern District of New York prior to closing. Seller will not make or pay for any repairs required for financing. Utilities are inactive, and the home is winterized. Property is being sold in Receivership and requires approval from the United States District Court for the Southern District of New York prior to closing. Seller will not make or pay for any repairs required for financing. Utilities are inactive, and the home is winterized. Seller Addendum (see documents) must be executed and submitted with all offers, along with all required disclosures and proof of funds.
Key facts
- 0.26 acre lot
- 2 parking spots
- Built 1962
Neighborhood map
What this means for you Summary
Snapshot
- This is a 4-bed/2.5-bath single-family listed at $69k.
Deal economics
- At list price, monthly cash flow is $576 ($7k/yr) — positive.
- The deal already cash-flows at list — no discount required.
- Meets the 1% rule at list price ($1k rent vs $69k).
- Recommended offer: $61k (12.0% below list) — sets the bar for market timing.
- Cap rate 16.3% vs local median 9.9% in Jackson — top-decile yield for the area; either an underpriced asset or a hidden risk that comps aren't pricing in. Stress-test before assuming the spread holds.
Location & tenants
- Location reads 68/100 on livability (#66 in MS) — a middle-class / working-renter tenant base. Strengths: commute A+, cost of living A+, housing A+; Watch: schools F, amenities F, employment F.
- Jackson Public School District (urban): math 9% / reading 18% proficiency, ranked #112 of 130 in MS (top 86%) — low school quality limits family demand, transient renter base, plan for 1-2y turnover; 88% free/reduced lunch — lower-income household profile, screen leases tightly.
- Market conditions: Rents rising fast (+4.2%/yr); 302 active listings in the ZIP; 38 comparable units currently listed for rent nearby; rentals at typical pace (median 23d on market — plan ~3-4 weeks tenant-placement turnaround); 167 units permitted in Hinds County in 2024 (0 in 5+ unit buildings).
- This rent runs 31% of the median local income ($51k/yr) — at the standard rent-burdened threshold; future hikes will face affordability resistance.
Forward outlook
- Local home prices are declining (-3.0%/yr); year-one equity from $477 of loan paydown is wiped out by about $2k of value loss. Plan a longer hold.
- Hinds County population projected to shrink 6% by 2050 — rents likely to lag national; underwrite the cash flow, not the appreciation.
- At projected returns (-3.0% appreciation + 4.2% rent growth), your $19k cash investment doubles in ~4 years — after that, you're playing with house money.
Negotiation context
- It's been on market 152 days — a 12% lower offer ($61k) is reasonable based on typical stale-listing flexibility.
- 3 sale attempts since 11y ago with the ask held roughly flat each time — persistent listings suggest the price (not the market) is what's stuck; bring a comps-based counter.
Risks & watch-outs
- Climate carrying-cost: severe wind risk, 80% chance of damaging wind over 30y; extreme-heat days projected 7→20/yr by 2055 (HVAC capex compounding) — expect insurance premiums to compound above CPI over the hold.
Questions for the listing agent
- It's been on market 152 days. Have you received any prior offers? Is the seller open to a 12% concession, seller financing, or rate buy-down credit?
- Built in 1962 — when were the roof, HVAC, electrical panel, plumbing, and water heater last replaced?
- Why hasn't it sold? Are there any deal-killer items the seller is aware of (foundation, flood, title, zoning, code violations)?
- Is there a deadline driving the sale (1031 exchange, divorce, estate, relocation)? That informs how much negotiation room exists.
- Schools are F-rated, which usually means shorter tenancies and higher turnover. Who's the typical renter profile here, and what's been the actual vacancy rate?
- What's the average days-on-market for RENTAL listings here right now (not sales)? A rising rental-DOM trend means longer vacancies and softer asking-rent achievability than the comps imply.
- What's the recent tenant-quality profile in this submarket — average credit score on applications, eviction rate, late-payment / NSF rate, and stable-employment percentage? A property-management company in the area should have these aggregated.
- How much new for-sale + rental construction is in the pipeline within 1–3 miles? Heavy new supply typically softens prices + rents 12–24 months out; constrained supply supports both.
Investment metrics
- 1% rule
- 1.92% ✓
- Cap rate
- 16.31%
- Cash-on-cash
- 35.77%
- DSCR
- 2.59
- GRM
- 4.3
CMA / ARV
- ARV (median comp)
- $58,000
- List price
- $69,000
- Delta
- 18.97%
- Verdict
- OVERPRICED
- Comps
- 20 within 1.0 mi
Show comp detail 12 sales within ~0.75 mi
| Address | Dist | Beds/Ba | Sqft | Sold | Price | $/sf | Match |
|---|---|---|---|---|---|---|---|
| 953 Woody Dr | 0.49mi | 4/2.0 | 1,595 (+0%) | 3mo | $5,900 | $4 | 72 |
| 1027 Autumn St | 0.28mi | 3/2.0 (-1) | 1,694 (+6%) | 1mo | $84,900 | $50 | 68 |
| 2971 Kentwood Dr | 0.54mi | 4/2.0 | 1,532 (-4%) | 3mo | $59,900 | $39 | 64 |
| 3114 Suncrest Dr | 0.38mi | 4/2.0 | 1,432 (-10%) | 3mo | $64,900 | $45 | 61 |
| 3007 Oak Forest Dr | 0.61mi | 4/2.0 | 1,520 (-4%) | 6mo | $99,700 | $66 | 58 |
| 1422 Wooddell Dr | 0.66mi | 4/2.0 | 1,540 (-3%) | 6mo | $99,000 | $64 | 57 |
| 1423 Woody Dr | 0.34mi | 3/1.5 (-1) | 1,404 (-12%) | 2mo | $24,900 | $18 | 54 |
| 920 Woody Dr | 0.57mi | 3/2.0 (-1) | 1,468 (-8%) | 2mo | $59,000 | $40 | 52 |
| 1244 Cooper Rd | 0.71mi | 3/2.0 (-1) | 1,680 (+6%) | 2mo | $65,000 | $39 | 50 |
| 3156 Woodview Dr | 0.38mi | 3/1.0 (-1) | 1,409 (-12%) | 4mo | $65,000 | $46 | 48 |
| 3115 Shirley Dr | 0.65mi | 3/2.0 (-1) | 1,432 (-10%) | 7mo | $49,900 | $35 | 40 |
| 1416 Wooddell Dr | 0.63mi | 3/2.0 (-1) | 1,357 (-15%) | 4mo | $35,000 | $26 | 35 |
Match score weights: distance 35% · size 25% · config 20% · recency 20%. Top-matched comps best support the ARV.
Projected returns pro-forma
-3.0% appreciation · 4.23% rent growth · sell at horizon
- IRR
- 32.8%
- Equity multiple
- 2.41×
- Total profit
- $27,173
- Equity at exit
- $10,288
- IRR
- 40.5%
- Equity multiple
- 5.03×
- Total profit
- $77,929
- Equity at exit
- $5,966
Cash invested: $19,320 (down + closing). Projections, not guarantees.
Landlord ↔ Tenant lean methodology
- Overall (STATE)
- 90 Strongly Landlord-Friendly
- State Mississippi
- 90 Strongly Landlord-Friendly · R+11
- County
- — inherits STATE
- City
- — inherits STATE
ZIP-level market 39212
- Home prices YoY
- -11.7%
- Rents YoY
- 4.2%
- Active inventory
- 302
- Price-to-rent
- 4.3×
Monthly cashflow live
- Estimated rent
- $1,323 high interval (Pro) →
- Mortgage (P&I)
- −$362
- Tax from tax record
- −$78 /mo · $940/yr
- Insurance
- −$29
- HOA
- −$0
- Vacancy / Maint / Mgmt
- −$278
- Net cashflow
- $576
Break-even live
UW: 25.0% down · 7.5% · 30yr · 1.5% tax · 5.0% vac · 8.0% maint · 8.0% mgmt
Financing live
Cash to close
- Down payment
- $17,250
- Closing costs
- $2,070
- Reserves months
- —
- Total cash needed
- —
Loan-product check · same deal, 3 products live
Conventional
25% down · 7.5% · 30yr
- Down + closing
- —
- Monthly P&I
- —
- Monthly cashflow
- —
- DSCR
- —
- Eligible?
- —
Personal DTI + credit; lowest rate.
DSCR
20% down · 8.5% · 30yr
- Down + closing
- —
- Monthly P&I
- —
- Monthly cashflow
- —
- DSCR
- —
- Eligible?
- —
No personal income docs; deal must DSCR.
Hard money
10% down · 12.0% · 12mo
- Down + closing
- —
- Monthly P&I
- —
- Monthly cashflow
- —
- DSCR
- —
- Eligible?
- —
Short-term bridge; refi at stabilization.
Rent comps 38 comps
| Address | Beds | Baths | Sqft | Rent | $/sqft | DOM | Units | Dist |
|---|---|---|---|---|---|---|---|---|
| 3308 Ramona St Jackson, MS | 3.0 | 1.0 | 1104 | $1,150 | $1.04 | 21d | 1 | 0.11mi |
| 1010 Deryll St Jackson, MS | 3.0 | 2.0 | 1143 | $1,050 | $0.92 | 13d | 1 | 0.21mi |
| 1018 Deryll St Jackson, MS | 3.0 | 1.0 | 1056 | $900 | $0.85 | 23d | 1 | 0.23mi |
| 1054 Deryll St Jackson, MS | 3.0 | 1.5 | 1132 | $1,050 | $0.93 | 13d | 1 | 0.29mi |
| 1219 Woody Dr Jackson, MS | 3.0 | 1.0 | 1058 | $1,150 | $1.09 | 23d | 1 | 0.30mi |
| 3341 Suncrest Dr Jackson, MS | 4.0 | 1.0 | 1292 | $1,225 | $0.95 | 43d | 1 | 0.38mi |
| 3049 Lakewood Dr Jackson, MS | 3.0 | 1.0 | 1200 | $975 | $0.81 | 43d | 1 | 0.42mi |
| 3020 Lakewood Dr Jackson, MS | 4.0 | 2.0 | 1600 | $1,150 | $0.72 | 23d | 1 | 0.49mi |
| 3162 Oak Forest Dr Jackson, MS | 3.0 | 1.5 | 1280 | $1,236 | $0.97 | 43d | 1 | 0.50mi |
| 3122 Oak Forest Dr Jackson, MS | 3.0 | 2.0 | 1421 | $1,100 | $0.77 | 43d | 1 | 0.52mi |
| 2915 Longwood Dr Jackson, MS | 3.0 | 2.0 | 1800 | $1,400 | $0.78 | 23d | 1 | 0.55mi |
| 2904 Marwood Dr Jackson, MS | 3.0 | 2.0 | 1554 | $1,250 | $0.80 | 23d | 1 | 0.58mi |
| 2808 Ridgeland Dr Jackson, MS | 3.0 | 2.0 | 1606 | $1,600 | $1.00 | 43d | 1 | 0.59mi |
| 3030 Oak Forest Dr Jackson, MS | 3.0 | 1.5 | 1200 | $1,100 | $0.92 | 43d | 1 | 0.60mi |
| 3030 Oak Forest Dr Jackson, MS | 3.0 | 2.0 | 1200 | $1,100 | $0.92 | 13d | 1 | 0.60mi |
| 3151 Shirley Dr Jackson, MS | 4.0 | 2.0 | 1474 | $1,306 | $0.89 | 13d | 1 | 0.62mi |
| 3147 Shirley Dr Jackson, MS | 4.0 | 2.0 | 2137 | $1,425 | $0.67 | 13d | 1 | 0.62mi |
| 3147 Shirley Dr Jackson, MS | 4.0 | 2.0 | 2137 | $1,425 | $0.67 | 43d | 1 | 0.62mi |
| 1641 Woodburn St Jackson, MS | 5.0 | 2.0 | 1300 | $1,812 | $1.39 | 13d | 1 | 0.65mi |
| 1223 Marydale Dr Jackson, MS | 3.0 | 1.0 | 1300 | $950 | $0.73 | 43d | 1 | 0.81mi |
| 2873 Teresa Dr Jackson, MS | 3.0 | 1.0 | 1100 | $1,100 | $1.00 | 43d | 1 | 0.87mi |
| 427 McDowell Park Cir Jackson, MS | 3.0 | 1.5 | 1308 | $1,200 | $0.92 | 13d | 1 | 0.90mi |
| 103 Sykes Park Cir Jackson, MS | 3.0 | 2.0 | 1500 | $1,250 | $0.83 | 43d | 1 | 1.01mi |
| 3511 Sykes Park Dr Jackson, MS | 3.0 | 2.0 | 1225 | $1,426 | $1.16 | 13d | 1 | 1.01mi |
| 3147 Bilgray Dr Jackson, MS | 3.0 | 2.0 | 1850 | $1,306 | $0.71 | 43d | 1 | 1.02mi |
| 3152 Bilgray Dr Jackson, MS | 3.0 | 1.5 | 1200 | $1,100 | $0.92 | 13d | 1 | 1.05mi |
| 2729 Carleton St Jackson, MS | 4.0 | 2.0 | 1666 | $1,575 | $0.95 | 13d | 1 | 1.09mi |
| 2732 Woodside Dr Jackson, MS | 4.0 | 2.0 | 1566 | $1,050 | $0.67 | 23d | 1 | 1.11mi |
| 1126 Barbara Ann Dr Jackson, MS | 3.0 | 1.0 | 1343 | $1,000 | $0.74 | 13d | 1 | 1.16mi |
| 1126 Barbara Ann Dr Jackson, MS | 3.0 | 1.0 | 1343 | $1,000 | $0.74 | 43d | 1 | 1.16mi |
| 2694 Woodside Dr Jackson, MS | 3.0 | 1.0 | 1509 | $1,075 | $0.71 | 13d | 1 | 1.17mi |
| 2694 Woodside Dr Jackson, MS | 3.0 | 1.0 | 1509 | $1,075 | $0.71 | 23d | 1 | 1.17mi |
| 1513 Maria Dr Jackson, MS | 3.0 | 2.0 | 1120 | $1,200 | $1.07 | 23d | 1 | 1.18mi |
| 1513 Maria Dr Jackson, MS | 3.0 | 2.0 | 1120 | $1,200 | $1.07 | 13d | 1 | 1.18mi |
| 360 Cooper Rd Jackson, MS | 4.0 | 2.0 | 1624 | $1,575 | $0.97 | 13d | 1 | 1.27mi |
| 270 Wildwood Ct Jackson, MS | 3.0 | 1.0 | 1200 | $1,200 | $1.00 | 21d | 1 | 1.45mi |
| 316 Woody Dr Jackson, MS | 3.0 | 1.0 | 1185 | $1,250 | $1.05 | 43d | 1 | 1.48mi |
| 316 Woody Dr Jackson, MS | 3.0 | 1.0 | 1185 | $1,250 | $1.05 | 13d | 1 | 1.48mi |
Listing history 26 events
-
2026-06-18days on market $69,000 Active 152 DOM
-
2026-06-17days on market $69,000 Active 151 DOM
-
2026-06-16days on market $69,000 Active 150 DOM
-
2026-06-15days on market $69,000 Active 149 DOM
-
2026-06-14days on market $69,000 Active 147 DOM
-
2026-06-13days on market $69,000 Active 146 DOM
-
2026-06-10days on market $69,000 Active 144 DOM
-
2026-06-09days on market $69,000 Active 143 DOM
-
2026-06-08days on market $69,000 Active 142 DOM
-
2026-06-07days on market $69,000 Active 141 DOM
-
2026-06-05days on market $69,000 Active 138 DOM
-
2026-06-03days on market $69,000 Active 137 DOM
-
2026-06-02days on market $69,000 Active 136 DOM
-
2026-06-01days on market $69,000 Active 135 DOM
-
2026-05-31days on market $69,000 Active 134 DOM
-
2026-05-30days on market $69,000 Active 133 DOM
-
2026-03-04price $69,000 1333-char remark
Show marketing remark (1333 chars)
Investment Opportunity! This property offers strong potential for renovation or rental portfolio expansion. Call your Realtor today! Property is sold as-is with all faults. Seller has never been an owner-occupant; therefore, Seller's information is limited. Seller has never been an owner-occupant; therefore, Seller's information is limited. Seller will not assume responsibility for any required repairs to the home to qualify for financing. Seller Addendum is required and must be delivered along with the Purchase Offer, disclosures, and proof of funds/pre-approval. See MLS docs. Utilities are inactive, and the home is winterized. Property is being sold in Receivership and requires approval from the United States District Court for the Southern District of New York prior to closing. Seller will not make or pay for any repairs required for financing. Utilities are inactive, and the home is winterized. Property is being sold in Receivership and requires approval from the United States District Court for the Southern District of New York prior to closing. Seller will not make or pay for any repairs required for financing. Utilities are inactive, and the home is winterized. Seller Addendum (see documents) must be executed and submitted with all offers, along with all required disclosures and proof of funds.
-
2026-01-17$71,546 Active 1333-char remark
Show marketing remark (1333 chars)
Investment Opportunity! This property offers strong potential for renovation or rental portfolio expansion. Call your Realtor today! Property is sold as-is with all faults. Seller has never been an owner-occupant; therefore, Seller's information is limited. Seller has never been an owner-occupant; therefore, Seller's information is limited. Seller will not assume responsibility for any required repairs to the home to qualify for financing. Seller Addendum is required and must be delivered along with the Purchase Offer, disclosures, and proof of funds/pre-approval. See MLS docs. Utilities are inactive, and the home is winterized. Property is being sold in Receivership and requires approval from the United States District Court for the Southern District of New York prior to closing. Seller will not make or pay for any repairs required for financing. Utilities are inactive, and the home is winterized. Property is being sold in Receivership and requires approval from the United States District Court for the Southern District of New York prior to closing. Seller will not make or pay for any repairs required for financing. Utilities are inactive, and the home is winterized. Seller Addendum (see documents) must be executed and submitted with all offers, along with all required disclosures and proof of funds.
-
2019-04-30historical
-
2019-04-19$55,000
-
2015-10-05soldstatus
-
2015-09-21soldstatus
-
2015-07-10$30,000
-
1990-08-01soldstatus
-
1980-12-15soldstatus
-
1968-02-27soldstatus
ⓘ Source: listings_history table (triggers on properties + properties_extension) + one-shot
backfill from property_details.listing_events for pre-trigger history.
Tax reassessment forecast MS · Resets to sale price
- Current annual tax
- $940 · $78/mo
- Projected year-2 tax
- $940 · $78/mo
- Expected delta
- $0/yr ($0/mo · 0.0%)
ⓘ Screening estimate from a state-policy table — verify with the county assessor before closing.
Climate risk First Street
- Flood 1/10 Low FEMA zone X (shaded) · 0% chance over 30 yrs
- Wildfire 2/10 Low
- Heat 7/10 Severe 7 d/yr ≥108°F today · 20 d/yr by 30 yrs out
- Wind 8/10 Severe 80% chance of damaging wind over 30 yrs
- Air quality 1/10 Low 0 unhealthy d/yr today · 0 by 30 yrs out
Nearby sold comps map
Loading sold comps map…
Walkable amenities ~0.75 mi
Loading nearby amenities…
Taxation est. · year 1
- Rental income
- $15,871
- − Mortgage interest
- −$3,865
- − Property taxes
- −$940
- − Insurance
- −$345
- − Repairs & maintenance
- −$1,270
- − Management
- −$1,270
- − Depreciation
- −$2,007
- Taxable income
- $6,175
- Est. tax owed @ 24.0%
- −$1,482
- After-tax cash flow
- $5,429/yr
For passive investors: Depreciation is non-cash, so a rental often shows a tax loss while cash-flowing — sheltering income. Rental losses are passive: they offset passive income freely, and up to $25,000/yr can offset ordinary (W-2) income if you actively participate and your MAGI is under $100k (phasing out to $0 by $150k); unused losses carry forward. On sale, claimed depreciation is recaptured at up to 25%, and gains may owe capital-gains tax (a 1031 exchange can defer both). Figures are a year-1 estimate at your 24.0% rate — not tax advice; consult a CPA.
Schools (NCES district)
- District
- Jackson Public School District
- NCES district ID
- 2802190
- Math proficiency
- 9% ▼ -14.00%
- Reading proficiency
- 18% ▼ -7.00%
- Median HH income
- $33,234
- Composite
- 10.89/100
- National rank
- #9755
- State rank
- #112 of 130 in MS
Livability — Jackson
- Score
- 68/100
- State rank
- #66
- US rank
- #9695
Category grades
Schools grade is shown separately in the Schools card above.
Census & demographics
- Census place
- Jackson, MS
- County
- Hinds County · 167,040 people
- City population
- 140,204
- Metro
- Jackson, MS
- Population (ZIP)
- 25,659
- Household income
- $50,722
- Rent vs Own
- Severe rent burden
- 1314.0
Population outlook (Hinds County) Hauer SSP2
- Today (2025)
- 242,528 people
- By 2030
- 241,113 · -0.6%
- By 2040
- 235,557 · -2.9%
- By 2050
- 226,946 · -6.4%
- By 2075
- 199,995 · -17.5%
- By 2100
- 164,165 · -32.3%
Race, ethnicity, and origin ACS 2023
- Neighborhood character
- Predominantly Black (86%)
- Race & ethnicity
- Black 86% White 9% Hispanic / Latino 3% Two or more races 3%
- Common ancestry
- Serbian 1% Lithuanian 1%
- Foreign-born
- 1% · Canada
- Languages at home
- 97% English-only · Spanish 2%
Political lean MEDSL · Hinds
- 2024 margin
- Solid D (+46.1) · D 72.4% · R 26.3% · Other 1.4%
- 2008→2024 swing
- +7.1pp toward D · 2008: 39.0pp · 2024: 46.1pp
- All cycles
- 2024: D+46.1 2020: D+48.3 2016: D+43.7 2012: D+45.1 2008: D+39.0
Not yet ingested
- Civics
- —
Market trends
- HPI YoY
- ▼ -23.01%
- Current HPI
- 174.4025
- Rent YoY
- ▲ 4.23%
- Metro
- Jackson, MS
- State GDP YoY
- —
- F500 in state
- 0
Price history
+130.0% since first listed10 events — show timeline
- 2026-03-04 Price Changed $69,000 MLSU
- 2026-01-17 Listed $71,546 MLSU
- 2019-04-30 Listing Removed — MLSU
- 2019-04-19 Listed $55,000 MLSU
- 2015-10-05 Sold (MLS) — MLSU
- 2015-09-21 Sold (Public Records) — Public Records
- 2015-07-10 Listed $30,000 MLSU
- 1990-08-01 Sold (Public Records) — Public Records
- 1980-12-15 Sold (Public Records) — Public Records
- 1968-02-27 Sold (Public Records) — Public Records
Property tax history
+1.0%/yrLatest (2025): $940 · +2.6% YoY. Source: county tax records.
Cash-flow waterfall
monthlySold comps — $/sqft
last 12 mo · ≤1 miLoading sold comps…