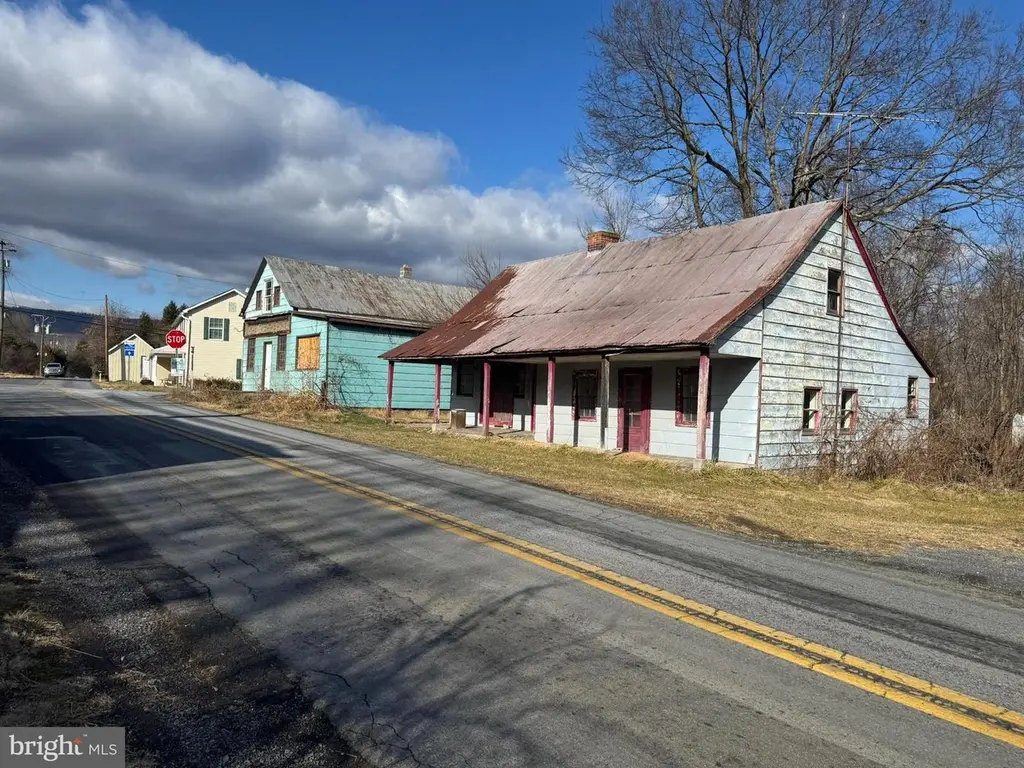
5 Tuscarora Pike · Hedgesville, WV
Flood risk 1/10 · Minimal
- FEMA flood zone
- X (unshaded)
- Chance of flooding over 30 yrs
- 0.0%
- Est. flood insurance / yr
- $473 – $860
Fire risk 3/10 · Minor
- Est. fire insurance / yr
- $787 – $1,461
Heat risk 5/10 · Moderate
- Hot days now (above 99°F)
- 7 days/yr
- Hot days in 30 yrs
- 17 days/yr
Wind risk 2/10 · Minimal
- Chance of severe wind over 30 yrs
- 2.0%
Air-quality risk 2/10 · Minimal
- Unhealthy air days now
- 0 days/yr
- Unhealthy air days in 30 yrs
- 1 days/yr
Risk factors via First Street. Map © Google.
Why this score? — see what drove the C- grade
The composite is a weighted blend of 9 inputs, each scored 0–100. Each bar is that input's sub-score; the figure is the points it added to the 100-point composite (weight × sub-score).
- Cash flow +15.4/30.0
- Appreciation +10.0/10.0
- ARV discount +7.5/15.0
- DSCR +4.7/10.0
- Livability +3.4/5.0
- 1% rule +3.0/10.0
- Schools +2.6/10.0
- Rent growth +2.5/5.0
- Condition / age +2.5/5.0
$399,900
🖨 Deal sheet (PDF) 📄 Offer letter ✓ Due diligence
Listing remarks
Great investment property! There is a 40 x 48 garage with 2-12 foot doors and 12' clear for a lift with a large loft for storage. Currently there is a mobile home that is rented and two more unoccupied homes ready to renovate. Property is made up of over 4 acres and includes stream frontage. Schedule your showing today!
Key facts
- 5.74 acre lot
- 2 garage spots
- Built 1880
Property features AI
Finance
- Financial info: Fee simple ownership; Two vacant units and one leased unit; Units are not furnished
Exterior
- Parking: Detached garage (front entry) with 2 garage spaces; Parking lot available; Total of 2 garage/parking spaces
- Utilities: Well water; On-site septic; Electric hot water
- Home design: Detached structure
- Construction: Block and wood siding construction; Permanent foundation; Assessor-listed year built
- Exterior features: Corner lot; Property includes above-grade and below-grade structures
Interior
- Bedrooms: Two 2-bedroom units and one 3-bedroom unit (multi-unit property)
- Heating & cooling: Forced air heating; Electric and oil heating fuel; Window unit cooling (electric)
- Interior features: Detached single-family layout; Assessor-determined living area
Neighborhood map
What this means for you Summary
Snapshot
- This is a 7-bed/?-bath other listed at $400k.
Deal economics
- At list price, monthly cash flow is $157 ($2k/yr) — positive.
- The deal already cash-flows at list — no discount required.
- To meet the 1% rule (rent ≥ 1% of price), the offer needs to be $321k (19.8% below list).
- Recommended offer: $321k (19.8% below list) — sets the bar for 1% rule.
- Cap rate 6.8% vs local median 4.2% in Hedgesville — top-decile yield for the area; either an underpriced asset or a hidden risk that comps aren't pricing in. Stress-test before assuming the spread holds.
Location & tenants
- Location reads 67/100 on livability (#88 in WV) — a middle-class / working-renter tenant base. Strengths: cost of living A+, housing A+, employment A; Watch: amenities F, commute F, health & safety F.
- Berkeley County Schools (other): math 21% / reading 38% proficiency, ranked #24 of 55 in WV (top 44%) — low school quality limits family demand, transient renter base, plan for 1-2y turnover.
- Market conditions: 100 active listings in the ZIP; solid renter incomes; 1,460 units permitted in Berkeley County in 2024 (16 in 5+ unit buildings).
- This rent runs 44% of the median local income ($87k/yr) — at the standard rent-burdened threshold; future hikes will face affordability resistance.
Forward outlook
- In year one you build about $43k of equity ($3k loan paydown + $40k appreciation (10.0% local appreciation)).
- Berkeley County population projected at +25% by 2050 — long-run rental-demand tailwind backs the buy-and-hold thesis.
- At projected returns (10.0% appreciation + 3.0% rent growth), your $112k cash investment doubles in ~3 years — after that, you're playing with house money.
- By year 2, paydown + projected appreciation supports a ~$69k cash-out refi (75% LTV) — recoverable capital for the next deal without selling this one.
Negotiation context
- It's been on market 72 days — a 6% lower offer ($376k) is reasonable based on typical stale-listing flexibility.
Risks & watch-outs
- Watch-outs: built in 1880 — expect roof / HVAC / electrical / plumbing capex.
- Climate carrying-cost: extreme-heat days projected 7→17/yr by 2055 (HVAC capex compounding) — expect insurance premiums to compound above CPI over the hold.
Questions for the listing agent
- It's been on market 72 days. Have you received any prior offers? Is the seller open to a 20% concession, seller financing, or rate buy-down credit?
- Built in 1880 — when were the roof, HVAC, electrical panel, plumbing, and water heater last replaced?
- Why hasn't it sold? Are there any deal-killer items the seller is aware of (foundation, flood, title, zoning, code violations)?
- Is there a deadline driving the sale (1031 exchange, divorce, estate, relocation)? That informs how much negotiation room exists.
- What's the average days-on-market for RENTAL listings here right now (not sales)? A rising rental-DOM trend means longer vacancies and softer asking-rent achievability than the comps imply.
- What's the recent tenant-quality profile in this submarket — average credit score on applications, eviction rate, late-payment / NSF rate, and stable-employment percentage? A property-management company in the area should have these aggregated.
- How much new for-sale + rental construction is in the pipeline within 1–3 miles? Heavy new supply typically softens prices + rents 12–24 months out; constrained supply supports both.
Investment metrics
- 1% rule
- 0.80% ✗
- Cap rate
- 6.76%
- Cash-on-cash
- 1.68%
- DSCR
- 1.07
- GRM
- 10.4
CMA / ARV
No comps found within radius.
Projected returns pro-forma
10.0% appreciation · 3.0% rent growth · sell at horizon
- IRR
- 25.5%
- Equity multiple
- 3.03×
- Total profit
- $227,607
- Equity at exit
- $360,262
- IRR
- 22.4%
- Equity multiple
- 6.91×
- Total profit
- $662,027
- Equity at exit
- $776,918
Cash invested: $111,972 (down + closing). Projections, not guarantees.
Landlord ↔ Tenant lean methodology
- Overall (STATE)
- 83 Strongly Landlord-Friendly
- State West Virginia
- 83 Strongly Landlord-Friendly · R+22
- County
- — inherits STATE
- City
- — inherits STATE
ZIP-level market 25427
- Home prices YoY
- 5.6%
- Active inventory
- 100
- Price-to-rent
- 10.4×
Monthly cashflow live
- Estimated rent
- $3,209 medium interval (Pro) →
- Mortgage (P&I)
- −$2,097
- Tax from tax record
- −$114 /mo · $1,370/yr
- Insurance
- −$167
- HOA
- −$0
- Vacancy / Maint / Mgmt
- −$674
- Net cashflow
- $157
Break-even live
Sensitivity live
| Price | -10% $383 | -5% $270 | +0% $157 | +5% $44 | +10% $-69 |
|---|---|---|---|---|---|
| Rent | -10% $-96 | -5% $30 | +0% $157 | +5% $284 | +10% $410 |
| Rate | -1.0pp $358 | -0.5pp $259 | base $157 | +0.5pp $53 | +1.0pp $-52 |
UW: 25.0% down · 7.5% · 30yr · 1.5% tax · 5.0% vac · 8.0% maint · 8.0% mgmt
Financing live
Cash to close
- Down payment
- $99,975
- Closing costs
- $11,997
- Reserves months
- —
- Total cash needed
- —
Loan-product check · same deal, 3 products live
Conventional
25% down · 7.5% · 30yr
- Down + closing
- —
- Monthly P&I
- —
- Monthly cashflow
- —
- DSCR
- —
- Eligible?
- —
Personal DTI + credit; lowest rate.
DSCR
20% down · 8.5% · 30yr
- Down + closing
- —
- Monthly P&I
- —
- Monthly cashflow
- —
- DSCR
- —
- Eligible?
- —
No personal income docs; deal must DSCR.
Hard money
10% down · 12.0% · 12mo
- Down + closing
- —
- Monthly P&I
- —
- Monthly cashflow
- —
- DSCR
- —
- Eligible?
- —
Short-term bridge; refi at stabilization.
Listing history 16 events
-
2026-06-22days on market $399,900 Active 72 DOM
-
2026-06-18days on market $399,900 Active 69 DOM
-
2026-06-17days on market $399,900 Active 68 DOM
-
2026-06-16days on market $399,900 Active 67 DOM
-
2026-06-15days on market $399,900 Active 66 DOM
-
2026-06-14days on market $399,900 Active 64 DOM
-
2026-06-13days on market $399,900 Active 63 DOM
-
2026-06-10days on market $399,900 Active 61 DOM
-
2026-06-09days on market $399,900 Active 60 DOM
-
2026-06-08days on market $399,900 Active 59 DOM
-
2026-06-07days on market $399,900 Active 58 DOM
-
2026-06-02days on market $399,900 Active 53 DOM
-
2026-06-01days on market $399,900 Active 52 DOM
-
2026-05-31days on market $399,900 Active 51 DOM
-
2026-05-30days on market $399,900 Active 50 DOM
-
2026-04-10$399,900 Active
ⓘ Source: listings_history table (triggers on properties + properties_extension) + one-shot
backfill from property_details.listing_events for pre-trigger history.
Tax reassessment forecast WV · Resets to sale price
- Current annual tax
- $1,370 · $114/mo
- Projected year-2 tax
- $2,359 · $197/mo
- Expected delta
- +$989/yr (+$82/mo · 72.2%)
ⓘ Screening estimate from a state-policy table — verify with the county assessor before closing.
Climate risk First Street
- Flood 1/10 Low FEMA zone X (unshaded) · 0% chance over 30 yrs
- Wildfire 3/10 Moderate
- Heat 5/10 Major 7 d/yr ≥99°F today · 17 d/yr by 30 yrs out
- Wind 2/10 Low 2% chance of damaging wind over 30 yrs
- Air quality 2/10 Low 0 unhealthy d/yr today · 1 by 30 yrs out
Nearby sold comps map
Loading sold comps map…
Walkable amenities ~0.75 mi
Loading nearby amenities…
Taxation est. · year 1
- Rental income
- $38,505
- − Mortgage interest
- −$22,401
- − Property taxes
- −$1,370
- − Insurance
- −$2,000
- − Repairs & maintenance
- −$3,080
- − Management
- −$3,080
- − Depreciation
- −$11,633
- Taxable loss
- −$5,059
- Est. tax savings @ 24.0%
- +$1,214
- After-tax cash flow
- $3,098/yr
For passive investors: Depreciation is non-cash, so a rental often shows a tax loss while cash-flowing — sheltering income. Rental losses are passive: they offset passive income freely, and up to $25,000/yr can offset ordinary (W-2) income if you actively participate and your MAGI is under $100k (phasing out to $0 by $150k); unused losses carry forward. On sale, claimed depreciation is recaptured at up to 25%, and gains may owe capital-gains tax (a 1031 exchange can defer both). Figures are a year-1 estimate at your 24.0% rate — not tax advice; consult a CPA.
Schools (NCES district)
- District
- Berkeley County Schools
- NCES district ID
- 5400060
- Math proficiency
- 21% ▼ -12.00%
- Reading proficiency
- 38% ▼ -6.00%
- Median HH income
- $54,599
- Composite
- 26.16/100
- National rank
- #7273
- State rank
- #24 of 55 in WV
Livability — Hedgesville
- Score
- 67/100
- State rank
- #88
- US rank
- #10335
Category grades
Schools grade is shown separately in the Schools card above.
Census & demographics
- County
- Berkeley County · 85,235 people
- City population
- 16,595
- Metro
- Hagerstown-Martinsburg, MD-WV
- Population (ZIP)
- 16,595
- Household income
- $87,184
- Rent vs Own
- Severe rent burden
- 120.0
Population outlook (Berkeley County) Hauer SSP2
- Today (2025)
- 127,359 people
- By 2030
- 134,684 · +5.8%
- By 2040
- 148,219 · +16.4%
- By 2050
- 159,300 · +25.1%
- By 2075
- 179,920 · +41.3%
- By 2100
- 183,896 · +44.4%
Race, ethnicity, and origin ACS 2023
- Neighborhood character
- Predominantly White (94%)
- Race & ethnicity
- White 94% Two or more races 4% Hispanic / Latino 2%
- Common ancestry
- Slovak 4% Lithuanian 3% Italian 3%
- Foreign-born
- 1% · Canada
Political lean MEDSL · Berkeley
- 2024 margin
- Solid R (+35.8) · D 31.2% · R 67.0% · Other 1.8%
- 2008→2024 swing
- -22.8pp toward R · 2008: -13.0pp · 2024: -35.8pp
- All cycles
- 2024: R+35.8 2020: R+31.2 2016: R+37.2 2012: R+21.3 2008: R+13.0
Not yet ingested
- Civics
- —
Market trends
- HPI YoY
- ▲ 14.42%
- Current HPI
- 270.4542
- Rent YoY
- —
- Metro
- Hagerstown-Martinsburg, MD-WV
- State GDP YoY
- —
- F500 in state
- 0
Price history
1 event — show timeline
- 2026-04-10 Listed $399,900 BRIGHT MLS
Property tax history
+0.8%/yrLatest (2025): $1,370 · -0.4% YoY. Source: county tax records.
Cash-flow waterfall
monthlySold comps — $/sqft
last 12 mo · ≤1 miLoading sold comps…