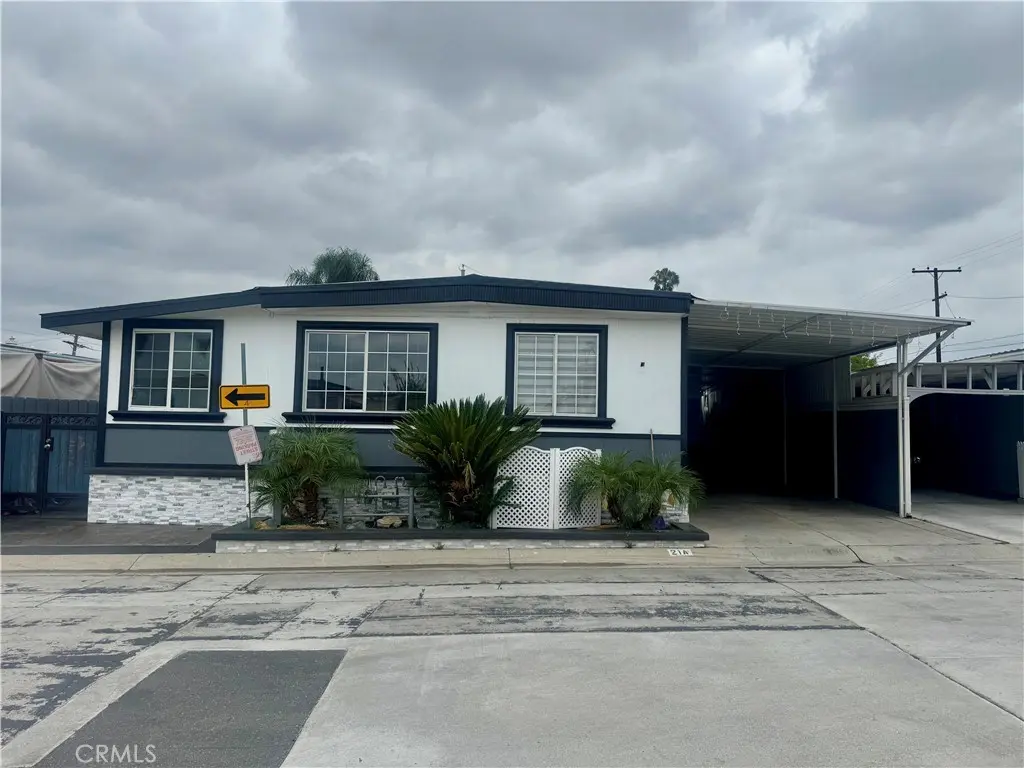
650 La Seda Rd Unit 21A · South San Jose Hills, CA
Flood risk 1/10 · Minimal
- FEMA flood zone
- X (unshaded)
- Chance of flooding over 30 yrs
- 0.0%
- Est. flood insurance / yr
- $507 – $1,088
Fire risk 1/10 · Minimal
- Est. fire insurance / yr
- $659 – $1,223
Heat risk 6/10 · Moderate
- Hot days now (above 99°F)
- 7 days/yr
- Hot days in 30 yrs
- 20 days/yr
Wind risk 1/10 · Minimal
- Chance of severe wind over 30 yrs
- —
Air-quality risk 7/10 · Major
- Unhealthy air days now
- 13 days/yr
- Unhealthy air days in 30 yrs
- 14 days/yr
Risk factors via First Street. Map © Google.
Why this score? — see what drove the B grade
The composite is a weighted blend of 9 inputs, each scored 0–100. Each bar is that input's sub-score; the figure is the points it added to the 100-point composite (weight × sub-score).
- Cash flow +29.5/30.0
- DSCR +10.0/10.0
- 1% rule +8.3/10.0
- ARV discount +7.5/15.0
- Rent growth +5.0/5.0
- Schools +4.5/10.0
- Condition / age +4.0/5.0
- Livability +3.2/5.0
- Appreciation +0.0/10.0
$255,000
🖨 Deal sheet 📄 Offer letter ✓ Due diligence
Listing remarks
AMAZING FULLY UPGRADED MANUFACTURED HOME IN TURN KEY CONDITION, READY TO MOVE IN WITH 4 BEDROOMS AND 2 FULL BATHROOMS. OPEN SPACE LIVING ROOM WITH FIRE PLACE, RECESS LIGHTING AND A BEAUTIFUL KITCHEN WITH WHITE CABINETS AND GRANITE COUNTERTOPS. EXCELLENT PRIVATE PATIO WITH NEWER STAMP CONCRETE, SURROUND SOUND SYSTEM FOR YOUR PRIVATE EVENTS. LONG PRIVATE DRIVEWAY PERFECT FOR 4 CARS. THIS CHARMING HOME OFFERS A GREAT OPPORTUNITY FOR HOMEBUYERS SEEKING AFFORDABILITY IN A DESIRABLE LOCATION. THIS IS A MUST SEE PROPERTY.
Key facts
- Fire place
- Beautiful kitchen
- White cabinets
Tags
Property features AI
Finance
- Other: Park name: Rancho La Seda Mobile Home Community; Pets allowed with breed restrictions
- Financial info: Land lease amount: $1,250
- HOA & community: Part of an association; Land lease community
Exterior
- Parking: Located in Rancho La Seda Mobile Home Community
- Utilities: Public sewer; District/public water
- Home design: Manufactured/mobile home (Model: Villa West); One story; Entry on main level
- Construction: Mobile home remains on site; Mobile dimensions approximately 20 ft by 108 ft; Year built reported by appraiser
- Exterior features: Community pool; Yard; Curbs
Interior
- Bathrooms: 2 full bathrooms
- Interior features: Single-level home; Main level entry
- Laundry & utility: Laundry in carport; Gas dryer hookup
Neighborhood map
What this means for you Summary
Snapshot
- This is a 4-bed/2.0-bath manufactured listed at $255k. Condition is rated good.
Deal economics
- At list price, monthly cash flow is $916 ($11k/yr) — positive.
- The deal already cash-flows at list — no discount required.
- Meets the 1% rule at list price ($3k rent vs $255k).
- Recommended offer: $247k (3.0% below list) — sets the bar for market timing.
- Cap rate 10.6% vs local median 3.2% in South San Jose Hills — top-decile yield for the area; either an underpriced asset or a hidden risk that comps aren't pricing in. Stress-test before assuming the spread holds.
Location & tenants
- Location reads 63/100 on livability (#449 in CA) — a middle-class / working-renter tenant base. Strengths: commute A+, housing A, employment A-; Watch: crime F, amenities F, cost of living F.
- Rowland Unified (suburban): math 40% / reading 62% proficiency, ranked #134 of 517 in CA (top 26%) — acceptable for families but not a draw, mixed tenant base, ~2y average lease.
- Market conditions: Rents rising fast (+13.2%/yr); 70 active listings in the ZIP; 1 comparable units currently listed for rent nearby; solid renter incomes; 19,697 units permitted in Los Angeles County in 2024 (9,426 in 5+ unit buildings).
- This rent runs 43% of the median local income ($94k/yr) — at the standard rent-burdened threshold; future hikes will face affordability resistance.
Forward outlook
- Local home prices are declining (-3.0%/yr); year-one equity from $2k of loan paydown is wiped out by about $8k of value loss. Plan a longer hold.
- Los Angeles County population projected at +9% by 2050 — modest demand growth; plan on rents tracking national, not racing it.
- At projected returns (-3.0% appreciation + 8.0% rent growth), your $71k cash investment doubles in ~6 years — after that, you're playing with house money.
Negotiation context
- It's been on market 34 days — a 3% lower offer ($247k) is reasonable based on typical stale-listing flexibility.
Risks & watch-outs
- Climate carrying-cost: extreme-heat days projected 7→20/yr by 2055 (HVAC capex compounding) — expect insurance premiums to compound above CPI over the hold.
Questions for the listing agent
- It's been on market 34 days. Have you received any prior offers? Is the seller open to a 3% concession, seller financing, or rate buy-down credit?
- Built in 1970 — when were the roof, HVAC, electrical panel, plumbing, and water heater last replaced?
- Is there a deadline driving the sale (1031 exchange, divorce, estate, relocation)? That informs how much negotiation room exists.
- Schools are B-rated — typically a magnet for longer-tenancy family renters. What's the average tenant stay here, and is there a school-zone premium baked into asking?
- Crime grade is F in this area — have there been break-ins, vandalism, or insurance claims at this property in the last 3 years? What carrier currently insures it and at what premium?
- What's the average days-on-market for RENTAL listings here right now (not sales)? A rising rental-DOM trend means longer vacancies and softer asking-rent achievability than the comps imply.
- What's the recent tenant-quality profile in this submarket — average credit score on applications, eviction rate, late-payment / NSF rate, and stable-employment percentage? A property-management company in the area should have these aggregated.
- How much new for-sale + rental construction is in the pipeline within 1–3 miles? Heavy new supply typically softens prices + rents 12–24 months out; constrained supply supports both.
Investment metrics
- 1% rule
- 1.33% ✓
- Cap rate
- 10.60%
- Cash-on-cash
- 15.40%
- DSCR
- 1.69
- GRM
- 6.3
CMA / ARV
No comps found within radius.
Projected returns pro-forma
-3.0% appreciation · 8.0% rent growth · sell at horizon
- IRR
- 11.7%
- Equity multiple
- 1.49×
- Total profit
- $34,997
- Equity at exit
- $38,021
- IRR
- 24.3%
- Equity multiple
- 3.62×
- Total profit
- $187,367
- Equity at exit
- $22,048
Cash invested: $71,400 (down + closing). Projections, not guarantees.
Landlord ↔ Tenant lean methodology
- Overall (STATE)
- 18 Strongly Tenant-Friendly
- State California
- 18 Strongly Tenant-Friendly · D+13
- County
- — inherits STATE
- City
- — inherits STATE
ZIP-level market 91744
- Rents YoY
- 13.2%
- Active inventory
- 70
- Price-to-rent
- 6.3×
Monthly cashflow live
- Estimated rent
- $3,390 medium interval (Pro) →
- Mortgage (P&I)
- −$1,337
- Tax est. 1.5%
- −$319 /mo · $3,825/yr
- Insurance
- −$106
- HOA
- −$0
- Vacancy / Maint / Mgmt
- −$712
- Net cashflow
- $916
Break-even live
UW: 25.0% down · 7.5% · 30yr · 1.5% tax · 5.0% vac · 8.0% maint · 8.0% mgmt
Financing live
Cash to close
- Down payment
- $63,750
- Closing costs
- $7,650
- Reserves months
- —
- Total cash needed
- —
Loan-product check · same deal, 3 products live
Conventional
25% down · 7.5% · 30yr
- Down + closing
- —
- Monthly P&I
- —
- Monthly cashflow
- —
- DSCR
- —
- Eligible?
- —
Personal DTI + credit; lowest rate.
DSCR
20% down · 8.5% · 30yr
- Down + closing
- —
- Monthly P&I
- —
- Monthly cashflow
- —
- DSCR
- —
- Eligible?
- —
No personal income docs; deal must DSCR.
Hard money
10% down · 12.0% · 12mo
- Down + closing
- —
- Monthly P&I
- —
- Monthly cashflow
- —
- DSCR
- —
- Eligible?
- —
Short-term bridge; refi at stabilization.
Rent comps 1 comps
| Address | Beds | Baths | Sqft | Rent | $/sqft | DOM | Units | Dist |
|---|---|---|---|---|---|---|---|---|
| 2817 E Valley Blvd West Covina, CA | 3.0 | 2.0 | 1050 | $3,100 | $2.95 | 43d | 1 | 0.77mi |
Listing history 15 events
-
2026-06-18days on market $255,000 Active 34 DOM
-
2026-06-17days on market $255,000 Active 33 DOM
-
2026-06-16days on market $255,000 Active 32 DOM
-
2026-06-15days on market $255,000 Active 31 DOM
-
2026-06-13days on market $255,000 Active 29 DOM
-
2026-06-13days on market $255,000 Active 28 DOM
-
2026-06-09days on market $255,000 Active 25 DOM
-
2026-06-08days on market $255,000 Active 24 DOM
-
2026-06-07days on market $255,000 Active 23 DOM
-
2026-06-04days on market $255,000 Active 20 DOM
-
2026-06-03days on market $255,000 Active 19 DOM
-
2026-06-02days on market $255,000 Active 18 DOM
-
2026-06-01days on market $255,000 Active 17 DOM
-
2026-05-31days on market $255,000 Active 16 DOM
-
2026-05-15$255,000 Active
ⓘ Source: listings_history table (triggers on properties + properties_extension) + one-shot
backfill from property_details.listing_events for pre-trigger history.
Climate risk First Street
- Flood 1/10 Low FEMA zone X (unshaded) · 0% chance over 30 yrs
- Wildfire 1/10 Low
- Heat 6/10 Major 7 d/yr ≥99°F today · 20 d/yr by 30 yrs out
- Wind 1/10 Low
- Air quality 7/10 Severe 13 unhealthy d/yr today · 14 by 30 yrs out
Nearby sold comps map
Loading sold comps map…
Walkable amenities ~0.75 mi
Loading nearby amenities…
Taxation est. · year 1
- Rental income
- $40,684
- − Mortgage interest
- −$14,284
- − Property taxes
- −$3,825
- − Insurance
- −$1,275
- − Repairs & maintenance
- −$3,255
- − Management
- −$3,255
- − Depreciation
- −$7,418
- Taxable income
- $7,373
- Est. tax owed @ 24.0%
- −$1,769
- After-tax cash flow
- $9,224/yr
For passive investors: Depreciation is non-cash, so a rental often shows a tax loss while cash-flowing — sheltering income. Rental losses are passive: they offset passive income freely, and up to $25,000/yr can offset ordinary (W-2) income if you actively participate and your MAGI is under $100k (phasing out to $0 by $150k); unused losses carry forward. On sale, claimed depreciation is recaptured at up to 25%, and gains may owe capital-gains tax (a 1031 exchange can defer both). Figures are a year-1 estimate at your 24.0% rate — not tax advice; consult a CPA.
Condition & rehab AI · 12 photos
This fully upgraded manufactured home is in excellent condition, ready to move in with 4 bedrooms and 2 bathrooms. It offers a great opportunity for homebuyers seeking affordability in a desirable location.
Value-add opportunities
- Both landscaping — improves curb appeal and adds value
- Both painting exterior — fresh paint enhances curb appeal and value
- Both upgrading air conditioning units — modern units improve comfort and energy efficiency
Renovation cost estimate screening
Value-add ROI direction
- Both landscaping — improves curb appeal and adds value ↑
- Both painting exterior — fresh paint enhances curb appeal and value ↑
- Both upgrading air conditioning units — modern units improve comfort and energy efficiency ↑
ⓘ Cost ranges are severity-bucket heuristics (US national rule-of-thumb). Get contractor quotes + a written scope before underwriting a rehab budget.
Schools (NCES district)
- District
- Rowland Unified
- NCES district ID
- 0633750
- Math proficiency
- 40% ▼ -1.00%
- Reading proficiency
- 62% ▲ 11.00%
- Median HH income
- $63,667
- Composite
- 44.83/100
- National rank
- #2733
- State rank
- #134 of 517 in CA
Livability — South San Jose Hills
- Score
- 63/100
- State rank
- #449
- US rank
- #15206
Category grades
Schools grade is shown separately in the Schools card above.
Census & demographics
- Census place
- South San Jose Hills, CA
- County
- Los Angeles County · 9,444,647 people
- Metro
- Los Angeles-Long Beach-Anaheim, CA
- Population (ZIP)
- 76,942
- Household income
- $93,557
- Rent vs Own
- Severe rent burden
- 1299.0
Population outlook (Los Angeles County) Hauer SSP2
- Today (2025)
- 10,940,515 people
- By 2030
- 11,256,481 · +2.9%
- By 2040
- 11,729,929 · +7.2%
- By 2050
- 11,948,407 · +9.2%
- By 2075
- 11,818,114 · +8.0%
- By 2100
- 10,842,928 · -0.9%
Race, ethnicity, and origin ACS 2023
- Neighborhood character
- Predominantly Hispanic (79%)
- Race & ethnicity
- Hispanic / Latino 79% Two or more races 18% Asian 14% White 4% Native American 2% Black 1%
- Hispanic origin (detail)
- Mexican 69%
- Foreign-born
- 39% · Canada, China, Vietnam
- Languages at home
- 26% English-only · Spanish 62% Chinese 6% Tagalog/Filipino 3%
Political lean MEDSL · Los Angeles
- 2024 margin
- Solid D (+32.9) · D 64.8% · R 31.9% · Other 3.3%
- 2008→2024 swing
- -7.4pp toward R · 2008: 40.4pp · 2024: 32.9pp
- All cycles
- 2024: D+32.9 2020: D+44.2 2016: D+48.0 2012: D+40.0 2008: D+40.4
Not yet ingested
- Civics
- —
Market trends
- HPI YoY
- ▼ -953.57%
- Current HPI
- 447.0241
- Rent YoY
- ▲ 13.19%
- Metro
- Los Angeles-Long Beach-Anaheim, CA
- State GDP YoY
- ▲ 3.21%
- F500 in state
- 116
Industry mix (Fortune 500 HQ in CA)
| Industry | F500 HQs | Revenue |
|---|---|---|
| Technology | 27 | $1,492B |
|
||
| Financial Services | 3 | $174B |
|
||
| Retail | 3 | $44B |
|
||
| Insurance | 3 | $26B |
|
||
| Media / Entertainment | 2 | $115B |
|
||
| Pharmaceuticals / Biotech | 2 | $62B |
|
||
Price history
1 event — show timeline
- 2026-05-15 Listed $255,000 CRMLS
Property tax history
+6.3%/yrLatest (2025): $295 · +6.3% YoY. Source: county tax records.
Cash-flow waterfall
monthlySold comps — $/sqft
last 12 mo · ≤1 miLoading sold comps…