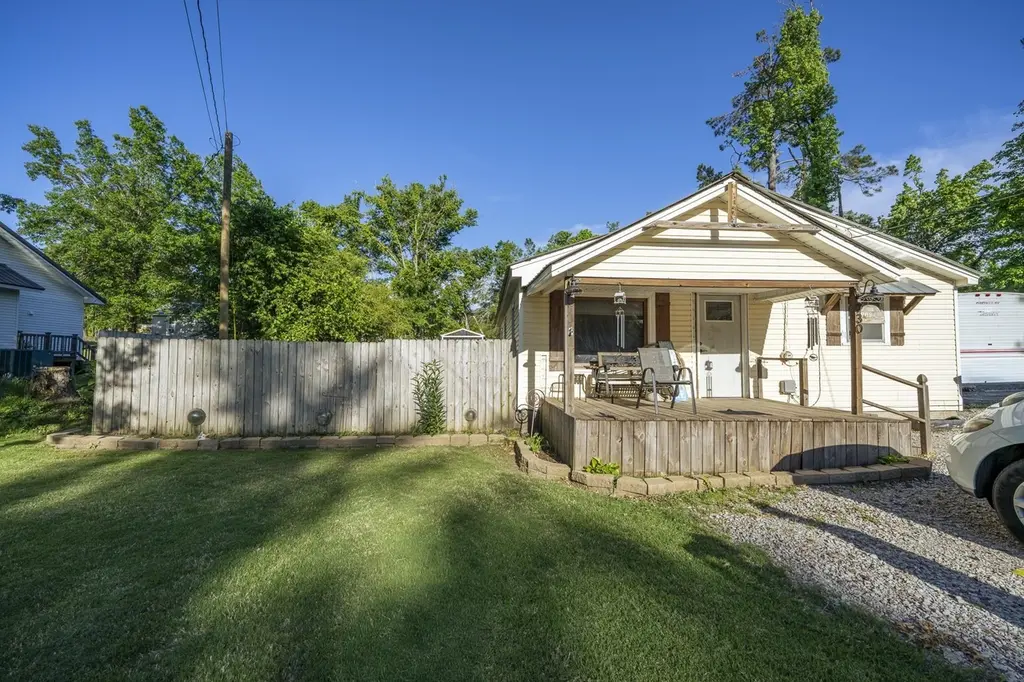
730 Cravens Dr · Savannah, TN
Flood risk 7/10 · Major
- FEMA flood zone
- X (unshaded)
- Chance of flooding over 30 yrs
- 0.99%
- Est. flood insurance / yr
- $507 – $1,088
Fire risk 2/10 · Minimal
- Est. fire insurance / yr
- $949 – $1,763
Heat risk 6/10 · Moderate
- Hot days now (above 109°F)
- 7 days/yr
- Hot days in 30 yrs
- 20 days/yr
Wind risk 4/10 · Minor
- Chance of severe wind over 30 yrs
- 18.0%
Air-quality risk 1/10 · Minimal
- Unhealthy air days now
- 0 days/yr
- Unhealthy air days in 30 yrs
- 0 days/yr
Risk factors via First Street. Map © Google.
Why this score? — see what drove the B+ grade
The composite is a weighted blend of 9 inputs, each scored 0–100. Each bar is that input's sub-score; the figure is the points it added to the 100-point composite (weight × sub-score).
- Cash flow +30.0/30.0
- DSCR +10.0/10.0
- Appreciation +10.0/10.0
- 1% rule +8.5/10.0
- ARV discount +7.5/15.0
- Livability +3.6/5.0
- Rent growth +2.5/5.0
- Condition / age +2.5/5.0
- Schools +2.3/10.0
$75,000
🖨 Deal sheet 📄 Offer letter ✓ Due diligence
Listing remarks MLS
NEW Price! Investor opportunity with charming curb appeal and excellent potential! Situated on a large city lot beside a small branch, this 2-bedroom, 1-bath home offers a welcoming front porch, spacious separate living room, eat-in kitchen with laundry area. .. plus a bonus/flex space. Conveniently located to shopping and medical, this property could make a great addition to an investment portfolio or your future renovation project. Property is tenant occupied and is being sold AS-IS. Long-term tenant may be willing to remain with new ownership, offering potential immediate rental income opportunity for investors. Reach out before it is too late. Just reduced to $75,000.
Key facts
- Large city lot
- Front porch
- Bonus flex space
Tags
Property features AI
Exterior
- Parking: Parking pad
- Utilities: Public water; Public sewer; Natural gas available; Water available
- Home design: Single family residence; Residential property; Three or more levels
- Construction: Shingle roof; Existing structure
- Exterior features: Porch; Lot approximately 0.56 acre with irregular dimensions (95 x 243 x IRR)
Interior
- Kitchen: Kitchen (12x15)
- Bedrooms: Two bedrooms (12x12 and 11x11); Den
- Flooring: Carpet and other
- Bathrooms: One full bathroom
- Heating & cooling: Natural gas heating; Cooling system (other)
- Interior features: Carpet and other flooring; Basement (other)
Neighborhood map
What this means for you Summary
Snapshot
- This is a 2-bed/1.0-bath single-family listed at $75k.
Deal economics
- At list price, monthly cash flow is $291 ($3k/yr) — positive.
- The deal already cash-flows at list — no discount required.
- Meets the 1% rule at list price ($1k rent vs $75k).
- Recommended offer: $73k (3.0% below list) — sets the bar for market timing.
Location & tenants
- Location reads 71/100 on livability (#47 in TN) — a middle-class / working-renter tenant base. Strengths: cost of living A+, housing A+, health & safety A+; Watch: amenities C-, schools F, crime F.
- Hardin County (rural): math 27% / reading 28% proficiency, ranked #76 of 139 in TN (top 55%) — low school quality limits family demand, transient renter base, plan for 1-2y turnover.
- Market conditions: 385 active listings in the ZIP; 24 units permitted in Hardin County in 2024 (0 in 5+ unit buildings).
Forward outlook
- In year one you build about $8k of equity ($519 loan paydown + $8k appreciation (10.0% local appreciation)).
- Hardin County population projected at -17% by 2050 — secular population decline; favor cash flow + early exit over multi-decade hold.
- At projected returns (10.0% appreciation + 3.0% rent growth), your $21k cash investment doubles in ~2 years — after that, you're playing with house money.
- By year 5, paydown + projected appreciation supports a ~$37k cash-out refi (75% LTV) — recoverable capital for the next deal without selling this one.
Negotiation context
- It's been on market 36 days — a 3% lower offer ($73k) is reasonable based on typical stale-listing flexibility.
- 2 sale attempts; this cycle's ask has dropped $5k (6%) from the opening price — seller is motivated, your offer sets the floor, not the list.
- Current owner paid $14k; list at $75k implies a 436% gain — meaningful room to come down on a strong offer.
Risks & watch-outs
- Watch-outs: flood insurance adds $66/mo; built in 1949 — expect roof / HVAC / electrical / plumbing capex.
- Climate carrying-cost: major flood risk; extreme-heat days projected 7→20/yr by 2055 (HVAC capex compounding) — expect insurance premiums to compound above CPI over the hold.
Questions for the listing agent
- It's been on market 36 days. Have you received any prior offers? Is the seller open to a 3% concession, seller financing, or rate buy-down credit?
- Built in 1949 — when were the roof, HVAC, electrical panel, plumbing, and water heater last replaced?
- What's the actual annual flood-insurance premium (NFIP or private), and is the property in a SFHA with mandatory coverage?
- Is there a deadline driving the sale (1031 exchange, divorce, estate, relocation)? That informs how much negotiation room exists.
- Schools are F-rated, which usually means shorter tenancies and higher turnover. Who's the typical renter profile here, and what's been the actual vacancy rate?
- Crime grade is F in this area — have there been break-ins, vandalism, or insurance claims at this property in the last 3 years? What carrier currently insures it and at what premium?
- What's the average days-on-market for RENTAL listings here right now (not sales)? A rising rental-DOM trend means longer vacancies and softer asking-rent achievability than the comps imply.
- What's the recent tenant-quality profile in this submarket — average credit score on applications, eviction rate, late-payment / NSF rate, and stable-employment percentage? A property-management company in the area should have these aggregated.
- How much new for-sale + rental construction is in the pipeline within 1–3 miles? Heavy new supply typically softens prices + rents 12–24 months out; constrained supply supports both.
Investment metrics
- 1% rule
- 1.35% ✓
- Cap rate
- 12.01%
- Cash-on-cash
- 20.43%
- DSCR
- 1.91
- GRM
- 6.2
CMA / ARV
No comps found within radius.
Projected returns pro-forma
10.0% appreciation · 3.0% rent growth · sell at horizon
- IRR
- 36.6%
- Equity multiple
- 3.83×
- Total profit
- $59,391
- Equity at exit
- $67,566
- IRR
- 31.5%
- Equity multiple
- 8.64×
- Total profit
- $160,339
- Equity at exit
- $145,709
Cash invested: $21,000 (down + closing). Projections, not guarantees.
Landlord ↔ Tenant lean methodology
- Overall (STATE)
- 87 Strongly Landlord-Friendly
- State Tennessee
- 87 Strongly Landlord-Friendly · R+13
- County
- — inherits STATE
- City
- — inherits STATE
ZIP-level market 38372
- Home prices YoY
- 5.5%
- Active inventory
- 385
- Price-to-rent
- 6.2×
Monthly cashflow live
- Estimated rent
- $1,012 medium interval (Pro) →
- Mortgage (P&I)
- −$393
- Tax from tax record
- −$18 /mo · $210/yr
- Insurance
- −$31
- Flood insurance flood zone
- −$66 /mo · $798/yr
- HOA
- −$0
- Vacancy / Maint / Mgmt
- −$213
- Net cashflow
- $291
Break-even live
UW: 25.0% down · 7.5% · 30yr · 1.5% tax · 5.0% vac · 8.0% maint · 8.0% mgmt
Financing live
Cash to close
- Down payment
- $18,750
- Closing costs
- $2,250
- Reserves months
- —
- Total cash needed
- —
Loan-product check · same deal, 3 products live
Conventional
25% down · 7.5% · 30yr
- Down + closing
- —
- Monthly P&I
- —
- Monthly cashflow
- —
- DSCR
- —
- Eligible?
- —
Personal DTI + credit; lowest rate.
DSCR
20% down · 8.5% · 30yr
- Down + closing
- —
- Monthly P&I
- —
- Monthly cashflow
- —
- DSCR
- —
- Eligible?
- —
No personal income docs; deal must DSCR.
Hard money
10% down · 12.0% · 12mo
- Down + closing
- —
- Monthly P&I
- —
- Monthly cashflow
- —
- DSCR
- —
- Eligible?
- —
Short-term bridge; refi at stabilization.
Listing history 18 events
-
2026-06-18days on market $75,000 Active 36 DOM
-
2026-06-17days on market $75,000 Active 35 DOM
-
2026-06-16days on market $75,000 Active 34 DOM
-
2026-06-15days on market $75,000 Active 33 DOM
-
2026-06-13days on market $75,000 Active 31 DOM
-
2026-06-12days on market $75,000 Active 30 DOM
-
2026-06-09remarks 699-char remark
-
2026-06-09pricedays on market $75,000 Active 27 DOM
-
2026-06-08days on market $80,000 Active 26 DOM
-
2026-06-08days on market $80,000 Active 25 DOM
-
2026-06-07days on market $80,000 Active 24 DOM
-
2026-06-03days on market $80,000 Active 21 DOM
-
2026-06-02days on market $80,000 Active 20 DOM
-
2026-06-01days on market $80,000 Active 19 DOM
-
2026-05-31days on market $80,000 Active 18 DOM
-
2026-05-14$80,000 Active 692-char remark
-
2026-05-12$80,000 Active 694-char remark
Show marketing remark (680 chars)
NEW Price! Investor opportunity with charming curb appeal and excellent potential! Situated on a large city lot beside a small branch, this 2-bedroom, 1-bath home offers a welcoming front porch, spacious separate living room, eat-in kitchen with laundry area. .. plus a bonus/flex space. Conveniently located to shopping and medical, this property could make a great addition to an investment portfolio or your future renovation project. Property is tenant occupied and is being sold AS-IS. Long-term tenant may be willing to remain with new ownership, offering potential immediate rental income opportunity for investors. Reach out before it is too late. Just reduced to $75,000.
-
2004-05-04soldstatus $14,000
ⓘ Source: listings_history table (triggers on properties + properties_extension) + one-shot
backfill from property_details.listing_events for pre-trigger history.
Tax reassessment forecast TN · Resets to sale price
- Current annual tax
- $210 · $18/mo
- Projected year-2 tax
- $532 · $44/mo
- Expected delta
- +$322/yr (+$27/mo · 153.6%)
ⓘ Screening estimate from a state-policy table — verify with the county assessor before closing.
Climate risk First Street
- Flood 7/10 Severe FEMA zone X (unshaded) · 99% chance over 30 yrs
- Wildfire 2/10 Low
- Heat 6/10 Major 7 d/yr ≥109°F today · 20 d/yr by 30 yrs out
- Wind 4/10 Moderate 18% chance of damaging wind over 30 yrs
- Air quality 1/10 Low 0 unhealthy d/yr today · 0 by 30 yrs out
Nearby sold comps map
Loading sold comps map…
Walkable amenities ~0.75 mi
Loading nearby amenities…
Taxation est. · year 1
- Rental income
- $12,145
- − Mortgage interest
- −$4,201
- − Property taxes
- −$210
- − Insurance
- −$1,172
- − Repairs & maintenance
- −$972
- − Management
- −$972
- − Depreciation
- −$2,182
- Taxable income
- $2,436
- Est. tax owed @ 24.0%
- −$585
- After-tax cash flow
- $2,907/yr
For passive investors: Depreciation is non-cash, so a rental often shows a tax loss while cash-flowing — sheltering income. Rental losses are passive: they offset passive income freely, and up to $25,000/yr can offset ordinary (W-2) income if you actively participate and your MAGI is under $100k (phasing out to $0 by $150k); unused losses carry forward. On sale, claimed depreciation is recaptured at up to 25%, and gains may owe capital-gains tax (a 1031 exchange can defer both). Figures are a year-1 estimate at your 24.0% rate — not tax advice; consult a CPA.
Schools (NCES district)
- District
- Hardin County
- NCES district ID
- 4701680
- Math proficiency
- 27% ▼ -1.00%
- Reading proficiency
- 28% ▼ -1.00%
- Median HH income
- $34,404
- Composite
- 22.64/100
- National rank
- #8061
- State rank
- #76 of 139 in TN
Livability — Savannah
- Score
- 71/100
- State rank
- #47
- US rank
- #7090
Category grades
Schools grade is shown separately in the Schools card above.
Census & demographics
- Census place
- Savannah, TN
- Population (ZIP)
- 17,659
Population outlook (Hardin County) Hauer SSP2
- Today (2025)
- 24,740 people
- By 2030
- 23,971 · -3.1%
- By 2040
- 22,284 · -9.9%
- By 2050
- 20,612 · -16.7%
- By 2075
- 17,072 · -31.0%
- By 2100
- 13,723 · -44.5%
Race, ethnicity, and origin ACS 2023
- Neighborhood character
- Predominantly White (89%)
- Race & ethnicity
- White 89% Two or more races 5% Black 3% Hispanic / Latino 3%
- Common ancestry
- Italian 5% Slovak 2% Danish 2%
- Foreign-born
- 1% · Canada
- Languages at home
- 97% English-only · Spanish 2% German/W. Germanic 1%
Political lean MEDSL · Hardin
- 2024 margin
- Solid R (+71.0) · D 14.1% · R 85.1%
- 2008→2024 swing
- -28.3pp toward R · 2008: -42.7pp · 2024: -71.0pp
- All cycles
- 2024: R+71.0 2020: R+67.5 2016: R+64.2 2012: R+51.6 2008: R+42.7
Not yet ingested
- Civics
- —
Market trends
- HPI YoY
- ▲ 15.20%
- Current HPI
- 293.51
- Rent YoY
- —
- Metro
- —
- State GDP YoY
- ▲ 2.78%
- F500 in state
- 22
Industry mix (Fortune 500 HQ in TN)
| Industry | F500 HQs | Revenue |
|---|---|---|
| Healthcare | 3 | $91B |
|
||
| Retail | 3 | $72B |
|
||
| Transportation / Logistics | 1 | $88B |
|
||
| Paper / Packaging | 1 | $19B |
|
||
| Insurance | 1 | $13B |
|
||
| Energy | 1 | $12B |
|
||
Price history
+435.7% since first listed5 events — show timeline
- 2026-06-10 Price Changed $75,000 Memphis Area Association of Realtors(R) MLS
- 2026-06-09 Price Changed $75,000 REALTRACS as Distributed by MLS Grid
- 2026-05-14 Listed $80,000 REALTRACS as Distributed by MLS Grid
- 2026-05-12 Listed $80,000 Memphis Area Association of Realtors(R) MLS
- 2004-05-04 Sold (Public Records) $14,000 Public Records
Property tax history
+3.0%/yrLatest (2025): $210 · +0.0% YoY. Source: county tax records.
Cash-flow waterfall
monthlySold comps — $/sqft
last 12 mo · ≤1 miLoading sold comps…