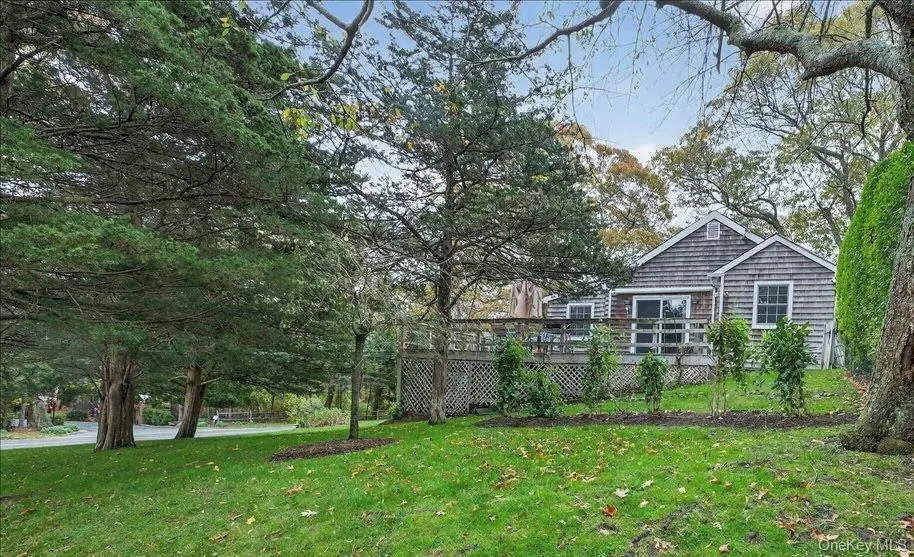
3748 Noyack Rd · Noyack, NY
Flood risk No data
- FEMA flood zone
- —
- Chance of flooding over 30 yrs
- —
- Est. flood insurance / yr
- —
Fire risk No data
- Est. fire insurance / yr
- —
Heat risk No data
- Hot days now (above threshold)
- —
- Hot days in 30 yrs
- —
Wind risk No data
- Chance of severe wind over 30 yrs
- —
Air-quality risk No data
- Unhealthy air days now
- —
- Unhealthy air days in 30 yrs
- —
Risk factors via First Street. Map © Google.
Why this score? — see what drove the A grade
The composite is a weighted blend of 9 inputs, each scored 0–100. Each bar is that input's sub-score; the figure is the points it added to the 100-point composite (weight × sub-score).
- Cash flow +30.0/30.0
- ARV discount +13.7/15.0
- 1% rule +10.0/10.0
- DSCR +10.0/10.0
- Appreciation +9.6/10.0
- Schools +5.6/10.0
- Rent growth +5.0/5.0
- Livability +2.9/5.0
- Condition / age +2.5/5.0
$1,000,000
🖨 Deal sheet (PDF) 📄 Offer letter ✓ Due diligence
Listing remarks
Charming cottage in walking distance to Long Beach and just minutes from Sag Harbor Village. This 2-bedroom, 1-bath home sits on a 0.27-acre corner lot, offering a private setting within a well-manicured yard. Whether you are enjoying the heated in-ground pool or sipping coffee on the spacious deck, you’ll be sure to relax and unwind. On the interior, you’ll find an eat-in kitchen, two bedrooms, a full bathroom, and a spacious living room with sliding doors to the deck. The property offers an attached one-car garage with a laundry area, central AC, in-ground sprinklers, and a newly constructed sidewalk that leads into town. This Sag Harbor retreat is ideally situated as a year-r
Key facts
- Central ac
- Spacious deck
- Eat-in kitchen
Tags
Property features AI
Exterior
- Parking: Attached parking; Driveway; 1-car garage
- Utilities: Cesspool sewer; Cable connected; Electricity connected; Propane
- Home design: Single-family residence; Measured living area
- Construction: Frame construction; Crawl attic; No basement
- Exterior features: Back yard; Corner lot; Front yard; Front yard sprinklers; Private in-ground pool with electric heat
Interior
- Kitchen: Dishwasher; Oven; Refrigerator
- Bedrooms: 4 rooms total (includes bedrooms and other rooms)
- Bathrooms: 1 full bathroom
- Heating & cooling: Baseboard heating (oil); Central air conditioning
- Interior features: First-floor bedroom; Eat-in kitchen; Recessed lighting
- Laundry & utility: Washer; Dryer
Neighborhood map
What this means for you Summary
Snapshot
- This is a 2-bed/1.0-bath single-family listed at $1.00M.
Deal economics
- At list price, monthly cash flow is $9k ($104k/yr) — positive.
- The deal already cash-flows at list — no discount required.
- Meets the 1% rule at list price ($19k rent vs $1.00M).
- Cap rate 16.7% vs local median 7.1% in Noyack — top-decile yield for the area; either an underpriced asset or a hidden risk that comps aren't pricing in. Stress-test before assuming the spread holds.
Location & tenants
- Location reads 57/100 on livability (#1,084 in NY) — a working-class tenant base; expect higher turnover. Strengths: crime A+, employment A+; Watch: housing D+, amenities F, commute F.
- Sag Harbor Union Free School District (suburban): math 54% / reading 70% proficiency, ranked #175 of 590 in NY (top 30%) — acceptable for families but not a draw, mixed tenant base, ~2y average lease; only 8% free/reduced lunch — higher-income household profile.
- Zoned schools: Sag Harbor Elementary School (math 47% / reading 72%, grade B-, #745 of 2,108 statewide, top 39%, 426 students, 22% FRL); Pierson Middle/High School (math 61% / reading 72%, grade B, #763 of 1,100 statewide, top 69%, 525 students, 25% FRL) — zoned schools average 24% FRL vs 8% district-wide (16 pts higher); higher-poverty schools than district average — tighter screening recommended.
- Market conditions: Rents rising fast (+10.8%/yr); 66 active listings in the ZIP; high-income renter base; 1,366 units permitted in Suffolk County in 2024 (216 in 5+ unit buildings).
- At $18,517/mo this rent would consume 174% of the median local household income ($128k/yr) (locally 95% of renters already pay >50% of income on rent) — very limited rent-growth headroom before tenants either downsize or default.
Forward outlook
- In year one you build about $99k of equity ($7k loan paydown + $92k appreciation (9.2% local appreciation)).
- Suffolk County population projected to shrink 5% by 2050 — rents likely to lag national; underwrite the cash flow, not the appreciation.
- At projected returns (9.2% appreciation + 8.0% rent growth), your $280k cash investment doubles in ~2 years — after that, you're playing with house money.
- By year 2, paydown + projected appreciation supports a ~$158k cash-out refi (75% LTV) — recoverable capital for the next deal without selling this one.
Negotiation context
- Only 5 days on market — expect competitive offers; lowballing is unlikely to land.
Questions for the listing agent
- Built in 1960 — when were the roof, HVAC, electrical panel, plumbing, and water heater last replaced?
- Is there a deadline driving the sale (1031 exchange, divorce, estate, relocation)? That informs how much negotiation room exists.
- What's the average days-on-market for RENTAL listings here right now (not sales)? A rising rental-DOM trend means longer vacancies and softer asking-rent achievability than the comps imply.
- What's the recent tenant-quality profile in this submarket — average credit score on applications, eviction rate, late-payment / NSF rate, and stable-employment percentage? A property-management company in the area should have these aggregated.
- How much new for-sale + rental construction is in the pipeline within 1–3 miles? Heavy new supply typically softens prices + rents 12–24 months out; constrained supply supports both.
Investment metrics
- 1% rule
- 1.85% ✓
- Cap rate
- 16.72%
- Cash-on-cash
- 37.24%
- DSCR
- 2.66
- GRM
- 4.5
CMA / ARV
- ARV (on-the-fly)
- $1,158,678
- Comps found
- 3
Show comp detail 3 sales within ~0.75 mi
| Address | Dist | Beds/Ba | Sqft | Sold | Price | $/sf | Match |
|---|---|---|---|---|---|---|---|
| 55 Wickatuck Dr | 0.08mi | 2/1.0 | 710 (-8%) | 6mo | $1,240,000 | $1,746 | 77 |
| 12 Butcher Ln | 0.25mi | 2/1.0 | 768 (-1%) | 24mo | $1,150,000 | $1,497 | 67 |
| 2 Chestnut St | 0.66mi | 2/1.0 | 800 (+3%) | 21mo | $4,500 | $6 | 46 |
Match score weights: distance 35% · size 25% · config 20% · recency 20%. Top-matched comps best support the ARV.
Projected returns pro-forma
9.19% appreciation · 8.0% rent growth · sell at horizon
- IRR
- 55.1%
- Equity multiple
- 5.07×
- Total profit
- $1,140,453
- Equity at exit
- $842,180
- IRR
- 51.3%
- Equity multiple
- 12.26×
- Total profit
- $3,153,007
- Equity at exit
- $1,757,154
Cash invested: $280,000 (down + closing). Projections, not guarantees.
Landlord ↔ Tenant lean methodology
- Overall (STATE)
- 15 Strongly Tenant-Friendly
- State New York
- 15 Strongly Tenant-Friendly · D+10
- County
- — inherits STATE
- City
- — inherits STATE
ZIP-level market 11963
- Home prices YoY
- 1.9%
- Rents YoY
- 10.8%
- Active inventory
- 66
- Price-to-rent
- 4.5×
Monthly cashflow live
- Estimated rent
- $18,517 medium interval (Pro) →
- Mortgage (P&I)
- −$5,244
- Tax from tax record
- −$278 /mo · $3,336/yr
- Insurance
- −$417
- HOA
- −$0
- Vacancy / Maint / Mgmt
- −$3,889
- Net cashflow
- $8,690
Break-even live
Sensitivity live
| Price | -10% $9,256 | -5% $8,973 | +0% $8,690 | +5% $8,407 | +10% $8,124 |
|---|---|---|---|---|---|
| Rent | -10% $7,227 | -5% $7,958 | +0% $8,690 | +5% $9,421 | +10% $10,153 |
| Rate | -1.0pp $9,193 | -0.5pp $8,944 | base $8,690 | +0.5pp $8,431 | +1.0pp $8,167 |
UW: 25.0% down · 7.5% · 30yr · 1.5% tax · 5.0% vac · 8.0% maint · 8.0% mgmt
Financing live
Cash to close
- Down payment
- $250,000
- Closing costs
- $30,000
- Reserves months
- —
- Total cash needed
- —
Loan-product check · same deal, 3 products live
Conventional
25% down · 7.5% · 30yr
- Down + closing
- —
- Monthly P&I
- —
- Monthly cashflow
- —
- DSCR
- —
- Eligible?
- —
Personal DTI + credit; lowest rate.
DSCR
20% down · 8.5% · 30yr
- Down + closing
- —
- Monthly P&I
- —
- Monthly cashflow
- —
- DSCR
- —
- Eligible?
- —
No personal income docs; deal must DSCR.
Hard money
10% down · 12.0% · 12mo
- Down + closing
- —
- Monthly P&I
- —
- Monthly cashflow
- —
- DSCR
- —
- Eligible?
- —
Short-term bridge; refi at stabilization.
Listing history 7 events
-
2026-06-21days on market $1,000,000 Active 5 DOM
-
2026-06-18days on market $1,000,000 Active 2 DOM
-
2026-06-17pricestatusdays on market $1,000,000 Active 1 DOM
-
2026-05-12status Pending
-
2026-01-02price $1,100,000
-
2025-12-09price $1,150,000
-
2025-10-30$1,180,000 Active
ⓘ Source: listings_history table (triggers on properties + properties_extension) + one-shot
backfill from property_details.listing_events for pre-trigger history.
Tax reassessment forecast NY · Partial reset (capped growth)
- Current annual tax
- $3,336 · $278/mo
- Projected year-2 tax
- $10,118 · $843/mo
- Expected delta
- +$6,782/yr (+$565/mo · 203.3%)
ⓘ Screening estimate from a state-policy table — verify with the county assessor before closing.
Nearby sold comps map
Loading sold comps map…
Walkable amenities ~0.75 mi
Loading nearby amenities…
Taxation est. · year 1
- Rental income
- $222,207
- − Mortgage interest
- −$56,016
- − Property taxes
- −$3,336
- − Insurance
- −$5,000
- − Repairs & maintenance
- −$17,777
- − Management
- −$17,777
- − Depreciation
- −$29,091
- Taxable income
- $93,212
- Est. tax owed @ 24.0%
- −$22,371
- After-tax cash flow
- $81,908/yr
For passive investors: Depreciation is non-cash, so a rental often shows a tax loss while cash-flowing — sheltering income. Rental losses are passive: they offset passive income freely, and up to $25,000/yr can offset ordinary (W-2) income if you actively participate and your MAGI is under $100k (phasing out to $0 by $150k); unused losses carry forward. On sale, claimed depreciation is recaptured at up to 25%, and gains may owe capital-gains tax (a 1031 exchange can defer both). Figures are a year-1 estimate at your 24.0% rate — not tax advice; consult a CPA.
Schools (NCES district)
- District
- Sag Harbor Union Free School District
- NCES district ID
- 3625380
- Math proficiency
- 54% ▼ -13.00%
- Reading proficiency
- 70% ▲ 7.00%
- Median HH income
- $81,547
- Composite
- 55.69/100
- National rank
- #1222
- State rank
- #175 of 590 in NY
Livability — Noyack
- Score
- 57/100
- State rank
- #1084
- US rank
- #21915
Category grades
Schools grade is shown separately in the Schools card above.
Census & demographics
- Census place
- Noyack, NY
- County
- Suffolk County · 679,920 people
- City population
- 8,114
- Metro
- New York-Newark-Jersey City, NY-NJ-PA
- Population (ZIP)
- 8,390
- Household income
- $127,746
- Rent vs Own
- Severe rent burden
- 95.0
Population outlook (Suffolk County) Hauer SSP2
- Today (2025)
- 1,505,262 people
- By 2030
- 1,498,318 · -0.5%
- By 2040
- 1,471,101 · -2.3%
- By 2050
- 1,424,848 · -5.3%
- By 2075
- 1,337,157 · -11.2%
- By 2100
- 1,217,720 · -19.1%
Race, ethnicity, and origin ACS 2023
- Neighborhood character
- Predominantly White (78%)
- Race & ethnicity
- White 78% Hispanic / Latino 13% Two or more races 11% Asian 4% Black 2%
- Hispanic origin (detail)
- Mexican 8%
- Common ancestry
- Scotch-Irish 4% Romanian 3% Italian 2%
- Foreign-born
- 13% · Canada, China, Jamaica
- Languages at home
- 81% English-only · Spanish 9% Other Indo-European 5% French/Haitian/Cajun 2%
Political lean MEDSL · Suffolk
- 2024 margin
- Lean R (+10.0) · D 45.0% · R 55.0%
- 2008→2024 swing
- -16.0pp toward R · 2008: 6.0pp · 2024: -10.0pp
- All cycles
- 2024: R+10.0 2020: R+0.0 2016: R+8.2 2012: D+2.9 2008: D+6.0
Not yet ingested
- Civics
- —
Market trends
- HPI YoY
- ▲ 9.19%
- Current HPI
- 499.3304
- Rent YoY
- ▲ 10.76%
- Metro
- New York-Newark-Jersey City, NY-NJ-PA
- State GDP YoY
- ▲ 2.60%
- F500 in state
- 92
Industry mix (Fortune 500 HQ in NY)
| Industry | F500 HQs | Revenue |
|---|---|---|
| Financial Services | 10 | $950B |
|
||
| Consumer Goods | 9 | $162B |
|
||
| Insurance | 4 | $225B |
|
||
| Telecommunications | 2 | $144B |
|
||
| Pharmaceuticals | 2 | $112B |
|
||
| Media / Entertainment | 2 | $69B |
|
||
Price history
-6.8% since first listed4 events — show timeline
- 2026-05-12 Pending — OneKey® MLS as Distributed by MLS Grid
- 2026-01-02 Price Changed $1,100,000 OneKey® MLS as Distributed by MLS Grid
- 2025-12-09 Price Changed $1,150,000 OneKey® MLS as Distributed by MLS Grid
- 2025-10-30 Listed $1,180,000 OneKey® MLS as Distributed by MLS Grid
Property tax history
+1.0%/yrLatest (2022): $3,336 · +0.0% YoY. Source: county tax records.
Cash-flow waterfall
monthlySold comps — $/sqft
last 12 mo · ≤1 miLoading sold comps…