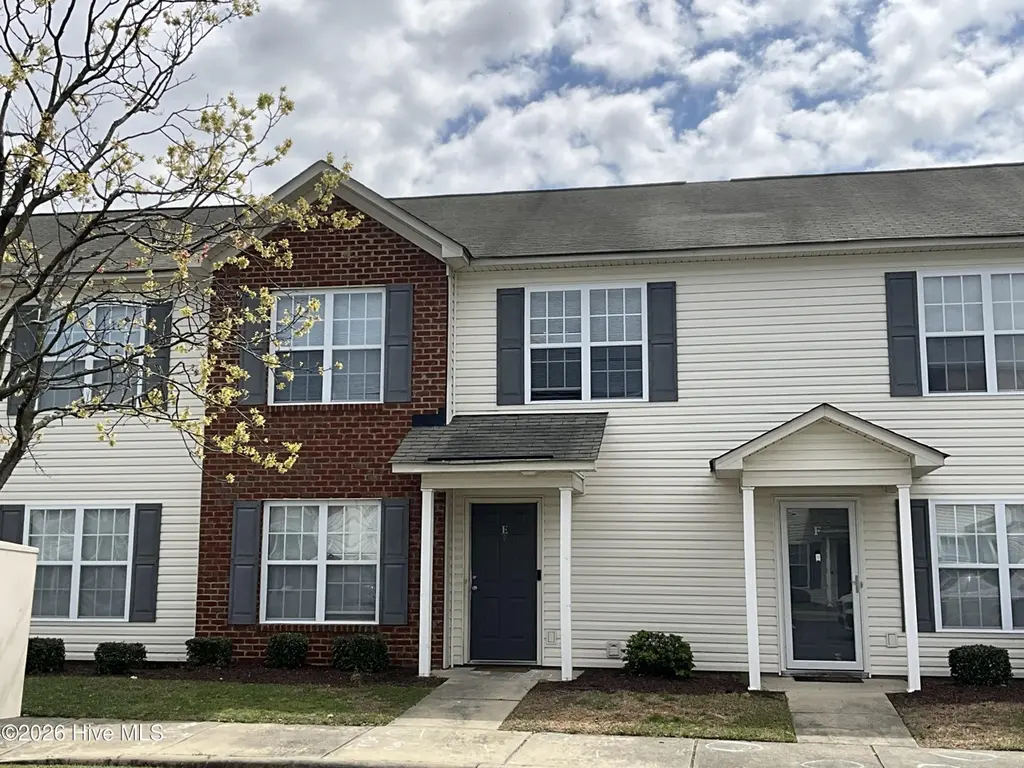
4243 Dudleys Grant Dr Unit E · Greenville, NC
Flood risk 1/10 · Minimal
- FEMA flood zone
- X (unshaded)
- Chance of flooding over 30 yrs
- 0.0%
- Est. flood insurance / yr
- $507 – $1,088
Fire risk 3/10 · Minor
- Est. fire insurance / yr
- $906 – $1,684
Heat risk 8/10 · Major
- Hot days now (above 107°F)
- 7 days/yr
- Hot days in 30 yrs
- 17 days/yr
Wind risk 8/10 · Major
- Chance of severe wind over 30 yrs
- 80.0%
Air-quality risk 3/10 · Minor
- Unhealthy air days now
- 3 days/yr
- Unhealthy air days in 30 yrs
- 3 days/yr
Risk factors via First Street. Map © Google.
Why this score? — see what drove the C- grade
The composite is a weighted blend of 9 inputs, each scored 0–100. Each bar is that input's sub-score; the figure is the points it added to the 100-point composite (weight × sub-score).
- Cash flow +19.8/30.0
- ARV discount +7.5/15.0
- DSCR +6.3/10.0
- 1% rule +5.5/10.0
- Livability +3.9/5.0
- Schools +3.6/10.0
- Rent growth +2.9/5.0
- Condition / age +2.5/5.0
- Appreciation +0.0/10.0
$179,900
🖨 Deal sheet 📄 Offer letter ✓ Due diligence
Listing remarks MLS
PORTER FLOOR PLAN. OPEN FLOOR PLAN WITH ELECTRIC FIREPLACE IN LIVING ROOM. HOA DUES INCLUDE BASIC CABLE.
Key facts
- Near dining
- Near shopping
- Near local schools
Tags
Property features AI
Finance
- Other: Subdivision: Dudleys Grant; Zoning: R6; Directions: Firetower Rd to Dudleys Grant
- Financial info: Tax information not included per instructions
- HOA & community: Homeowners association present; Annual association fee of $1,116 (approximately $93/month)
Exterior
- Parking: Paved parking
- Security: Information not provided
- Utilities: Sewer connected; Water connected; Power information not provided
- Home design: Townhouse (residential); Two levels; Entry details not provided; Facing direction not provided
- Construction: Vinyl siding and frame construction; Shingle roof; Slab foundation; Built year not provided
- Exterior features: Patio; Privacy fencing; Paved road access; Has a view
Interior
- Kitchen: Eat-in kitchen
- Bedrooms: Information not provided
- Flooring: Information not provided
- Bathrooms: 2 full bathrooms; 1 half bathroom
- Heating & cooling: Electric heating; Heat pump; Central air conditioning
- Interior features: Eat-in kitchen; Total of 6 rooms
- Laundry & utility: Information not provided
Neighborhood map
What this means for you Summary
Snapshot
- This is a 3-bed/2.5-bath condo listed at $180k.
Deal economics
- At list price, monthly cash flow is $214 ($3k/yr) — positive.
- The deal already cash-flows at list — no discount required.
- Meets the 1% rule at list price ($2k rent vs $180k).
- Recommended offer: $169k (6.0% below list) — sets the bar for market timing.
- Cap rate 7.7% vs local median 3.8% in Greenville — top-decile yield for the area; either an underpriced asset or a hidden risk that comps aren't pricing in. Stress-test before assuming the spread holds.
Location & tenants
- Location reads 77/100 on livability (#30 in NC, #2,977 nationally) — a middle-class / working-renter tenant base. Strengths: commute A+, cost of living A+, health & safety A+; Watch: crime F, employment F.
- Pitt County Schools (rural): math 41% / reading 44% proficiency, ranked #100 of 178 in NC (top 56%) — families likely to look elsewhere, expect single-tenant / working-renter base with shorter leases.
- Zoned schools: Wintergreen Primary (722 students, 45% FRL); Hope Middle (math 72% / reading 68%, grade A, #19 of 475 statewide, top 4%, 877 students, 35% FRL); South Central (math 42% / reading 51%, grade D-, #344 of 535 statewide, top 64%, 1,675 students, 55% FRL).
- Zoned-school proficiency averages 58% at this address vs 42% district-wide (+16 pts) — the actual schools serving this property are materially stronger than the Pitt County Schools average implies; a family-tenant draw the district grade alone would hide.
- Market conditions: Rents rising (+1.4%/yr); 278 active listings in the ZIP; 7 comparable units currently listed for rent nearby; rentals at typical pace (median 21d on market — plan ~3-4 weeks tenant-placement turnaround); solid renter incomes; 1,300 units permitted in Pitt County in 2024 (204 in 5+ unit buildings).
Forward outlook
- Local home prices are declining (-3.0%/yr); year-one equity from $1k of loan paydown is wiped out by about $5k of value loss. Plan a longer hold.
- Pitt County population projected at +22% by 2050 — long-run rental-demand tailwind backs the buy-and-hold thesis.
Negotiation context
- It's been on market 85 days — a 6% lower offer ($169k) is reasonable based on typical stale-listing flexibility.
- 2 sale attempts since 19y ago with the ask held roughly flat each time — persistent listings suggest the price (not the market) is what's stuck; bring a comps-based counter.
- Current owner paid $104k; list at $180k implies a 73% gain — meaningful room to come down on a strong offer.
Risks & watch-outs
- Climate carrying-cost: severe wind risk, 80% chance of damaging wind over 30y; extreme-heat days projected 7→17/yr by 2055 (HVAC capex compounding) — expect insurance premiums to compound above CPI over the hold.
Questions for the listing agent
- It's been on market 85 days. Have you received any prior offers? Is the seller open to a 6% concession, seller financing, or rate buy-down credit?
- What does the HOA fee cover, when was the last increase, and are there any pending special assessments or reserve-fund shortfalls?
- Any open or pending special assessments — roof, HVAC, plumbing, elevator, façade? What's the per-unit balance and payoff schedule, and is the seller paying it off at close or rolling it to the buyer?
- Why hasn't it sold? Are there any deal-killer items the seller is aware of (foundation, flood, title, zoning, code violations)?
- Is there a deadline driving the sale (1031 exchange, divorce, estate, relocation)? That informs how much negotiation room exists.
- Crime grade is F in this area — have there been break-ins, vandalism, or insurance claims at this property in the last 3 years? What carrier currently insures it and at what premium?
- What's the average days-on-market for RENTAL listings here right now (not sales)? A rising rental-DOM trend means longer vacancies and softer asking-rent achievability than the comps imply.
- What's the recent tenant-quality profile in this submarket — average credit score on applications, eviction rate, late-payment / NSF rate, and stable-employment percentage? A property-management company in the area should have these aggregated.
- How much new apartment / multifamily construction is in the pipeline within 1–3 miles? Heavy new supply (>2% of stock underway) typically softens rents 12–24 months out; light construction supports rent growth.
Investment metrics
- 1% rule
- 1.05% ✓
- Cap rate
- 7.72%
- Cash-on-cash
- 5.11%
- DSCR
- 1.23
- GRM
- 8.0
CMA / ARV
No comps found within radius.
Projected returns pro-forma
-3.0% appreciation · 1.43% rent growth · sell at horizon
- IRR
- -10.2%
- Equity multiple
- 0.64×
- Total profit
- $-18,377
- Equity at exit
- $26,824
- IRR
- -3.2%
- Equity multiple
- 0.80×
- Total profit
- $-9,876
- Equity at exit
- $15,554
Cash invested: $50,372 (down + closing). Projections, not guarantees.
Landlord ↔ Tenant lean methodology
- Overall (STATE)
- 85 Strongly Landlord-Friendly
- State North Carolina
- 85 Strongly Landlord-Friendly · R+3
- County
- — inherits STATE
- City
- — inherits STATE
ZIP-level market 28590
- Home prices YoY
- -23.7%
- Rents YoY
- 1.4%
- Active inventory
- 278
- Price-to-rent
- 8.0×
Monthly cashflow live
- Estimated rent
- $1,884 high interval (Pro) →
- Mortgage (P&I)
- −$943
- Tax from tax record
- −$163 /mo · $1,953/yr
- Insurance
- −$75
- HOA
- −$93
- Vacancy / Maint / Mgmt
- −$396
- Net cashflow
- $214
Break-even live
UW: 25.0% down · 7.5% · 30yr · 1.5% tax · 5.0% vac · 8.0% maint · 8.0% mgmt
Financing live
Cash to close
- Down payment
- $44,975
- Closing costs
- $5,397
- Reserves months
- —
- Total cash needed
- —
Loan-product check · same deal, 3 products live
Conventional
25% down · 7.5% · 30yr
- Down + closing
- —
- Monthly P&I
- —
- Monthly cashflow
- —
- DSCR
- —
- Eligible?
- —
Personal DTI + credit; lowest rate.
DSCR
20% down · 8.5% · 30yr
- Down + closing
- —
- Monthly P&I
- —
- Monthly cashflow
- —
- DSCR
- —
- Eligible?
- —
No personal income docs; deal must DSCR.
Hard money
10% down · 12.0% · 12mo
- Down + closing
- —
- Monthly P&I
- —
- Monthly cashflow
- —
- DSCR
- —
- Eligible?
- —
Short-term bridge; refi at stabilization.
Rent comps 7 comps
| Address | Beds | Baths | Sqft | Rent | $/sqft | DOM | Units | Dist |
|---|---|---|---|---|---|---|---|---|
| 611 Legacy Ct Winterville, NC | 1.0–3.0 | 1.0–2.0 | 1155 | $1,935 | $1.67 | 13d | 31 | 0.08mi |
| 311 Nantucket Ct Winterville, NC | 3.0 | 2.5 | 1612 | $1,850 | $1.15 | 13d | 1 | 0.33mi |
| 904 Persimmon Pl Winterville, NC | 2.0 | 2.0 | 1154 | $1,400 | $1.21 | 21d | 1 | 0.39mi |
| 1204 White Hall Rd Winterville, NC | 3.0 | 2.0 | 1392 | $1,795 | $1.29 | 21d | 1 | 0.57mi |
| 409 Ophelia WAY Winterville, NC | 2.0 | 2.5 | 1852 | $2,170 | $1.17 | 13d | 20 | 1.31mi |
| 720 Carrington Ln Winterville, NC | 3.0 | 2.0 | 1304 | $1,950 | $1.50 | 21d | 1 | 1.41mi |
| 2200 Bellamy Cir Greenville, NC | 2.0–4.0 | 2.0–4.0 | 1120 | $1,475 | $1.32 | 21d | 45 | 1.45mi |
HOA detail condo
- Monthly dues
- $93 · $1,116/yr
- Likely covers
- electriccable
- Assessments
- None detected in remarks — confirm with the listing agent.
Listing history 19 events
-
2026-06-19days on market $179,900 Active 85 DOM
-
2026-06-18days on market $179,900 Active 84 DOM
-
2026-06-17days on market $179,900 Active 83 DOM
-
2026-06-16days on market $179,900 Active 82 DOM
-
2026-06-15days on market $179,900 Active 81 DOM
-
2026-06-13days on market $179,900 Active 78 DOM
-
2026-06-10days on market $179,900 Active 76 DOM
-
2026-06-09days on market $179,900 Active 75 DOM
-
2026-06-08days on market $179,900 Active 74 DOM
-
2026-06-07days on market $179,900 Active 73 DOM
-
2026-06-05days on market $179,900 Active 70 DOM
-
2026-06-03days on market $179,900 Active 69 DOM
-
2026-06-02days on market $179,900 Active 68 DOM
-
2026-06-01days on market $179,900 Active 67 DOM
-
2026-05-31days on market $179,900 Active 66 DOM
-
2026-05-30days on market $179,900 Active 65 DOM
-
2026-03-25$179,900 Active
-
2008-07-02soldstatus $103,900 104-char remark
Show marketing remark (104 chars)
PORTER FLOOR PLAN. OPEN FLOOR PLAN WITH ELECTRIC FIREPLACE IN LIVING ROOM. HOA DUES INCLUDE BASIC CABLE.
-
2007-07-17$103,900 104-char remark
Show marketing remark (104 chars)
PORTER FLOOR PLAN. OPEN FLOOR PLAN WITH ELECTRIC FIREPLACE IN LIVING ROOM. HOA DUES INCLUDE BASIC CABLE.
ⓘ Source: listings_history table (triggers on properties + properties_extension) + one-shot
backfill from property_details.listing_events for pre-trigger history.
Tax reassessment forecast NC · Resets to sale price
- Current annual tax
- $1,953 · $163/mo
- Projected year-2 tax
- $1,953 · $163/mo
- Expected delta
- $0/yr ($0/mo · -0.0%)
ⓘ Screening estimate from a state-policy table — verify with the county assessor before closing.
Climate risk First Street
- Flood 1/10 Low FEMA zone X (unshaded) · 0% chance over 30 yrs
- Wildfire 3/10 Moderate
- Heat 8/10 Severe 7 d/yr ≥107°F today · 17 d/yr by 30 yrs out
- Wind 8/10 Severe 80% chance of damaging wind over 30 yrs
- Air quality 3/10 Moderate 3 unhealthy d/yr today · 3 by 30 yrs out
Nearby sold comps map
Loading sold comps map…
Walkable amenities ~0.75 mi
Loading nearby amenities…
Taxation est. · year 1
- Rental income
- $22,611
- − Mortgage interest
- −$10,077
- − Property taxes
- −$1,953
- − Insurance
- −$900
- − Repairs & maintenance
- −$1,809
- − Management
- −$1,809
- − HOA
- −$1,116
- − Depreciation
- −$5,233
- Taxable loss
- −$286
- Est. tax savings @ 24.0%
- +$69
- After-tax cash flow
- $2,642/yr
For passive investors: Depreciation is non-cash, so a rental often shows a tax loss while cash-flowing — sheltering income. Rental losses are passive: they offset passive income freely, and up to $25,000/yr can offset ordinary (W-2) income if you actively participate and your MAGI is under $100k (phasing out to $0 by $150k); unused losses carry forward. On sale, claimed depreciation is recaptured at up to 25%, and gains may owe capital-gains tax (a 1031 exchange can defer both). Figures are a year-1 estimate at your 24.0% rate — not tax advice; consult a CPA.
Schools (NCES district)
- District
- Pitt County Schools
- NCES district ID
- 3700012
- Math proficiency
- 41% ▬ 0.00%
- Reading proficiency
- 44% ▲ 2.00%
- Median HH income
- $40,631
- Composite
- 35.67/100
- National rank
- #4877
- State rank
- #100 of 178 in NC
Livability — Greenville
- Score
- 77/100
- State rank
- #30
- US rank
- #2977
Category grades
Schools grade is shown separately in the Schools card above.
Census & demographics
- Census place
- Greenville, NC
- County
- Pitt County · 142,592 people
- City population
- 115,121
- Metro
- Greenville, NC
- Population (ZIP)
- 27,471
- Household income
- $83,880
- Rent vs Own
- Severe rent burden
- 391.0
Population outlook (Pitt County) Hauer SSP2
- Today (2025)
- 194,585 people
- By 2030
- 203,756 · +4.7%
- By 2040
- 220,807 · +13.5%
- By 2050
- 236,614 · +21.6%
- By 2075
- 275,940 · +41.8%
- By 2100
- 300,058 · +54.2%
Race, ethnicity, and origin ACS 2023
- Neighborhood character
- Diverse neighborhood (Simpson 0.56)
- Race & ethnicity
- White 58% Black 32% Two or more races 5% Hispanic / Latino 4% Asian 2%
- Common ancestry
- Italian 3% Serbian 3% Slovak 2%
- Foreign-born
- 6% · Canada, China
- Languages at home
- 92% English-only · Spanish 4% Other Asian/Pacific 1% Arabic 1%
Political lean MEDSL · Pitt
- 2024 margin
- Lean D (+6.0) · D 52.5% · R 46.5% · Other 1.1%
- 2008→2024 swing
- -2.8pp toward R · 2008: 8.8pp · 2024: 6.0pp
- All cycles
- 2024: D+6.0 2020: D+9.4 2016: D+7.4 2012: D+6.7 2008: D+8.8
Not yet ingested
- Civics
- —
Market trends
- HPI YoY
- ▼ -56.97%
- Current HPI
- 183.8477
- Rent YoY
- ▲ 1.43%
- Metro
- Greenville, NC
- State GDP YoY
- ▲ 3.28%
- F500 in state
- 26
Industry mix (Fortune 500 HQ in NC)
| Industry | F500 HQs | Revenue |
|---|---|---|
| Financial Services | 2 | $213B |
|
||
| Retail | 2 | $95B |
|
||
| Industrial Conglomerate | 1 | $38B |
|
||
| Metals / Steel | 1 | $35B |
|
||
| Utilities | 1 | $30B |
|
||
| Industrial Machinery | 1 | $19B |
|
||
Price history
+73.1% since first listed3 events — show timeline
- 2026-03-25 Listed $179,900 Hive MLS
- 2008-07-02 Sold (MLS) $103,900 Hive MLS
- 2007-07-17 Listed $103,900 Hive MLS
Property tax history
+5.8%/yrLatest (2025): $1,953 · +0.6% YoY. Source: county tax records.
Cash-flow waterfall
monthlySold comps — $/sqft
last 12 mo · ≤1 miLoading sold comps…