 Duplex
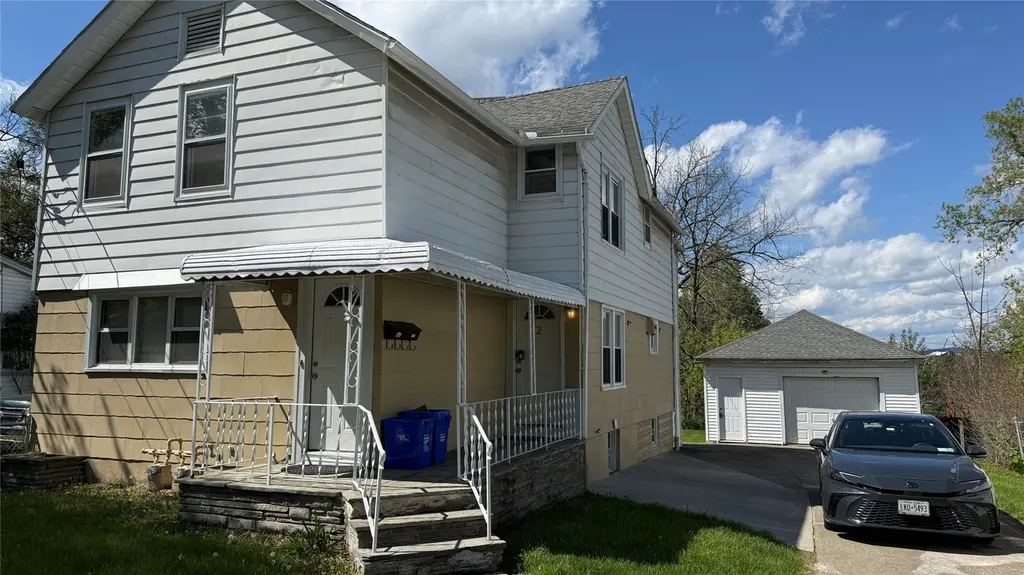
9 Hancock St · Binghamton, NY
Flood risk 1/10 · Minimal
- FEMA flood zone
- X
- Chance of flooding over 30 yrs
- 0.0%
- Est. flood insurance / yr
- $473 – $860
Fire risk 3/10 · Minor
- Est. fire insurance / yr
- $691 – $1,283
Heat risk 3/10 · Minor
- Hot days now (above 92°F)
- 7 days/yr
- Hot days in 30 yrs
- 16 days/yr
Wind risk 2/10 · Minimal
- Chance of severe wind over 30 yrs
- 2.0%
Air-quality risk 2/10 · Minimal
- Unhealthy air days now
- 0 days/yr
- Unhealthy air days in 30 yrs
- 1 days/yr
Risk factors via First Street. Map © Google.
Why this score? — see what drove the C grade
The composite is a weighted blend of 9 inputs, each scored 0–100. Each bar is that input's sub-score; the figure is the points it added to the 100-point composite (weight × sub-score).
- Cash flow +22.6/30.0
- Appreciation +10.0/10.0
- 1% rule +7.4/10.0
- DSCR +7.3/10.0
- Livability +3.9/5.0
- Schools +3.0/10.0
- Rent growth +2.5/5.0
- Condition / age +2.5/5.0
- ARV discount +0.0/15.0
$195,000
🖨 Deal sheet (PDF) 📄 Offer letter ✓ Due diligence
Multi-family units
County records classify this as Multi-Family (2-4 Unit). Listing-text estimate: 2 units. confirmed
Listing remarks MLS
Nice two family on a fully fenced lot with separate utilities. Each unit has two bedrooms, large living room & kitchen and plenty of closet space. Hardwood floors, updated bathrooms, updated boilers. Electric, plumbing, windows & water heaters have been updated. Large private yard and oversized detached garage. Convenient location, could be great investment or owner occupy!
Key facts
- Two-family home
- Large private lot
- Outdoor space
Tags
Property features AI
Finance
- Financial info: Two 2-bedroom/1-bath units; one unit listed with actual rent $950
Exterior
- Parking: Detached oversized garage; Driveway; Garage with 1 parking space
- Utilities: Public water; Public sewer; Cable available
- Home design: Duplex residential income property
- Construction: Aluminum siding; Wood siding
- Exterior features: Deck; Covered porch; Enclosed porch; Fenced yard; Level lot
Interior
- Kitchen: Gas water heater (serves kitchen appliances)
- Bedrooms: Two-bedroom units (each unit listed as 2 bedrooms)
- Flooring: Hardwood flooring; Laminate flooring
- Bathrooms: One full bathroom in each unit; Two full bathrooms total on property
- Heating & cooling: Baseboard heating; Ceiling fan(s) for cooling
- Interior features: Storm windows; Insulated windows; Gas water heater; Basement
- Laundry & utility: Washer hookup
Neighborhood map
What this means for you Summary
Snapshot
- This is a 2 × 2-bed/1.0-bath units multifamily listed at $195k.
Deal economics
- At list price, monthly cash flow is $333 ($4k/yr) — positive. Per door: $166/mo.
- The deal already cash-flows at list — no discount required.
- Meets the 1% rule at list price ($2k rent vs $195k).
- Recommended offer: $189k (3.0% below list) — sets the bar for market timing.
Location & tenants
- Location reads 78/100 on livability (#174 in NY, #2,710 nationally) — a middle-class / working-renter tenant base. Strengths: amenities A+, commute A+, cost of living A+; Watch: crime F, employment F.
- Binghamton City School District (urban): math 30% / reading 44% proficiency, ranked #557 of 590 in NY (top 94%) — families likely to look elsewhere, expect single-tenant / working-renter base with shorter leases; 61% free/reduced lunch — lower-income household profile, screen leases tightly.
- Zoned schools: Benjamin Franklin Elementary School (math 17% / reading 32%, grade F, #1,846 of 2,108 statewide, top 91%, 399 students, 75% FRL); Binghamton High School (math 71% / reading 79%, grade A-, #631 of 1,100 statewide, top 58%, 1,341 students, 69% FRL).
- Zoned-school proficiency averages 50% at this address vs 37% district-wide (+13 pts) — the actual schools serving this property are materially stronger than the Binghamton City School District average implies; a family-tenant draw the district grade alone would hide.
- Market conditions: 112 active listings in the ZIP; 18 comparable units currently listed for rent nearby; rentals lingering (median 46d on market — plan ~5-8 weeks vacancy on turnover, expect pricing pressure); 67% of comp listings sitting > 30 days — soft ceiling on asking rent; 340 units permitted in Broome County in 2024 (269 in 5+ unit buildings).
Forward outlook
- In year one you build about $21k of equity ($1k loan paydown + $20k appreciation (10.0% local appreciation)).
- Broome County population projected at -13% by 2050 — secular population decline; favor cash flow + early exit over multi-decade hold.
- At projected returns (10.0% appreciation + 3.0% rent growth), your $55k cash investment doubles in ~3 years — after that, you're playing with house money.
- By year 2, paydown + projected appreciation supports a ~$34k cash-out refi (75% LTV) — recoverable capital for the next deal without selling this one.
Negotiation context
- It's been on market 41 days — a 3% lower offer ($189k) is reasonable based on typical stale-listing flexibility.
- 3 sale attempts since 10y ago; this cycle's ask is 8% above the opening price — seller raised mid-cycle; expect resistance to lowballs.
- Current owner paid $39k; list at $195k implies a 400% gain — meaningful room to come down on a strong offer.
Risks & watch-outs
- Watch-outs: property tax is 3.0% of price; built in 1900 — expect roof / HVAC / electrical / plumbing capex.
Questions for the listing agent
- It's been on market 41 days. Have you received any prior offers? Is the seller open to a 3% concession, seller financing, or rate buy-down credit?
- Can we see the unit-by-unit rent roll, current vacancy, and any below-market leases? What's the average tenancy length?
- What capital expenditures (roof, boiler, parking lot, exteriors) have been made in the last 5 years, and what's planned in the next 2?
- Built in 1900 — when were the roof, HVAC, electrical panel, plumbing, and water heater last replaced?
- Property tax is high relative to price — has the assessment been appealed recently, and will the sale trigger a re-assessment?
- Is there a deadline driving the sale (1031 exchange, divorce, estate, relocation)? That informs how much negotiation room exists.
- Schools are D-rated, which usually means shorter tenancies and higher turnover. Who's the typical renter profile here, and what's been the actual vacancy rate?
- Crime grade is F in this area — have there been break-ins, vandalism, or insurance claims at this property in the last 3 years? What carrier currently insures it and at what premium?
- What's the average days-on-market for RENTAL listings here right now (not sales)? A rising rental-DOM trend means longer vacancies and softer asking-rent achievability than the comps imply.
- What's the recent tenant-quality profile in this submarket — average credit score on applications, eviction rate, late-payment / NSF rate, and stable-employment percentage? A property-management company in the area should have these aggregated.
- How much new apartment / multifamily construction is in the pipeline within 1–3 miles? Heavy new supply (>2% of stock underway) typically softens rents 12–24 months out; light construction supports rent growth.
Investment metrics
- 1% rule
- 1.24% ✓
- Cap rate
- 8.34%
- Cash-on-cash
- 7.32%
- DSCR
- 1.33
- GRM
- 6.7
CMA / ARV
- ARV (on-the-fly)
- $130,240
- Comps found
- 8
Show comp detail 8 sales within ~0.75 mi
| Address | Dist | Beds/Ba | Sqft | Sold | Price | $/sf | Match |
|---|---|---|---|---|---|---|---|
| 8 Grand St | 0.19mi | 4/2.0 (+1) | 1,788 (+10%) | 2mo | $105,000 | $59 | 68 |
| 2 Carlton St | 0.02mi | 4/2.0 (+1) | 1,728 (+6%) | 20mo | $175,000 | $101 | 67 |
| 6 Jay St St | 0.46mi | 4/2.0 (+1) | 1,687 (+4%) | 0mo | $140,000 | $83 | 67 |
| 34 Evans St | 0.36mi | 4/2.0 (+1) | 1,752 (+8%) | 10mo | $42,000 | $24 | 57 |
| 51 Tremont Ave | 0.38mi | 4/2.0 (+1) | 1,440 (-12%) | 4mo | $70,000 | $49 | 55 |
| 91 Mary St | 0.58mi | 4/2.0 (+1) | 1,656 (+2%) | 16mo | $132,000 | $80 | 52 |
| 142 Hawley St | 0.42mi | 3/2.0 | 1,820 (+12%) | 14mo | $84,000 | $46 | 49 |
| 29 Pearl Ave | 0.48mi | 3/2.0 | 1,440 (-12%) | 22mo | $143,000 | $99 | 40 |
Match score weights: distance 35% · size 25% · config 20% · recency 20%. Top-matched comps best support the ARV.
Projected returns pro-forma
10.0% appreciation · 3.0% rent growth · sell at horizon
- IRR
- 29.6%
- Equity multiple
- 3.34×
- Total profit
- $127,589
- Equity at exit
- $175,671
- IRR
- 25.7%
- Equity multiple
- 7.58×
- Total profit
- $359,415
- Equity at exit
- $378,842
Cash invested: $54,600 (down + closing). Projections, not guarantees.
Landlord ↔ Tenant lean methodology
- Overall (STATE)
- 15 Strongly Tenant-Friendly
- State New York
- 15 Strongly Tenant-Friendly · D+10
- County
- — inherits STATE
- City
- — inherits STATE
ZIP-level market 13903
- Home prices YoY
- 4.3%
- Active inventory
- 112
- Price-to-rent
- 13.4×
Monthly cashflow live
- Estimated rent
- $2,427 high interval (Pro) →
- Mortgage (P&I)
- −$1,023
- Tax from tax record
- −$481 /mo · $5,767/yr
- Insurance
- −$81
- HOA
- −$0
- Vacancy / Maint / Mgmt
- −$510
- Net cashflow
- $333
Break-even live
Sensitivity live
| Price | -10% $443 | -5% $388 | +0% $333 | +5% $278 | +10% $223 |
|---|---|---|---|---|---|
| Rent | -10% $141 | -5% $237 | +0% $333 | +5% $429 | +10% $525 |
| Rate | -1.0pp $431 | -0.5pp $383 | base $333 | +0.5pp $282 | +1.0pp $231 |
2-unit breakdown (identical units grouped — click to expand)
| Units | Beds | Baths | Est. rent |
|---|---|---|---|
| 2× units | 2 | 1 | $2,426 |
| #1 | 2 | 1 | $1,213 |
| #2 | 2 | 1 | $1,213 |
| Total (2 units) | $2,427 | ||
UW: 25.0% down · 7.5% · 30yr · 1.5% tax · 5.0% vac · 8.0% maint · 8.0% mgmt
Financing live
Cash to close
- Down payment
- $48,750
- Closing costs
- $5,850
- Reserves months
- —
- Total cash needed
- —
Loan-product check · same deal, 3 products live
Conventional
25% down · 7.5% · 30yr
- Down + closing
- —
- Monthly P&I
- —
- Monthly cashflow
- —
- DSCR
- —
- Eligible?
- —
Personal DTI + credit; lowest rate.
DSCR
20% down · 8.5% · 30yr
- Down + closing
- —
- Monthly P&I
- —
- Monthly cashflow
- —
- DSCR
- —
- Eligible?
- —
No personal income docs; deal must DSCR.
Hard money
10% down · 12.0% · 12mo
- Down + closing
- —
- Monthly P&I
- —
- Monthly cashflow
- —
- DSCR
- —
- Eligible?
- —
Short-term bridge; refi at stabilization.
Rent comps 18 comps
| Address | Beds | Baths | Sqft | Rent | $/sqft | DOM | Units | Dist |
|---|---|---|---|---|---|---|---|---|
| 86 Conklin Ave Binghamton, NY | 3.0 | 1.0 | 1316 | $1,600 | $1.22 | 15d | 1 | 0.16mi |
| 1 Euclid Ave Unit 1 Binghamton, NY | 3.0 | 1.0 | 1100 | $1,500 | $1.36 | 45d | 1 | 0.21mi |
| 113 Hawley St Binghamton, NY | 4.0 | 1.5 | 1637 | $2,000 | $1.22 | 45d | 1 | 0.46mi |
| 71 Mary St Unit 2 Binghamton, NY | 2.0 | 1.0 | 1100 | $1,300 | $1.18 | 15d | 1 | 0.49mi |
| 33 Fayette St Unit 22 Binghamton, NY | 2.0 | 1.0 | 1350 | $1,100 | $0.81 | 15d | 1 | 0.53mi |
| 136 Court St Unit 2 Binghamton, NY | 4.0 | 1.0 | 1373 | $3,000 | $2.18 | 45d | 1 | 0.55mi |
| 31 Indiana St Binghamton, NY | 3.0 | 1.5 | 1232 | $1,500 | $1.22 | 45d | 1 | 0.90mi |
| 171 Chapin St Unit 2nd FL Binghamton, NY | 4.0 | 2.0 | 1135 | $3,000 | $2.64 | 45d | 1 | 1.15mi |
| 171 Chapin St Unit 3rd FL Binghamton, NY | 2.0 | 1.0 | 1135 | $1,500 | $1.32 | 45d | 1 | 1.15mi |
| 171 Chapin St Unit 1st FL Binghamton, NY | 4.0 | 1.5 | 1400 | $3,000 | $2.14 | 45d | 1 | 1.15mi |
| 198 Chapin St Binghamton, NY | 4.0 | 2.0 | 1500 | $1,700 | $1.13 | 23d | 1 | 1.18mi |
| 53 Seminary Ave Unit 1 Binghamton, NY | 2.0 | 1.0 | 1722 | $925 | $0.54 | 23d | 1 | 1.18mi |
| 5 Arthur St Unit 2 Binghamton, NY | 4.0 | 1.0 | 1200 | $1,800 | $1.50 | 45d | 1 | 1.19mi |
| 73 Leroy St Unit 02 Binghamton, NY | 3.0 | 1.0 | 1100 | $1,950 | $1.77 | 45d | 1 | 1.21mi |
| 4 Erie St Unit 2 Binghamton, NY | 3.0 | 1.0 | 1075 | $1,200 | $1.12 | 45d | 1 | 1.30mi |
| 26 Johnson Ave Unit 1 Binghamton, NY | 3.0 | 1.0 | 1633 | $1,600 | $0.98 | 45d | 1 | 1.31mi |
| 29 Laurel Ave Unit 2 Binghamton, NY | 3.0 | 1.5 | 1500 | $2,250 | $1.50 | 45d | 1 | 1.37mi |
| 50 Lathrop Ave Unit 2 Binghamton, NY | 3.0 | 1.0 | 1250 | $1,600 | $1.28 | 15d | 1 | 1.46mi |
Listing history 24 events
-
2026-06-21days on market $195,000 Active 41 DOM
-
2026-06-19days on market $195,000 Active 39 DOM
-
2026-06-18days on market $195,000 Active 38 DOM
-
2026-06-17days on market $195,000 Active 37 DOM
-
2026-06-16days on market $195,000 Active 36 DOM
-
2026-06-15days on market $195,000 Active 35 DOM
-
2026-06-14days on market $195,000 Active 33 DOM
-
2026-06-13days on market $195,000 Active 32 DOM
-
2026-06-10days on market $195,000 Active 30 DOM
-
2026-06-09days on market $195,000 Active 29 DOM
-
2026-06-08days on market $195,000 Active 28 DOM
-
2026-06-07days on market $195,000 Active 27 DOM
-
2026-06-03days on market $195,000 Active 23 DOM
-
2026-06-02days on market $195,000 Active 22 DOM
-
2026-06-01days on market $195,000 Active 21 DOM
-
2026-05-31days on market $195,000 Active 20 DOM
-
2026-05-30days on market $195,000 Active 19 DOM
-
2026-05-20status Active
-
2026-05-15historical Active Under Contract
-
2026-05-11price $195,000
-
2026-05-11$180,000 Active
-
2016-10-14soldstatus $39,000 388-char remark
Show marketing remark (388 chars)
Nice two family on a fully fenced lot with separate utilities. Each unit has two bedrooms, large living room & kitchen and plenty of closet space. Hardwood floors, updated bathrooms, updated boilers. Electric, plumbing, windows & water heaters have been updated. Large private yard and oversized detached garage. Convenient location, could be great investment or owner occupy!
-
2016-07-23$49,900 388-char remark
Show marketing remark (388 chars)
Nice two family on a fully fenced lot with separate utilities. Each unit has two bedrooms, large living room & kitchen and plenty of closet space. Hardwood floors, updated bathrooms, updated boilers. Electric, plumbing, windows & water heaters have been updated. Large private yard and oversized detached garage. Convenient location, could be great investment or owner occupy!
-
2005-01-20soldstatus $55,000
ⓘ Source: listings_history table (triggers on properties + properties_extension) + one-shot
backfill from property_details.listing_events for pre-trigger history.
Tax reassessment forecast NY · Partial reset (capped growth)
- Current annual tax
- $5,767 · $481/mo
- Projected year-2 tax
- $5,767 · $481/mo
- Expected delta
- $0/yr ($0/mo · 0.0%)
ⓘ Screening estimate from a state-policy table — verify with the county assessor before closing.
Climate risk First Street
- Flood 1/10 Low FEMA zone X · 0% chance over 30 yrs
- Wildfire 3/10 Moderate
- Heat 3/10 Moderate 7 d/yr ≥92°F today · 16 d/yr by 30 yrs out
- Wind 2/10 Low 2% chance of damaging wind over 30 yrs
- Air quality 2/10 Low 0 unhealthy d/yr today · 1 by 30 yrs out
Nearby sold comps map
Loading sold comps map…
Walkable amenities ~0.75 mi
Loading nearby amenities…
Taxation est. · year 1
- Rental income
- $29,124
- − Mortgage interest
- −$10,923
- − Property taxes
- −$5,767
- − Insurance
- −$975
- − Repairs & maintenance
- −$2,330
- − Management
- −$2,330
- − Depreciation
- −$5,673
- Taxable income
- $1,127
- Est. tax owed @ 24.0%
- −$270
- After-tax cash flow
- $3,725/yr
For passive investors: Depreciation is non-cash, so a rental often shows a tax loss while cash-flowing — sheltering income. Rental losses are passive: they offset passive income freely, and up to $25,000/yr can offset ordinary (W-2) income if you actively participate and your MAGI is under $100k (phasing out to $0 by $150k); unused losses carry forward. On sale, claimed depreciation is recaptured at up to 25%, and gains may owe capital-gains tax (a 1031 exchange can defer both). Figures are a year-1 estimate at your 24.0% rate — not tax advice; consult a CPA.
Schools (NCES district)
- District
- Binghamton City School District
- NCES district ID
- 3604870
- Math proficiency
- 30% ▬ 0.00%
- Reading proficiency
- 44% ▲ 15.00%
- Median HH income
- $30,475
- Composite
- 30.09/100
- National rank
- #6342
- State rank
- #557 of 590 in NY
Livability — Binghamton
- Score
- 78/100
- State rank
- #174
- US rank
- #2710
Category grades
Schools grade is shown separately in the Schools card above.
Census & demographics
- Census place
- Binghamton, NY
- County
- Broome County · 126,805 people
- City population
- 65,170
- Metro
- Binghamton, NY
- Population (ZIP)
- 17,569
- Household income
- $66,278
- Rent vs Own
- Severe rent burden
- 602.0
Population outlook (Broome County) Hauer SSP2
- Today (2025)
- 187,989 people
- By 2030
- 183,066 · -2.6%
- By 2040
- 172,228 · -8.4%
- By 2050
- 163,161 · -13.2%
- By 2075
- 153,641 · -18.3%
- By 2100
- 140,851 · -25.1%
Race, ethnicity, and origin ACS 2023
- Neighborhood character
- Predominantly White (80%)
- Race & ethnicity
- White 80% Black 9% Two or more races 6% Hispanic / Latino 4% Asian 1%
- Common ancestry
- Romanian 6% Slovak 2% Scotch-Irish 2%
- Foreign-born
- 5% · Canada
- Languages at home
- 94% English-only · Spanish 2% Other Indo-European 1% Arabic 1%
Political lean MEDSL · Broome
- 2024 margin
- Toss-up / Even · D 50.2% · R 49.8%
- 2008→2024 swing
- -7.6pp toward R · 2008: 8.0pp · 2024: 0.4pp
- All cycles
- 2024: D+0.4 2020: D+3.5 2016: R+3.7 2012: D+4.6 2008: D+8.0
Not yet ingested
- Civics
- —
Market trends
- HPI YoY
- ▲ 11.68%
- Current HPI
- 286.1001
- Rent YoY
- —
- Metro
- Binghamton, NY
- State GDP YoY
- ▲ 2.60%
- F500 in state
- 92
Industry mix (Fortune 500 HQ in NY)
| Industry | F500 HQs | Revenue |
|---|---|---|
| Financial Services | 10 | $950B |
|
||
| Consumer Goods | 9 | $162B |
|
||
| Insurance | 4 | $225B |
|
||
| Telecommunications | 2 | $144B |
|
||
| Pharmaceuticals | 2 | $112B |
|
||
| Media / Entertainment | 2 | $69B |
|
||
Price history
+254.5% since first listed7 events — show timeline
- 2026-05-20 Relisted — GBAOR
- 2026-05-15 Contingent — GBAOR
- 2026-05-11 Price Changed $195,000 GBAOR
- 2026-05-11 Listed $180,000 GBAOR
- 2016-10-14 Sold (MLS) $39,000 GBAOR
- 2016-07-23 Listed $49,900 GBAOR
- 2005-01-20 Sold (Public Records) $55,000 Public Records
Property tax history
+4.7%/yrLatest (2025): $5,767 · +0.9% YoY. Source: county tax records.
Cash-flow waterfall
monthlySold comps — $/sqft
last 12 mo · ≤1 miLoading sold comps…