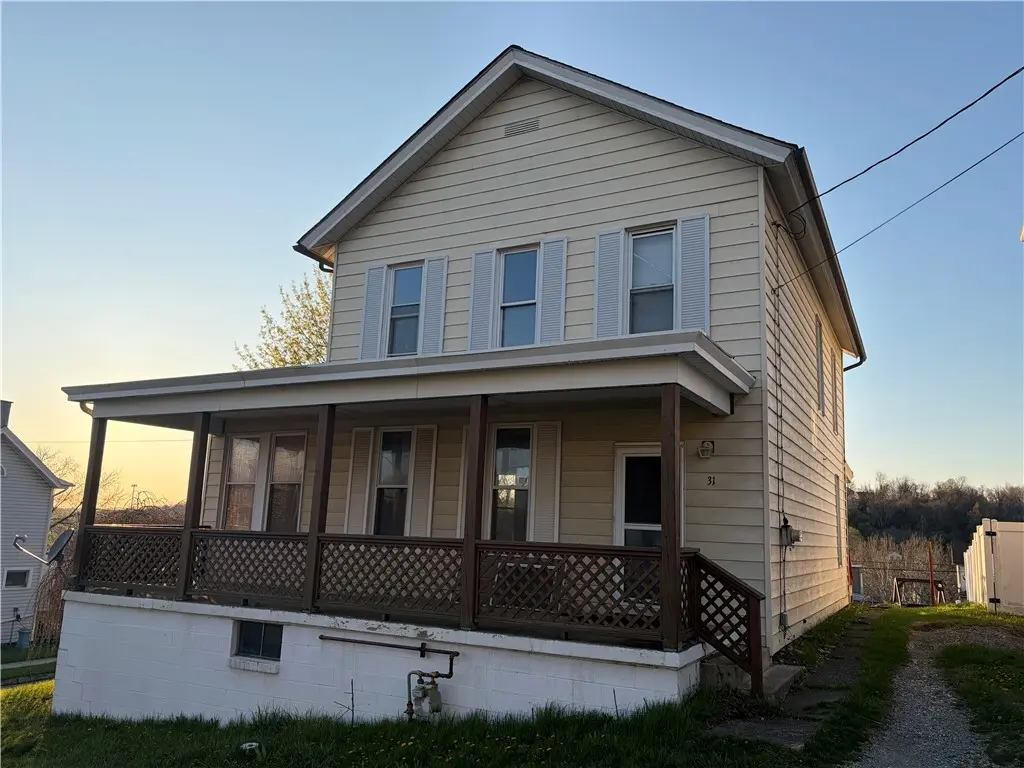
31 Observatory St · Manor, PA
Flood risk 1/10 · Minimal
- FEMA flood zone
- X (unshaded)
- Chance of flooding over 30 yrs
- 0.0%
- Est. flood insurance / yr
- $507 – $1,088
Fire risk 1/10 · Minimal
- Est. fire insurance / yr
- $511 – $949
Heat risk 4/10 · Minor
- Hot days now (above 96°F)
- 7 days/yr
- Hot days in 30 yrs
- 19 days/yr
Wind risk 2/10 · Minimal
- Chance of severe wind over 30 yrs
- —
Air-quality risk 3/10 · Minor
- Unhealthy air days now
- 3 days/yr
- Unhealthy air days in 30 yrs
- 5 days/yr
Risk factors via First Street. Map © Google.
Why this score? — see what drove the B+ grade
The composite is a weighted blend of 9 inputs, each scored 0–100. Each bar is that input's sub-score; the figure is the points it added to the 100-point composite (weight × sub-score).
- Cash flow +30.0/30.0
- 1% rule +10.0/10.0
- DSCR +10.0/10.0
- ARV discount +7.5/15.0
- Schools +4.9/10.0
- Appreciation +4.3/10.0
- Livability +3.4/5.0
- Rent growth +2.5/5.0
- Condition / age +2.5/5.0
$85,000
🖨 Deal sheet (PDF) 📄 Offer letter ✓ Due diligence
Listing remarks MLS
Lots of character and room on a corner lot! Plenty of space to entertain out back. Loads of storage with big closets and a detached garage.
Key facts
- Space to entertain
- Loads of storage
- Big closets
Tags
Neighborhood map
What this means for you Summary
Snapshot
- This is a 3-bed/1.0-bath other listed at $85k.
Deal economics
- At list price, monthly cash flow is $392 ($5k/yr) — positive.
- The deal already cash-flows at list — no discount required.
- Meets the 1% rule at list price ($1k rent vs $85k).
- Recommended offer: $84k (1.5% below list) — sets the bar for market timing.
- Cap rate 11.8% vs local median 2.1% in Manor — top-decile yield for the area; either an underpriced asset or a hidden risk that comps aren't pricing in. Stress-test before assuming the spread holds.
Location & tenants
- Location reads 68/100 on livability (#888 in PA) — a middle-class / working-renter tenant base. Strengths: crime A+, employment A+, cost of living A+; Watch: amenities F, commute F, health & safety F.
- Hempfield Area SD (suburban): math 50% / reading 64% proficiency, ranked #90 of 539 in PA (top 17%) — acceptable for families but not a draw, mixed tenant base, ~2y average lease.
- Zoned schools: Hempfield Area Shs (math 73% / reading 24%, grade D, #151 of 437 statewide, top 35%, 1,661 students, 24% FRL) — zoned schools at 24% FRL track the district average.
- Market conditions: 8 active listings in the ZIP; 415 units permitted in Westmoreland County in 2024 (10 in 5+ unit buildings).
Forward outlook
- Local home prices are declining (-1.4%/yr); year-one equity from $588 of loan paydown is wiped out by about $1k of value loss. Plan a longer hold.
- Westmoreland County population projected at -19% by 2050 — secular population decline; favor cash flow + early exit over multi-decade hold.
- At projected returns (-1.4% appreciation + 3.0% rent growth), your $24k cash investment doubles in ~5 years — after that, you're playing with house money.
Negotiation context
- It's been on market 19 days — a 2% lower offer ($84k) is reasonable based on typical stale-listing flexibility.
- 2 sale attempts since 13y ago with the ask held roughly flat each time — persistent listings suggest the price (not the market) is what's stuck; bring a comps-based counter.
Risks & watch-outs
- Watch-outs: built in 1900 — expect roof / HVAC / electrical / plumbing capex.
Questions for the listing agent
- Built in 1900 — when were the roof, HVAC, electrical panel, plumbing, and water heater last replaced?
- Is there a deadline driving the sale (1031 exchange, divorce, estate, relocation)? That informs how much negotiation room exists.
- Schools are D-rated, which usually means shorter tenancies and higher turnover. Who's the typical renter profile here, and what's been the actual vacancy rate?
- What's the average days-on-market for RENTAL listings here right now (not sales)? A rising rental-DOM trend means longer vacancies and softer asking-rent achievability than the comps imply.
- What's the recent tenant-quality profile in this submarket — average credit score on applications, eviction rate, late-payment / NSF rate, and stable-employment percentage? A property-management company in the area should have these aggregated.
- How much new for-sale + rental construction is in the pipeline within 1–3 miles? Heavy new supply typically softens prices + rents 12–24 months out; constrained supply supports both.
Investment metrics
- 1% rule
- 1.50% ✓
- Cap rate
- 11.83%
- Cash-on-cash
- 19.78%
- DSCR
- 1.88
- GRM
- 5.5
CMA / ARV
- ARV (median comp)
- $185,335
- List price
- $85,000
- Delta
- -54.14%
- Verdict
- UNDERPRICED
- Comps
- 20 within 1.0 mi
Projected returns pro-forma
-1.41% appreciation · 3.0% rent growth · sell at horizon
- IRR
- 16.2%
- Equity multiple
- 1.72×
- Total profit
- $17,083
- Equity at exit
- $18,874
- IRR
- 22.5%
- Equity multiple
- 3.21×
- Total profit
- $52,569
- Equity at exit
- $18,450
Cash invested: $23,800 (down + closing). Projections, not guarantees.
Landlord ↔ Tenant lean methodology
- Overall (STATE)
- 62 Landlord-Friendly
- State Pennsylvania
- 62 Landlord-Friendly · EVEN
- County
- — inherits STATE
- City
- — inherits STATE
ZIP-level market 15665
- Home prices YoY
- -0.8%
- Active inventory
- 8
- Price-to-rent
- 5.5×
Monthly cashflow live
- Estimated rent
- $1,279 medium interval (Pro) →
- Mortgage (P&I)
- −$446
- Tax from tax record
- −$137 /mo · $1,639/yr
- Insurance
- −$35
- HOA
- −$0
- Vacancy / Maint / Mgmt
- −$269
- Net cashflow
- $392
Break-even live
Sensitivity live
| Price | -10% $440 | -5% $416 | +0% $392 | +5% $368 | +10% $344 |
|---|---|---|---|---|---|
| Rent | -10% $291 | -5% $342 | +0% $392 | +5% $443 | +10% $493 |
| Rate | -1.0pp $435 | -0.5pp $414 | base $392 | +0.5pp $370 | +1.0pp $348 |
UW: 25.0% down · 7.5% · 30yr · 1.5% tax · 5.0% vac · 8.0% maint · 8.0% mgmt
Financing live
Cash to close
- Down payment
- $21,250
- Closing costs
- $2,550
- Reserves months
- —
- Total cash needed
- —
Loan-product check · same deal, 3 products live
Conventional
25% down · 7.5% · 30yr
- Down + closing
- —
- Monthly P&I
- —
- Monthly cashflow
- —
- DSCR
- —
- Eligible?
- —
Personal DTI + credit; lowest rate.
DSCR
20% down · 8.5% · 30yr
- Down + closing
- —
- Monthly P&I
- —
- Monthly cashflow
- —
- DSCR
- —
- Eligible?
- —
No personal income docs; deal must DSCR.
Hard money
10% down · 12.0% · 12mo
- Down + closing
- —
- Monthly P&I
- —
- Monthly cashflow
- —
- DSCR
- —
- Eligible?
- —
Short-term bridge; refi at stabilization.
Listing history 7 events
-
2026-05-05status Pending 140-char remark
Show marketing remark (140 chars)
Lots of character and room on a corner lot! Plenty of space to entertain out back. Loads of storage with big closets and a detached garage.
-
2026-04-16$85,000 Active 140-char remark
Show marketing remark (140 chars)
Lots of character and room on a corner lot! Plenty of space to entertain out back. Loads of storage with big closets and a detached garage.
-
2015-12-09price $98,000 433-char remark
Show marketing remark (433 chars)
Loads of old character and charm! Very well maintained home. Corner Lot. Newer roof and windows. Hardwood floors throughout. Galley Style Kitchen. Huge 21x14 Back Deck great for entertaining. Very Spacious Rooms. Master Bedroom has walk in closet. 2 Car Detached Garage with lots of storage in the loft. Enclosed sunroom with lots of natural night. Interior french drain and sump pump in basement. Home Warranty Included. A must see!
-
2014-06-04soldstatus $98,000
-
2014-05-30price $93,000 433-char remark
Show marketing remark (433 chars)
Loads of old character and charm! Very well maintained home. Corner Lot. Newer roof and windows. Hardwood floors throughout. Galley Style Kitchen. Huge 21x14 Back Deck great for entertaining. Very Spacious Rooms. Master Bedroom has walk in closet. 2 Car Detached Garage with lots of storage in the loft. Enclosed sunroom with lots of natural night. Interior french drain and sump pump in basement. Home Warranty Included. A must see!
-
2014-05-29soldstatus $98,000 433-char remark
Show marketing remark (433 chars)
Loads of old character and charm! Very well maintained home. Corner Lot. Newer roof and windows. Hardwood floors throughout. Galley Style Kitchen. Huge 21x14 Back Deck great for entertaining. Very Spacious Rooms. Master Bedroom has walk in closet. 2 Car Detached Garage with lots of storage in the loft. Enclosed sunroom with lots of natural night. Interior french drain and sump pump in basement. Home Warranty Included. A must see!
-
2013-08-01$93,000 433-char remark
Show marketing remark (433 chars)
Loads of old character and charm! Very well maintained home. Corner Lot. Newer roof and windows. Hardwood floors throughout. Galley Style Kitchen. Huge 21x14 Back Deck great for entertaining. Very Spacious Rooms. Master Bedroom has walk in closet. 2 Car Detached Garage with lots of storage in the loft. Enclosed sunroom with lots of natural night. Interior french drain and sump pump in basement. Home Warranty Included. A must see!
ⓘ Source: listings_history table (triggers on properties + properties_extension) + one-shot
backfill from property_details.listing_events for pre-trigger history.
Tax reassessment forecast PA · Partial reset (capped growth)
- Current annual tax
- $1,639 · $137/mo
- Projected year-2 tax
- $1,639 · $137/mo
- Expected delta
- $0/yr ($0/mo · 0.0%)
ⓘ Screening estimate from a state-policy table — verify with the county assessor before closing.
Climate risk First Street
- Flood 1/10 Low FEMA zone X (unshaded) · 0% chance over 30 yrs
- Wildfire 1/10 Low
- Heat 4/10 Moderate 7 d/yr ≥96°F today · 19 d/yr by 30 yrs out
- Wind 2/10 Low
- Air quality 3/10 Moderate 3 unhealthy d/yr today · 5 by 30 yrs out
Nearby sold comps map
Loading sold comps map…
Walkable amenities ~0.75 mi
Loading nearby amenities…
Taxation est. · year 1
- Rental income
- $15,344
- − Mortgage interest
- −$4,761
- − Property taxes
- −$1,639
- − Insurance
- −$425
- − Repairs & maintenance
- −$1,228
- − Management
- −$1,228
- − Depreciation
- −$2,473
- Taxable income
- $3,591
- Est. tax owed @ 24.0%
- −$862
- After-tax cash flow
- $3,847/yr
For passive investors: Depreciation is non-cash, so a rental often shows a tax loss while cash-flowing — sheltering income. Rental losses are passive: they offset passive income freely, and up to $25,000/yr can offset ordinary (W-2) income if you actively participate and your MAGI is under $100k (phasing out to $0 by $150k); unused losses carry forward. On sale, claimed depreciation is recaptured at up to 25%, and gains may owe capital-gains tax (a 1031 exchange can defer both). Figures are a year-1 estimate at your 24.0% rate — not tax advice; consult a CPA.
Schools (NCES district)
- District
- Hempfield Area SD
- NCES district ID
- 4211760
- Math proficiency
- 50% ▼ -11.00%
- Reading proficiency
- 64% ▼ -12.00%
- Median HH income
- $54,928
- Composite
- 49.01/100
- National rank
- #2066
- State rank
- #90 of 539 in PA
Livability — Manor
- Score
- 68/100
- State rank
- #888
- US rank
- #9450
Category grades
Schools grade is shown separately in the Schools card above.
Census & demographics
- Census place
- Manor, PA
- City population
- 1,171
- Population (ZIP)
- 1,171
Population outlook (Westmoreland County) Hauer SSP2
- Today (2025)
- 342,555 people
- By 2030
- 331,717 · -3.2%
- By 2040
- 304,976 · -11.0%
- By 2050
- 277,444 · -19.0%
- By 2075
- 224,607 · -34.4%
- By 2100
- 171,084 · -50.1%
Race, ethnicity, and origin ACS 2023
- Neighborhood character
- Predominantly White (93%)
- Race & ethnicity
- White 93% Hispanic / Latino 5% Two or more races 2%
- Common ancestry
- Romanian 5% Serbian 3% Polish 2%
Political lean MEDSL · Westmoreland
- 2024 margin
- Strong R (+28.4) · D 35.4% · R 63.9%
- 2008→2024 swing
- -11.7pp toward R · 2008: -16.7pp · 2024: -28.4pp
- All cycles
- 2024: R+28.4 2020: R+28.3 2016: R+31.3 2012: R+23.7 2008: R+16.7
Not yet ingested
- Civics
- —
Market trends
- HPI YoY
- ▼ -1.41%
- Current HPI
- 178.8802
- Rent YoY
- —
- Metro
- —
- State GDP YoY
- ▲ 1.68%
- F500 in state
- 34
Industry mix (Fortune 500 HQ in PA)
| Industry | F500 HQs | Revenue |
|---|---|---|
| Healthcare | 2 | $309B |
|
||
| Insurance | 2 | $27B |
|
||
| Telecommunications / Media | 1 | $124B |
|
||
| Industrial Distribution | 1 | $22B |
|
||
| Financial Services | 1 | $20B |
|
||
| Chemicals / Materials | 1 | $18B |
|
||
Price history
-8.6% since first listed7 events — show timeline
- 2026-05-05 Pending — West Penn MLS
- 2026-04-16 Listed $85,000 West Penn MLS
- 2015-12-09 Price Changed $98,000 West Penn MLS
- 2014-06-04 Sold (Public Records) $98,000 Public Records
- 2014-05-30 Price Changed $93,000 West Penn MLS
- 2014-05-29 Sold (MLS) $98,000 West Penn MLS
- 2013-08-01 Listed $93,000 West Penn MLS
Property tax history
+2.1%/yrLatest (2026): $1,639 · +0.0% YoY. Source: county tax records.
Cash-flow waterfall
monthlySold comps — $/sqft
last 12 mo · ≤1 miLoading sold comps…